Abstract
Lithium hexamethyldisilazide (LiHMDS)-mediated enolization of (+)-4-benzyl-3-propionyl-2-oxazolidinone in THF–hydrocarbon mixtures shows unusual sensitivity to the choice of hydrocarbon cosolvent (hexane versus toluene) and to isotopic labeling. Four mechanisms corresponding to monosolvated monomers, trisolvated dimers, octasolvated monomers, and octasolvated dimers were identified. Even under conditions in which the LiHMDS monomer was the dominant observable form, dimer-based metalation was significant. The mechanism-dependent isotope and cosolvent effects are discussed in the context of ground state stabilization and transition-state tunneling.
Graphical Abstract
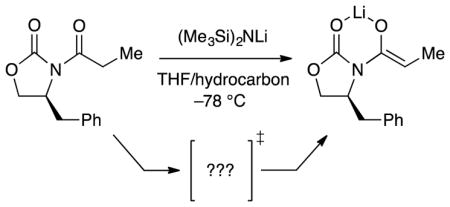
Introduction
Lithium hexamethyldisilazide (LiHMDS) is second only to lithium diisopropylamide (LDA) in its importance as a lithium amide base in organic chemistry.1 In light of the low basicity (low pKb) of LiHMDS relative to that of lithium dialkylamides,2 one might be tempted to attribute the high efficacy of the former to appreciable concentrations of monomer in neat tetrahydrofuran (THF; eq 1).3,4,5 Although the results of numerous crystallographic,6 spectroscopic,3 and computational7,8,9 studies have been published, only a few affiliated mechanistic studies have been undertaken.6,10 In particular, the enolization of 2-methylcyclohexanone has been shown to proceed via a seemingly straightforward disolvated-monomer-based mechanism (eq 2) and proves particularly germane to the work described herein.
 |
(1) |
 |
(2) |
As part of our investigation of oxazolidinone-based enolates,11 we were drawn to the sequential enolization aldol addition used by Pfizer in a plant-scale preparation of filibuvir.12 The transformation proved particularly idiosyncratic on this scale.13,14
 |
(3) |
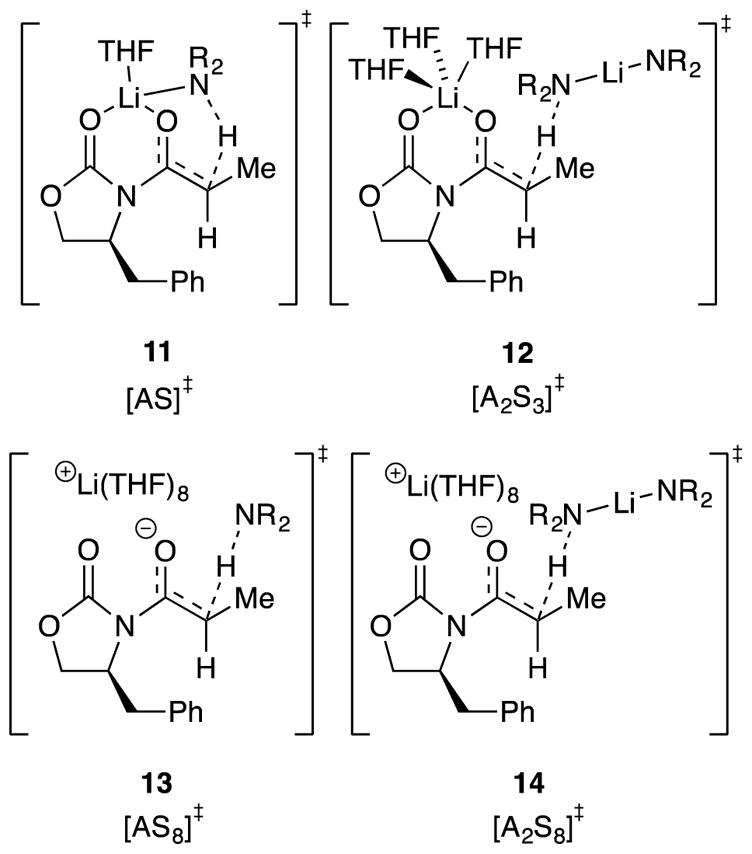
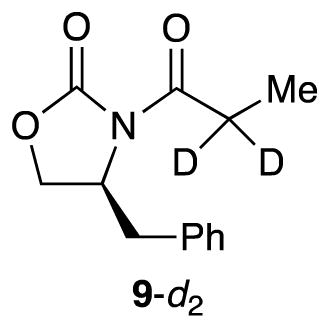
In this paper we describe the mechanisms of LiHMDS-mediated oxazolidinone enolizations. Guided by recent enolate structural studies11 and a desire to attenuate the metalation rates, we focused on propionate analogue 9 (eq 4), fully expecting an uneventful prologue to our study of the Pfizer sequence. What emerged was a complex scenario in which four pathways represented by the four transition structures in Chart 1 competed for dominance. Notable observations included the importance of monomers and fully ionized triple ions, which showed the full complement of primary and secondary solvation shells, as well as dimer-based pathways that were significant even when monomer was the observable form. Solvation and isotope effects on the rates were considerable, mechanism-dependent, and central to deconvoluting the contributing mechanisms.
Chart 1.
 |
(4) |
Results
Describing complex mechanisms demands literary expediencies such as the plot-spoiling summary in Chart 1. We also introduce shorthand in which A is a LiHMDS subunit and S is THF. For example, A2S2 refers to dimer 1, whereas [A2S3]‡ denotes a trisolvated-dimer-based transition structure such as 12. Substrates 9 and 9-d2 are omitted to minimize clutter.
Enolizations of 9 with recrystallized LiHMDS15 in THF–hydrocarbon mixtures were monitored using in situ IR spectroscopy16 to follow the loss of the oxazolidinone absorbance at 1783–1793 cm−1 and appearance of an enolate absorbance at 1733–1740 cm−1.17 We found no evidence of precomplexation except at very low THF concentrations,18 conditions that were assiduously avoided. Enolizations under pseudo-first-order conditions (0.0050 M substrate) displayed first-order decays affording fits to A = A0e−bx + c such that b is the pseudo-first-order rate constant, kobsd, and c is a baseline correction.19 In a control experiment, zeroing the baseline and injecting a second aliquot of 9 did not change kobsd, which confirmed the absence of autocatalysis.20 In one instance, initial rates were used instead of kobsd as proxies for rates.21
Solvent and Isotope Effects
Deconvoluting the contributing pathways to assemble a unified mechanistic hypothesis depended critically on a combination of cosolvent (hexane versus toluene) and isotopic (9 versus 9-d2) sensitivities that perturbed the relative proportions of the contributing pathways. This section delineates the insights gained from the solvent, cosolvent, and isotopic dependencies viewed in isolation from other data and notes salient observations. Critically, as the THF concentration changed from 1.0 M to 12 M,22 LiHMDS shifted from >99% disolvated dimer A2S2 (1) to 97% trisolvated monomer AS3 (2), as shown in eq 1.5,23 The equilibrium in eq 1 was reexamined to compare the influence of hydrocarbon cosolvent on the dimer–monomer ratio, and no dependencies were detected outside a narrow experimental error. The subsequent sections describe the affiliated LiHMDS orders and construction of the mechanistic and affiliated mathematical models.
Figures 1–3 show plots of the THF-concentration-dependent rates for the lithiation of oxazolidinone 9 and isotopologue 9-d2 in THF–hexane and THF–toluene mixtures. One might expect these rates to be qualitatively similar, but even casual inspection shows that they are not. The curves represent best-fit numerical integrations to a single model (vide infra). The solvent dependencies, with a few comments and some foreshadowing, are as follows.
Figure 1.
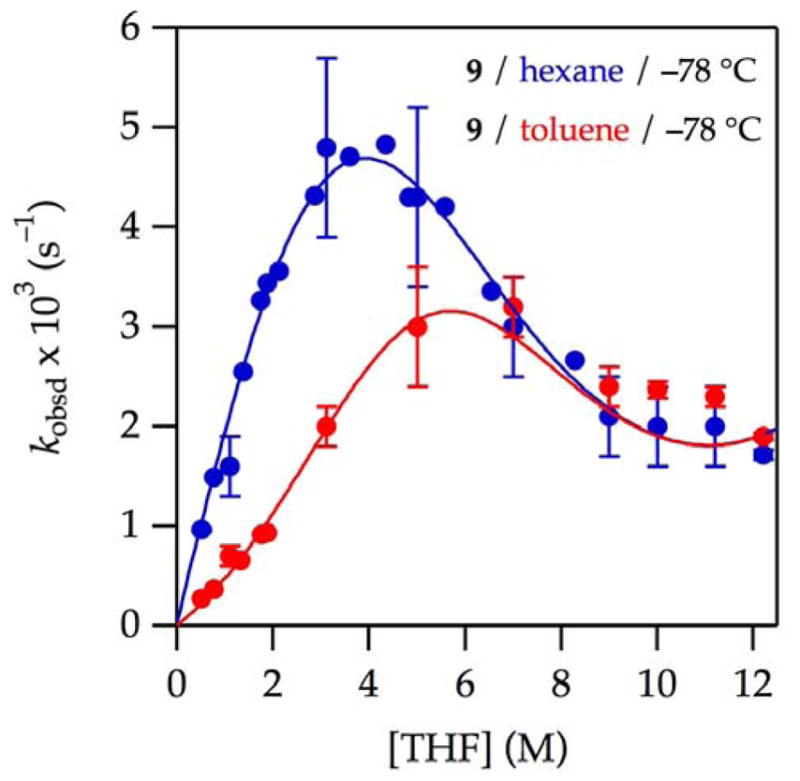
Plot of kobsd vs tetrahydrofuran (THF) concentration25 for the enolization of 0.0050 M oxazolidinone 9 with 0.10 M lithium hexamethyldisilazide (LiHMDS) with THF in hexane (
 ) and toluene (
 ) at −78 °C. The curve depicts an unweighted least-squares fit to the composite model described by eq 12 (vide infra).
 (hexane): [A]0 is set at 0.10 M; Keq = (2.3 ± 0.2) × 10−4; k8 = (3.9 ± 0.1) × 10−2; k9 = (2 ± 10) × 10−8; k10 is set to 2.0 × 10⁻⁴; k11 = (5 ± 4) × 10−10.
 (toluene): All parameters carried over from the fit from curve A; additionally, a = −3.19 × 10⁻⁵; b = 3.36 × 10⁻⁵; c is set at 1.0; and m = 4.81.
Figure 3.
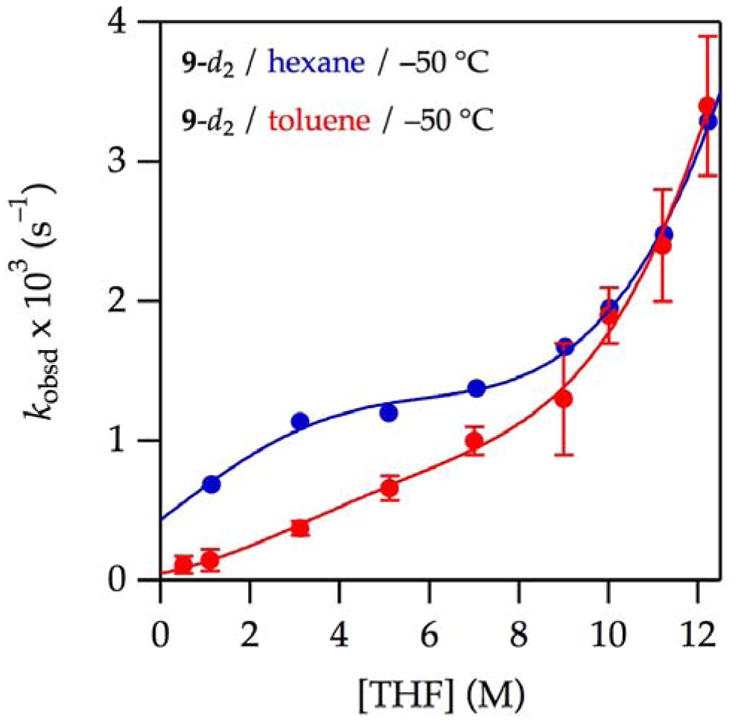
Plot of kobsd vs THF concentration for the enolization of 0.0050 M oxazolidinone 9-d2 with 0.10 M LiHMDS with THF at −50 ºC in hexane (
 ) and toluene (
 ). The curves depict an unweighted least-squares fit to the composite model described by eq 12 (vide infra).
 (hexane): [A]0 is set at 0.10 M; Keq = (4 ± 3) × 10−5; k8 = (5 ± 1) × 10−3; k9 = (5 ± 5) × 10−8; k10 = (1.9 ± 0.6) × 10−3; k11 = (4 ± 1) × 10−10.
 (toluene): All parameters carried over from the fit from curve A; additionally, a = −4 × 10⁻²; b = 9.2 × 10⁻³; c = 1.04; and m = 1.2.
A plot of kobsd versus THF concentration in hexane (see Figure 1,
 ) displays a striking maximum at 3–4 M THF and an apparent plateauing of the rates in neat THF. Qualitatively, the first-order dependence at low THF concentration suggests a mechanism requiring one more THF ligand than the number found on A2S2 as expected for either [AS2]‡ or [A2S3]‡.24 The inverse dependence at high THF concentration indicates a dominant pathway in which the observable AS3 monomer is necessarily oversolvated—has more solvents than optimal at the maximum—and thereby requires dissociation of one or more THF ligands en route to enolization. The data fit credibly (albeit imperfectly) to a simple model built on a single AS2-based metalation (curve not shown), but subsequent data completely undermined such a model. To the contrary, we found no evidence of contributions from [AS2]‡.
Enolizations in THF–toluene (see Figure 1,
 ) showed measurable retardation by toluene. As discussed below, we entertained a variety of models to account for the suppression of enolization by toluene as well as an upward curvature at low THF concentrations that appeared to be emblematic of a higher-order THF-dependent pathway.
Isotopically labeled 9-d2 in THF–hexane (see Figure 2,
 ) markedly suppressed the dominant pathway(s) and affiliated rate maximum. What had previously appeared to be a saturation of the rate at high THF concentration was clearly the emergence of a highly THF-concentration-dependent pathway. Throughout the study we suspected that a THF-concentration-independent enolization, a non-zero y-intercept, might exist, and this plot provided the most compelling evidence. Notably, the results of selective rate suppression via deuteration suggest that various mechanistic contributions have markedly different isotopic sensitivities.
A combination of isotopically labeled 9-d2 and toluene as cosolvent (see Figure 2,
 ) suppressed the previously dominant pathway so as to remove the maximum altogether. The data at −78 °C showed no fine structure (subtle curvatures), but the slow enolization demanded initial rates rather than the preferred kobsd. Accordingly, we sought higher-quality measurements at −50 °C. The data in THF–hexane (see Figure 3,
 ) measured at −50 °C were quite similar to those obtained at −78 °C. The data in toluene (
 ) approximated a simple high-order THF dependence along with a marginally detectable perturbation. Dismissing the perturbation as error would have been tempting were it not for the curves in Figures 1 and 2.
Figure 2.
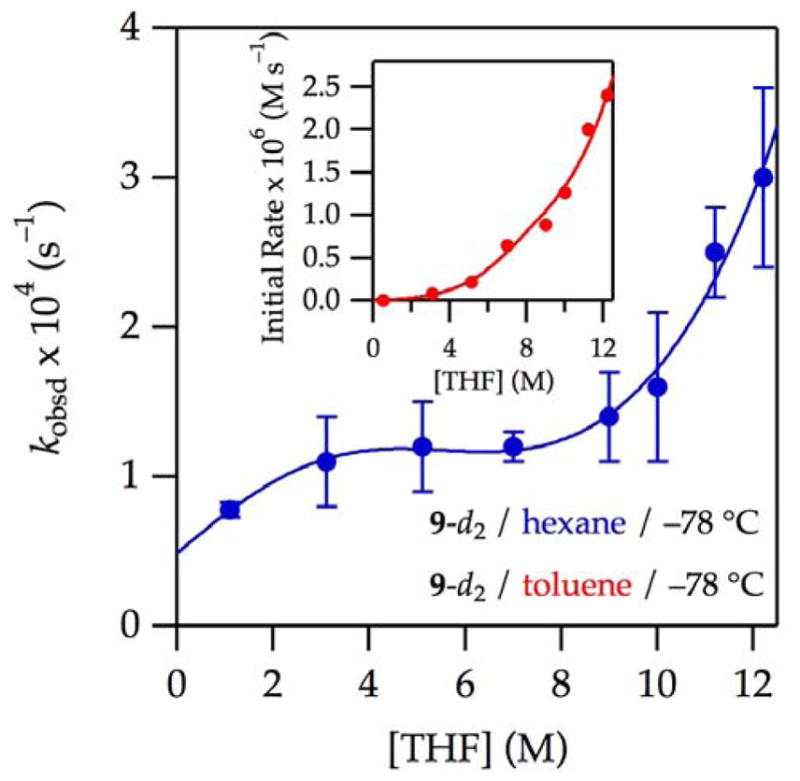
Plot of kobsd vs THF concentration for the enolization of 0.0050 M oxazolidinone 9-d2 with 0.10 M LiHMDS with THF in hexane or toluene cosolvent at −78 °C. The curves depict unweighted least-squares fits to the model described by eq 12 (vide infra).
 (hexane): [A]0 is set at 0.10 M; Keq = (1.1 ± 1) × 10−4; k8 = (5 ± 4) × 10−4; k9 = (8 ± 20) × 10−9; k10 = (2.2 ± 1) × 10−4; k11 = (7 ± 3) × 10−11.
 (toluene) measured using initial rates: All parameters carried over from the fit from curve A; additionally, a = (−2 ± 1) × 10−4; b = (1.4 ± 0.9) × 10−4; c = 1.58 ± 0.06; and m = 5.
It is instructive to present the cosolvent and isotope effects from slightly different perspectives. The effect of toluene near the rate maxima is illustrated by a plot of kobsd versus toluene concentration at a fixed 3.1 M THF concentration (Figure 4). The fit is essentially an inverse-first-order dependence with provisions for non-zero y-intercepts. The factor of two is energetically trivial, but the influence on the curvatures is not.
Figure 4.
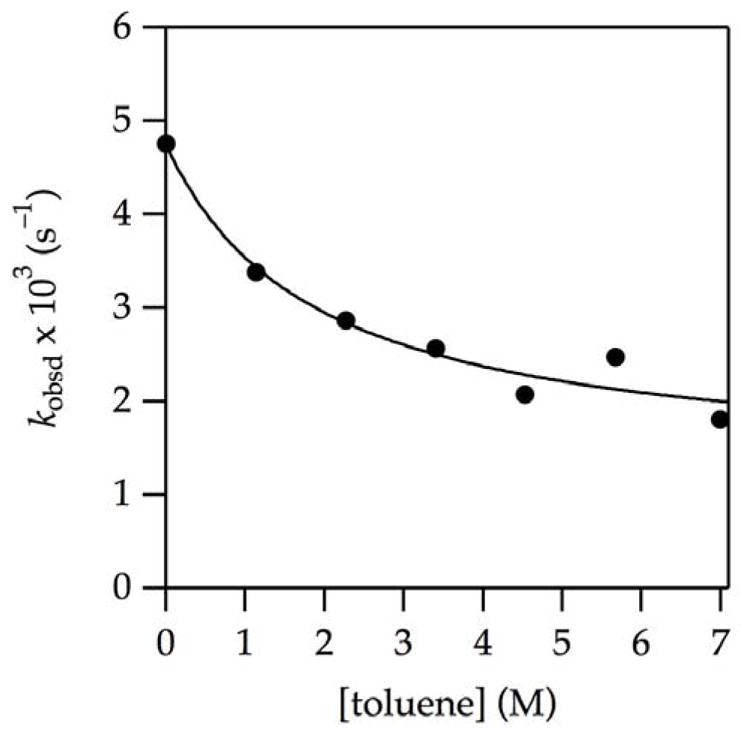
Plot of kobsd vs toluene concentration for the enolization of 0.0050 M oxazolidinone 9 with 0.10 M LiHMDS with toluene in 3.1 M THF–hexane at −78 °C. The curve depicts an unweighted least-squares fit to f(x) = (a + bx)/(1 + cx)5; a = (4.7 ± 0.2) × 10−3; b = (7 ± 5) × 10−4; and c = 0.5 ± 0.2.
Plotting kH/kD versus THF concentration in hexane and toluene, as shown in Figure 5 (note the different temperatures), reveals a number of critical observations: (1) the isotope effects may seem uncharacteristically large to the casual observer, but such large effects are observed routinely in a number of metalations26,27; (2) the existence of a maximum in the isotope effect reveals at least three contributing mechanisms that, crudely speaking, correspond to low, intermediate, and high THF concentrations; (3) the maximum isotope effect at the intermediate THF concentrations coincides with the rate maxima that are suppressed by deuteration and toluene; and (4) the odd fine structures in the best-fit curves are consequences of the mathematical model discussed below.
Figure 5.
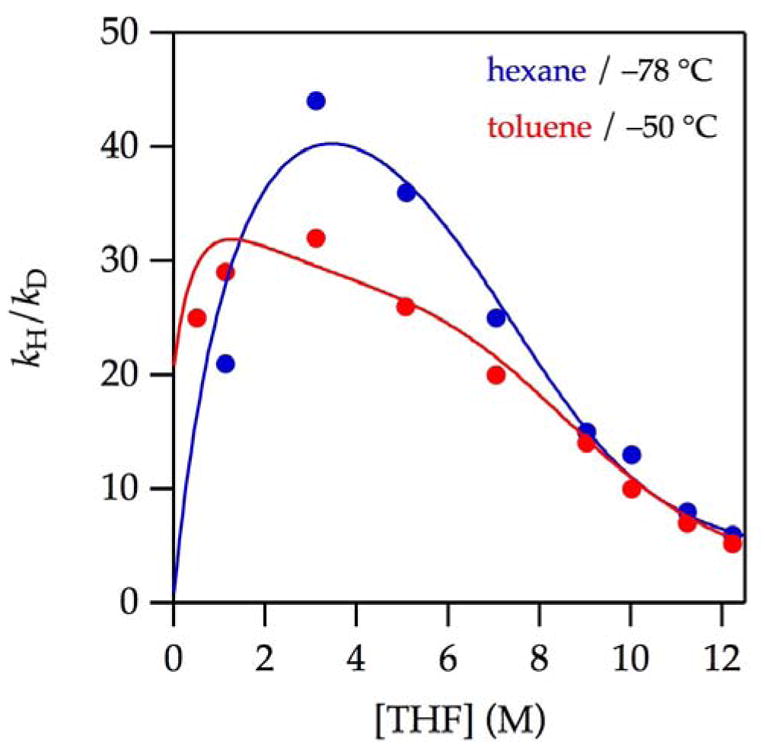
Plot of kH/kD vs THF concentration for the enolization of 0.0050 M oxazolidinones 9-d2 and 9 with 0.10 M LiHMDS with THF at −78 °C in hexane (
 ) and toluene (
 ). The curves are provided by dividing kobsd for 9 by that of 9-d2 using the parameters reported in Figures 1 and 3.
Orders in LiHMDS
Complex mechanisms often call for multidimensional rate studies. The LiHMDS reaction order, for example, varies with changes in THF concentration, choice of hydrocarbon cosolvent, and isotopic labeling, as summarized in Table 1.28 Note that the LiHMDS orders are confounding without consideration of the observable form of LiHMDS—dimer at low THF concentration and monomer at high—because the stoichiometry of the transition structure is measured relative to the reactant.24
Table 1.
LiHMDS Reaction Order as a Function of Tetrahydrofuran (THF) and Cosolvent Concentrations and Isotopic Labeling
| entry | subst | cosolvent | [THF] (M) | order | [Am]‡ |
|---|---|---|---|---|---|
| 1 | 9 | hexane | 1.0 | 1.1 ± 0.1 | [A2]‡ |
| 2 | 9 | hexane | 7.1 | 1.20 ± 0.04 | [A2]‡, [A]‡ |
| 3 | 9 | — | 12.2 (neat) | 1.40 ± 0.03 | [A2]‡, [A]‡ |
|
| |||||
| 4 | 9 | toluene | 1.0 | 0.75 ± 0.04 | [A2]‡, [A]‡ |
| 5 | 9 | toluene | 7.1 | 1.14 ± 0.05 | [A2]‡, [A]‡ |
|
| |||||
| 6 | 9-d2 | hexane | 3.1 | 0.76 ± 0.08 | [A2]‡, [A]‡ |
| 7 | 9-d2 | --- | 12.2 (neat) | 1.32 ± 0.03 | [A2]‡, [A]‡ |
| 8 | 9-d2 | toluene | 1.0 | 0.7 ± 0.1 | [A2]‡, [A]‡ |
We offer graphical depictions of several LiHMDS orders emblematically. Plotting kobsd versus LiHMDS concentration at low THF concentration (1.0 M) in hexane (see Figure 1, left edge of
 ) is cleanly first-order in LiHMDS (Figure 6,
 and Table 1, entry 1). The linear dependence of kobsd in conjunction with spectroscopy showing exclusively (>99%) dimer 1 and a first-order THF dependence implicates lithiation via an [A2S3]‡ transition structure. At increasing THF concentrations, which promote the formation of monomer as the observable form, the LiHMDS order increases (Table 1, entries 2 and 3). In neat THF, wherein LiHMDS is 97% monomer, a LiHMDS order of 1.40 (Table 1, entry 3, and Figure 7) implicates the composite of first and second orders expected if both monomer- and dimer-based metalations contribute. Thus, the observable AS3 monomer
2
in conjunction with a LiHMDS order greater than 1.0 indicates that monomer is associating into a dimer to lithiate
9. However, the curvatures in Figures 2 and 3 indicate an underlying set of highly solvated transition structures (below).
Figure 6.
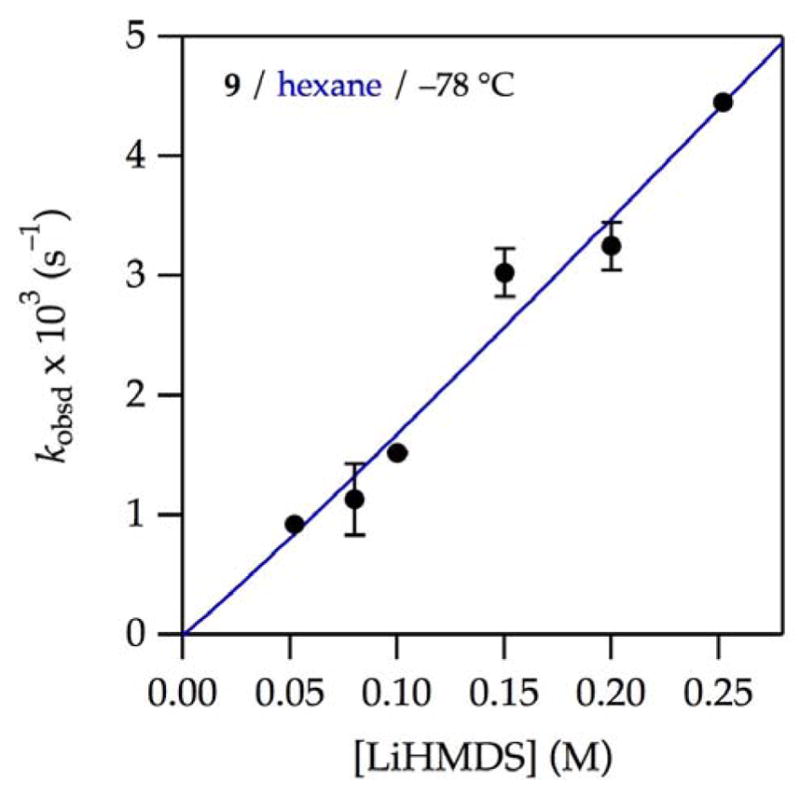
Plot of kobsd vs LiHMDS concentration for the enolization of 0.0050 M oxazolidinone 9 with LiHMDS28 and 1.0 M THF–hexane at −78 °C. The curves depict unweighted least–squares fits to kobsd = k[LiHMDS]n. k = (1.9 ± 0.4) × 10−2 s−1; n = 1.1 ± 0.1.
Figure 7.
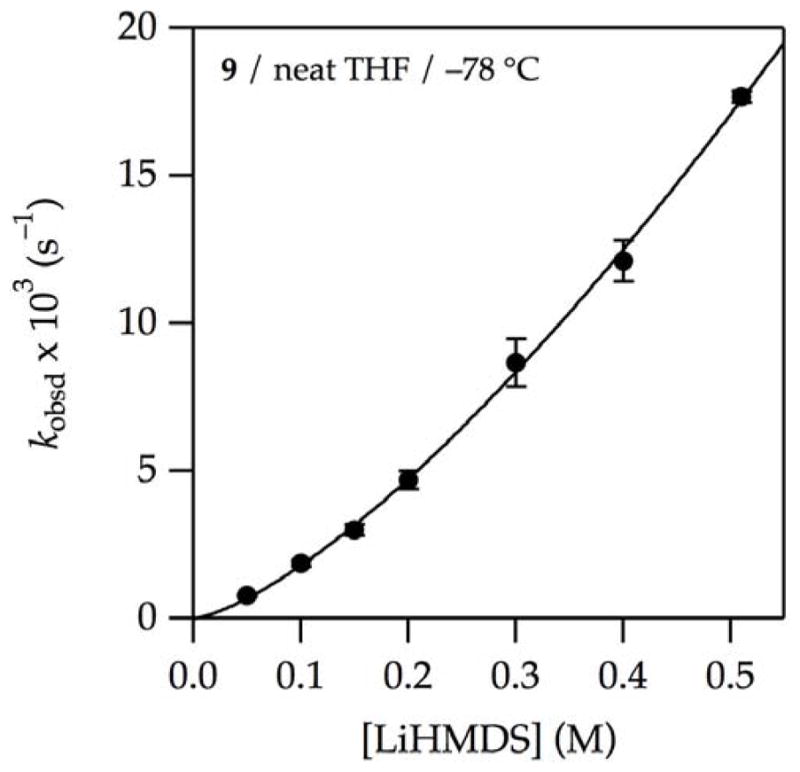
Plot of kobsd vs LiHMDS concentration for the enolization of 0.0050 M oxazolidinone 9 with LiHMDS in neat THF at −78 °C. The curve depicts an unweighted least-squares fit to kobsd = k[LiHMDS]n. k = (4.5 ± 0.1) × 10−2 s−1; n = 1.40 ± 0.03.
Mechanistic Model
Possible contributions to the rate law are generically depicted in eqs 5 and 6 and described mathematically by the generalized rate law in eq 7. (Recall that substrate 9 has been omitted for simplicity.) Eq 7 includes provisions for dimer–monomer equilibrium (Keq, eq 1) and an indefinite number of mechanisms of arbitrary aggregation and solvation states.
| (5) |
| (6) |
| (7) |
The maximum in the plot of kinetic isotope effects versus THF concentration demands the involvement of at least three lithiation pathways. When including the added constraints of the dependencies on THF and LiHMDS concentrations, cosolvent, and isotopic substitution, the subset of mechanisms required to fit all data, in particular, the functions for THF dependencies in Figures 1–3, includes only four pathways (eqs 8–11), as described mathematically by eq 12. Of course, other minor pathways may contribute, but only eqs 8–11 are consistent with the constraints of Occam’s razor.29
The THF–toluene fits pivot about the fits for the enolization of 9 and 9-d2 in THF–hexane. Thus, Keq corresponds to the equilibrium constant in eq 1. The four rate constants (k8–k11) are numbered according to the equation number for which they are affiliated (eqs 8–11). Keq and k8–k11 are adjustable parameters. The value 12.3–[THF] represents the proportion of toluene scaled to neat THF concentration, 12.3 M. Whereas the [A2S3]‡ stoichiometry (affiliated with k8) is preset based on simulations demonstrating its importance, n is an adjustable parameter that can be left to ascertain the highly solvated contributions for the plots in Figures 2 and 3. Within these plots, the curvatures provide data that strongly support contributions from ASn and A2Sn, such that n approximates 8. We therefore set the value of n to 8. The curves in Figure 1, by contrast, lack adequate fine structure in the high THF region to extract n as an adjustable parameter; n is necessarily preset at 8 from the other data. Fits of the THF–toluene data in Figures 1–3 use the values of Keq and k8–k11 and apply a toluene-dependent weighting function, f[S], to the rates measured in toluene as described below.
| (8) |
| (9) |
| (10) |
| (11) |
such that
| (12) |
We cannot possibly recount in detail the copious trials and errors or even the intimate details of the fits described herein. Supporting information fills at least some of these gaps. The model was constrained, successfully we hasten to add, by demands for a single set of rate and equilibrium constants for multiple fits and a means with which to account for rate suppression by toluene. The evidence demanding these four contributions, however, can be summarized in generalized terms as follows:
[A2S3]‡ (eq 8) stems from the first-order THF dependencies on THF and LiHMDS concentrations at low THF concentrations in hexane (see Figure 1,
 ).
).For a protracted period, we believed that [A2S4]‡ (eq 9) was required to account for the upwardly curving THF dependence at low THF concentrations in toluene (see Figure 1,
 ), but this conclusion was, in part, a red herring created by structural flaws in our modeling. We attribute the upward curvature to a non-linear influence of toluene (vide infra) combined with contributions from the more highly solvated pathways.
The dropping isotope effect in Figure 5 demands a pathway emerging near the y intercept. [AS]‡ (eq 10) provides for non-zero intercepts—rates in the limit of no free THF—that are minor at best and, in some cases, difficult to detect. The attribution to [AS]‡ rather than [A2S2]‡ (both fit the solvent-dependent data equally well) derives from fractional LiHMDS orders measured at low THF concentrations (Table 1, entries 4 and 8). Computed barriers, by contrast, argue strongly for the [A2S2]‡ mechanism instead, and we discuss this disagreement below. Regardless, this term is of minor importance to the modeling and our thinking.
The manifest upward curvatures at high THF concentration depicted in Figure 2 in tandem with an elevated LiHMDS order of 1.40 point to the coexistence of highly solvated monomer- and dimer-based transition states. We often invoke ionized fragments when confronted with highly solvated forms, and in this model we presume that the lithium gegenions affiliated with the highly solvated monomer and dimer share a common solvation state. Fitting the THF dependencies in Figure 2 while accounting for the elevated LiHMDS order affords an n value of 8, which is consistent with that of [AS8]‡ and [A2S8]‡. Given that the upper limit of the primary coordination sphere of a lithium cation appears to octahedral +Li(THF)6,30 invoking higher solvates demands contributions from a secondary solvation shell (vide infra).31,32 We hasten to add that a variety of differentially solvated monomer- and dimer-based pathways adequately model the THF concentration dependencies but conflict with the measured LiHMDS orders.
The most challenging problem proved to be that of adequately describing the influence of toluene. In the discussion below, we ponder the role of ground and transition state effects, which guided our thinking in subtle ways. Early studies simply let k8–k11 float to values for THF–toluene data and THF–hexane independently, but that allowance is structurally flawed because the k values are necessarily constant, whereas the rates are necessarily dependent on toluene concentration.
We reverse-engineered a toluene weighting function by ascertaining the function necessary to impose a successful fit constrained by using a single set of rate constants (Figure 8). Although this model is non-predictive and of limited pedagogical value, it adequately describes the influence of toluene as a cosolvent. Models that assigned explicit stoichiometric roles to toluene and included provisions for differential ground state and transition state stabilization had potential to offer molecular-level insights, but they were unjustifiably intricate compared with the empirically determined toluene weighting function f[S] in Figure 8.
Figure 8.
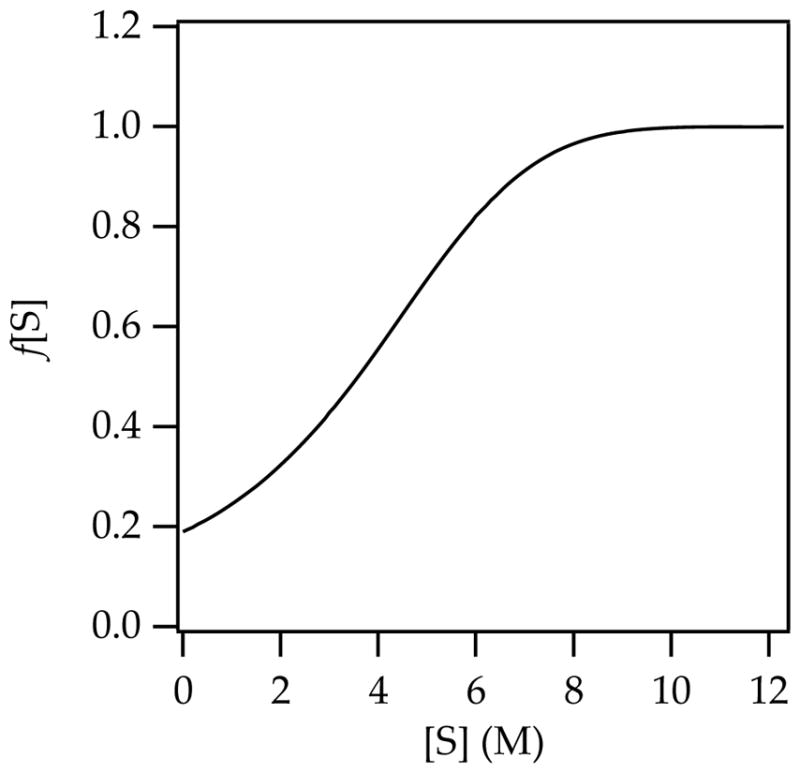
Representative plot of f[S] versus S (THF); all parameters carried over from the fit in Figure 1, curve B.
Computations
Transition structures corresponding to those described by eqs 8–11 (Chart 1) were examined with density functional theory (DFT) calculations at the B3LYP/6–31G(d) level with single-point calculations at the MP2 level of theory.33 The computational study was far more extensive than can be justifiably described herein. (See the supporting information for additional results.) The transition structures in Chart 1 provide pleasing depictions and confirmation of some level of viability, but thermochemical insights are limited by the non-isodesmic relationships.34
The [AS8]‡ and [A2S8]‡ structures were well beyond the scope of our computational approach. We could not calculate the putative +LiS6 core structure despite undeniable experimental support,30 let alone probe secondary-shell solvation. Highly ionic structures also showed electron correlation problems.35 The calculated barriers for [A2S3]‡ and [AS]‡ showed a decidedly large (>8 kcal/mol/lithium) preference for the dimer. Even in this instance, however, large energy differences for such non-isodesmic comparisons were unsurprising.36 We invoked [AS]‡ in place of [A2S2]‡ owing to the fractional LiHMDS order observed experimentally. [A2S2]‡ (15), however, was chemically intuitive, showed a N–H–C alignment approximating 180°, and was only +4.7 kcal/mol/lithium less stable than the more highly solvated [A2S3]‡. When confronted with large theory–experiment disagreements, we instinctively go with experiment, but we do so with pause in this case.
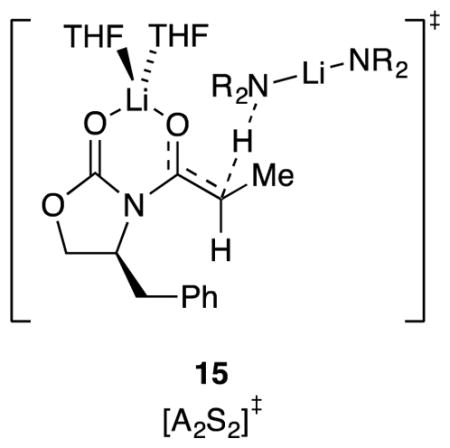
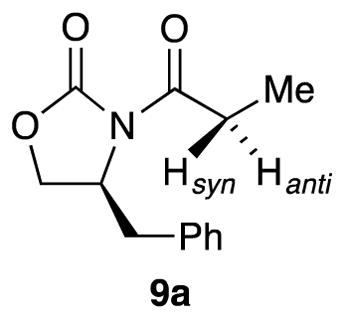
One complicating and potentially critical question was which diastereotopic proton in 9a, Hsyn or Hanti, was abstracted. Hanti was the computationally preferred proton for computationally viable transition structures 11 and 12 (2.5 and 5.6 kcal/mol, respectively). There are potential implications to synthesis that may prove important.
Discussion
Summary
In light of the seemingly straightforward enolization of 2-methylcyclohexanone in eq 1, the complexity of the metalation of 9 in THF–hydrocarbon mixtures emerged unexpectedly. The maximum in the rates obtained using THF–hexane (see Figure 1,
 ) is startling on first inspection, but it is qualitatively consistent with the simple case of an AS2-based pathway accompanied by a shifting ground state (eq 1). At low THF concentration, the A2S2 dimer would be undersolvated, causing a positive order in THF, whereas at high THF concentration, the observable AS3 monomer would be oversolvated, causing an inverse dependence.37 A fit to such a model was tolerable, though not stupendous. Switching from THF–hexane to THF–toluene, however, suppressed the maximum (see Figure 1,
 ), rendering the simple AS2-based metalation untenable. Deuteration (9-d2) further attenuated the dominant pathway (see Figures 2 and 3) and accentuated the complexity by offering views of additional enolization mechanisms. Of particular import, two highly THF-concentration-dependent pathways not easily detected using 9 in THF–hexane became prominent using 9-d2 in THF–hexane and were dominant for 9-d2 in THF–toluene.
The THF concentration dependencies and cosolvent effects in conjunction with multiply measured LiHMDS reaction orders led to a model comprising four mechanisms: [AS]‡, [A2S3]‡, [AS8]‡, and [A2S8]‡. (Substrates 9 and 9-d2 are omitted from the transition structures to reduce clutter.) We hasten to add that THF-concentration-dependent isotope effects (see Figure 5) required the involvement of at least three mechanisms; the final model containing four is reasonable. Additional mechanisms may be involved, but a single mathematical model including these four along with a correction for toluene versus hexane fit the data in Figures 1–3. The forthcoming discussion fleshes out the details and concludes with thoughts on why the oxazolidinone enolization is hypersensitive to seemingly trivial changes in conditions.
Correlating Stoichiometry with Structure
Rate studies establish stoichiometries at the rate-limiting transition structures,24 and computations add insights into structure and other experimentally elusive details. The experimentally determined high per-lithium solvation numbers pushed us to invoke free-ion-based pathways: a simple free ion 13 and fully ionized triple ion 14. Triple ions,38 including LiHMDS-derived triple ions,3 are well-documented. Spectroscopic evidence also indicated an ionized LiHMDS monomer: a free ion or solvent-separated ion pair.39 Nonetheless, the +LiS8 gegenion in 14 defied computation, which may be shocking to some. In defense of the hypothesis, we first note that +Li(THF)6 is documented crystallographically.30 The high-order dependence on THF concentration is unusual by any standard, but it is not without support. We observed a seventh-order dependence for Ph2NLi alkylations in 1988 consistent with a decasolvated cation, +Li(THF)10.32 In that instance, we invoked secondary-shell effects stemming from the requisite ionization of a solvent-separated ion pair. Conductivity studies show that full ionization of the LiClO4 separated ion pair is significantly endothermic,40 presumably requiring considerable secondary-shell solvation (eq 13). The secondary shells of aprotic solvents have been discussed31,32 and are suggested to be marginally sensitive to steric effects and not particularly well-ordered but might still require orderly THF dipole alignment about the cation.
| (13) |
A marginally detectable basal reactivity in the limit of low THF concentration was attributed to 11 (Chart 1) because of an observed fractional order in LiHMDS. It posed an interesting theory–experiment conflict, however, in that computations suggested that A2S2-dimer-based transition structure 15 was viable. We also found 15 to be intuitively appealing, which is admittedly unscientific. When confronted with a large experiment–theory disagreement, we instinctively favor experiment, but not always with great confidence. Fortunately, this particular disagreement was of limited importance.
Syn versus Anti Deprotonation
The rate-limiting proton transfers in transition structures 11 and 12 represent anti deprotonation as defined in 9a; the corresponding syn counterparts are 2.5 and 5.6 kcal/mol less stable, respectively, with the exception of a slight syn preference in 13. Are these relative syn–anti selectivities important? In the current context, no, but we offer an interesting thought: if one wished to quaternize an Evans enolate at the alpha carbon with high stereocontrol,41 a requisite stereoselective enolization would depend on the facial preference for deprotonation (eq 14), which would in turn require mechanistic control. For now, however, this thought is just passing.42
 |
(14) |
Contributions to the Reaction Coordinate
It is instructive to consider the relative importance of the four mechanisms to the overall reaction coordinate. Using the parameters from the fit for the enolization of 9 in hexane (see Figure 1,
 ), we plotted the individual contributions versus THF concentration (Figure 9). The attribution of [A2S3]‡ as the root cause of the maximum in the enolization rate is evident. The apparent saturation of the rates at high THF concentration in Figure 1 is shown in Figure 9 to derive from highly solvated [AS8]‡ and [A2S8]‡ pathways. The data from Figure 1 in isolation were insufficient to detect these terms, but the upward curvature became prominent and undeniable through further suppression of the dominant [A2S3]‡ pathway (vide infra).
Figure 9.
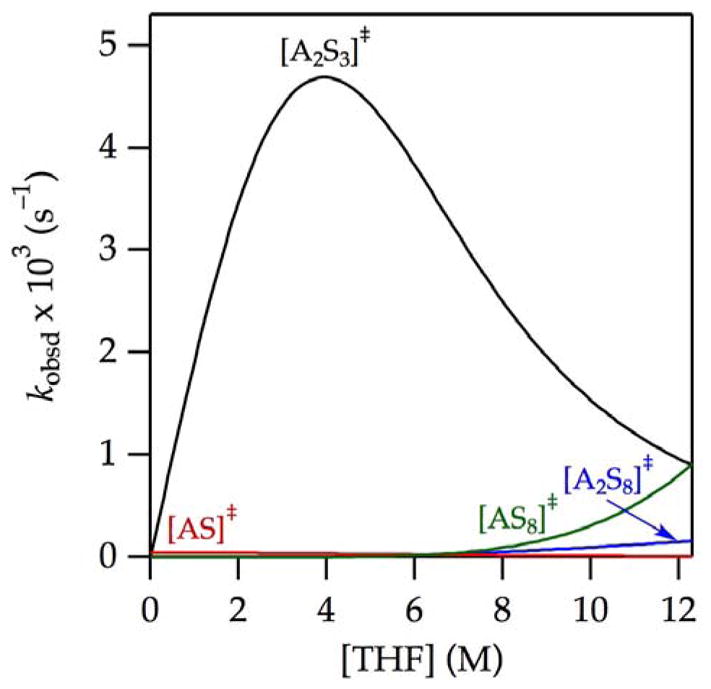
Contributions of [A2S3]‡,
 ,
,
 , and
, and
 to the enolization of 9 in THF–hexane at −78 °C depicted using the parameters from
 in Figure 1.
Role of Monomer–Dimer Aggregation
An important phenomenon was detected via the rate studies: the [A2S3]‡ and [A2S8]‡ dimer-based pathways are significant even in neat THF wherein the dimeric LiHMDS is almost nonexistent (3%; eq 1).3 The widely held notion that organolithium aggregates necessarily react via deaggregation to highly reactive monomers has given way to a more nuanced view in which aggregates react directly. The enolization described herein, however, is unusual in that observable monomers aggregate to form more highly reactive dimers. The precedent for aggregation preceding a transformation is spartan and somewhat idiosyncratic but does exist. The exchange of tetramethylethylenediamine from tetramethylethylenediamine-solvated LiHMDS monomer was shown to occur via a fleeting disolvated dimer.39 Similarly, the deaggregation of LDA dimers to monomers was shown to occur, in part, via association to form tetramers.43 Requisite aggregations preceding metalations (eq 15) are probably exceptional,44 but they remind us not to be too dogmatic.
| (15) |
Cosolvent Dependence
The influence of toluene on the individual enolization pathways can be gleaned by using the fitting parameters for the enolization of 9 in toluene (see Figure 1,
 ) to generate Figure 10. The attenuation of the maximum by toluene relative to hexane derives from the selective attenuation of the [A2S3]‡ term (cf. Figures 9 and 10). The origins of the inhibition are discussed below.
Figure 10.
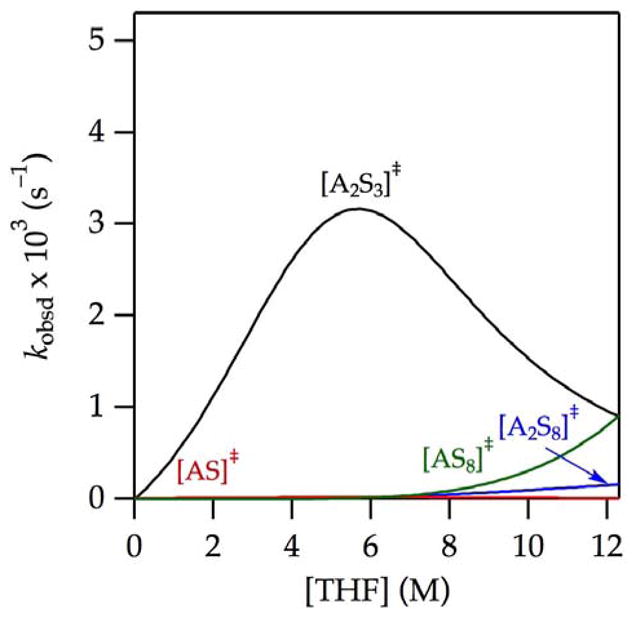
Contributions of [A2S3]‡,
 ,
,
 , and
, and
 to the enolization of 9 in THF–toluene at −78 °C determined using the parameters from
 in Figure 1.
Isotope Effects
THF-concentration-dependent isotope effects (see Figure 5) display a maximum that correlates with the maximal rates of dimer-based enolization dominated by transition structure 9 (cf. Figures 5 and 9.) Using the approach described in the previous section we found that the fitting parameters for the enolization of 9-d2 in hexane from Figure 1 (
 ) afford the contributions of [AS]‡, [A2S3]‡, [AS8]‡, and [A2S8]‡ versus THF concentration (Figure 11). The [A2S3]‡-based metalation is suppressed relative to that of [AS]‡ and [A2S8]‡. In neat THF, the reaction coordinate is dominated by the [AS8]‡ and [A2S8]‡ pathways. Deuteration and the use of toluene accentuate this trend.
Figure 11.
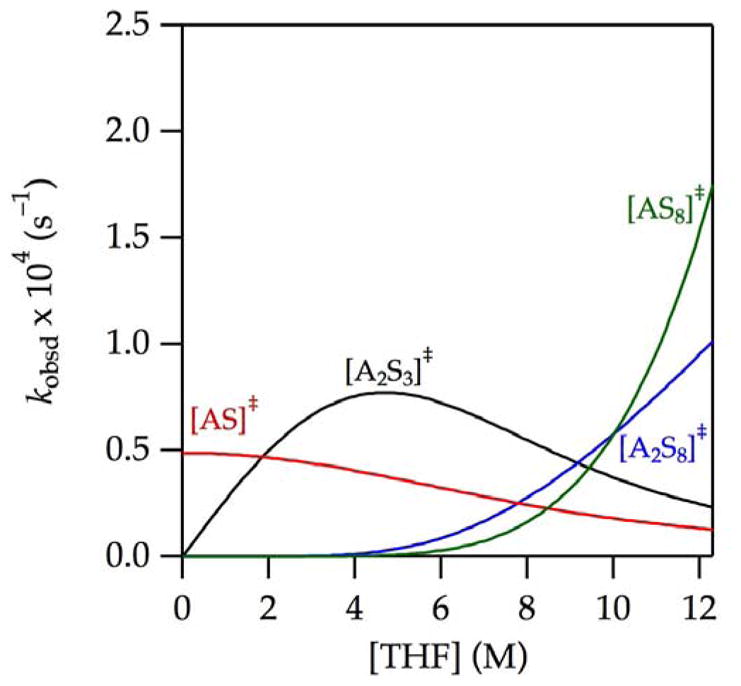
Contributions of [A2S3]‡,
 ,
,
 , and
, and
 to the enolization of 9-d2 in THF–hexane at −78 °C determined using the parameters from
 in Figure 2.
Cosolvent Effects: Ground State or Transition State?
Inhibition by toluene may be much ado about nothing. It is small when measured in kilocalories per mole, but it piques our interest. We probed the influence of cyclopentane, an aliphatic hydrocarbon analogous to hexane with solubilizing properties more akin to toluene,45a,46 and found that cyclopentane is a hexane surrogate rather than a toluene surrogate (supporting information). Such aliphatic versus aromatic cosolvent effects are common but not easily explained.45
The changes in rate that arise from swapping toluene for hexane appear to be mechanism-dependent. We must be careful in our interpretation, however, because no cosolvent effect can occur on either [AS8]‡ or [A2S8]‡ for the pedestrian reason that little or no cosolvent is present when these pathways become prominent. Also, a cosolvent effect on [AS]‡ could be obscured by difficulties in detecting this small term. Thus, the cosolvent can significantly influence rates only within a limited range. Nonetheless, toluene clearly suppresses [A2S3]‡-based enolizations and the question remains: why?
It is probably a truism—real truisms are rare—that rate suppression occurs through stabilization of the ground state or destabilization of the transition state. Beyond that, all we have are thoughts and opinions. It is easy to imagine that swapping hexane for toluene could influence the ground and transition states differently. To the extent that a direct relationship exists between the stability of a solute and solute solubility, toluene should stabilize all reactants, including LiHMDS dimer and monomer, oxazolidinone 9, and even THF (eq 16). For example, to the extent that toluene stabilizes, dissolves if you will, THF better than hexane does, the highly solvated forms should be disproportionately retarded. We argued for such a cosolvent-based stabilization of hexamethylphosphoramide as the source of rate suppression in a previous study.45b
| (16) |
In the present study, many of the models we explore that assign explicit stoichiometric roles to toluene involve the stabilization of both A2S2 and AS3 with the potential consequence of perturbing the monomer–dimer ratio. We examine the equilibrium in eq 13,4 and find that the stabilization of LiHMDS dimers and monomers is the same regardless of whether hexane or toluene is used as the cosolvent (supporting information). Thus, only a generalized ground-state stabilization offers a credible explanation of suppression. We believe, however, that there is more to the story.
Examining transition state(s), first through a classical lens, we ask: Are transition states differentially stabilized—that is, do they have different solubilities—in toluene than in hexane? The answer is almost certainly yes, which could explain mechanism-dependent cosolvent effects. However, explaining a toluene-induced rate suppression requires that the transition state(s) be more stabilized by hexane than by toluene. That result would be extremely odd. We considered models based on variable (selective) transition state sensitivities to toluene versus hexane. These models were satisfactory but too contrived, relegating them to archival status in supporting information. However, this finding segues to the next topic: tunneling.
Role of Tunneling
We26a–d and others26e,f have observed large primary isotope effects (kH/kD = 30–60) for lithiations using a variety of bases and substrates. They are definitely odd but not that unusual. Why are the isotope effects large and highly mechanism-dependent? We are loath to jump into discussions of tunneling47 out of ignorance and the sense that it may be overused to explain classical isotope effects that are simply large. That said, Carpenter and co-workers48 suggest that tunneling is pervasive. Yet again,43 we are forced to discuss tunneling.
If we may digress briefly, standard primary isotope effects are attributed to the relative stabilization of the deuterated substrate owing to the zero-point energy of the C–D stretch that disappears as the stretch becomes the reaction coordinate. kH/kD is often said to approximate 7 at ambient temperature, which translates to ~20 at −78 °C.39a By this account, a primary kinetic isotope effect is an inherent property of the substrate and would be mechanism-independent. Deviations are often ascribed to the coupling of the reaction coordinate with secondary vibrations. However, effects that perturb kH/kD to levels above 30–6026 are certainly larger than normal.
If, however, one invokes quantum mechanical tunneling, the zero-point energy in the ground state and the isotopic sensitivity to tunneling disfavoring deuterium transfer at the transition state47 work in concert to cause large isotope effects (Figure 12). Moreover, a putative hypersensitivity of tunneling to barrier width—magnitude of atomic movement involved in crossing the barrier—would naturally be highly mechanism-dependent.
Figure 12.
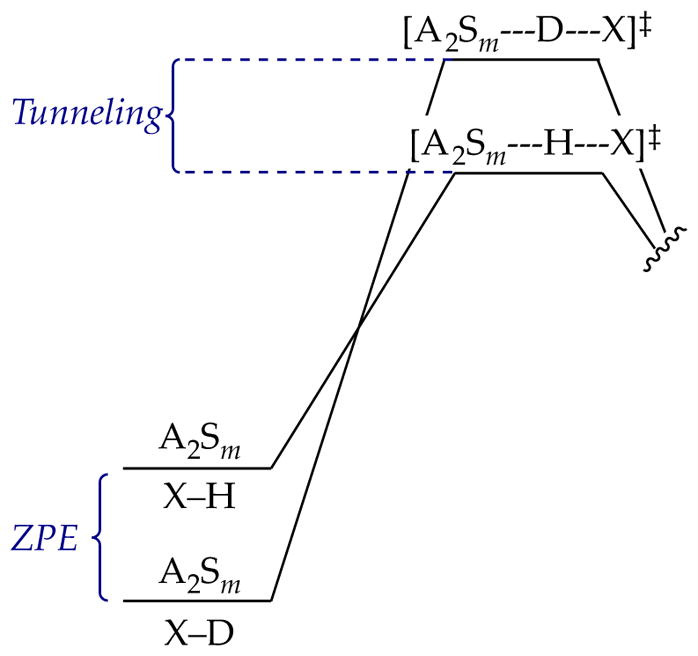
Free-energy diagram illustrating the contributions of zero-point energy (ZPE) and tunneling to an observed isotope effect.
Through tunneling, the hydrocarbon cosolvent effects and large isotope effects may dovetail. Solvent effects on tunneling have been discussed.49 Even secondary-shell effects could influence barrier widths. With that notion in mind, we performed a whimsical experiment to measure the solvent isotope effect50 with toluene and toluene-d8 and found that kH/kD was 1.15 ± 0.04. We cannot say whether this value is substantial (it seems large to us) or is even true given the potential for error (although it replicates). We also cannot say why toluene-d8 would widen a barrier for proton transfer; we are simply making a content-free supposition of differential vibrational coupling to the reaction coordinate. Our enthusiasm for such a supposition is muted by additional experiments.
2-Methylcyclohexanone: Revisited
At the outset, we used the enolization of 2-methylcyclohexanone in eq 2 to illustrate “a seemingly straightforward” enolization. We now confess to a deception, albeit with foreshadowing. In our 2004 study, enolizations in THF–toluene showed a THF concentration dependence approximating first order with a gentle downward curvature. In the context of a shifting ground state, the curvature could have been dismissed. To our retrospective surprise, however, we had noted the following:
“However, neither the first-order [THF] dependence nor the substantially incomplete saturation behavior are fully consistent with formation of predominantly trisolvated monomers. … We believe the relatively simple THF dependence belies a greater underlying complexity.”
Apparently, the absence of a maximum troubled us. We have now replicated the THF–toluene data (Figure 13,
 ) and added the analogous THF–hexane data (
 ). There is the missing maximum! Are the enolizations of 3 and oxazolidinone 9 totally analogous? In a word, no. Spot-checking the LiHMDS orders shows exclusively monomer-based enolization across the range of THF concentrations (supporting information). The functions in Figure 13 are fit to a mechanism involving [AS2]‡ and the toluene suppression function described above. Of course, the mechanism could be more complex, and the fit has structural flaws that we are currently unwilling to pursue.51 Nonetheless, the hydrocarbon effect is observed in the absence of detectable dimer mechanisms. Could there still be a correlation of hydrocarbon effects with isotopically sensitive tunneling? The reported isotope effect in THF–toluene at −78 °C was small (kH/kD = 11), but we could not reconstruct the precise conditions under which it was measured. Accordingly, we re-evaluated the isotope effect by comparing 3 and 2,6,6-3-d3 over a range of THF–hexane concentrations and observed a kH/kD value of 9–12. Thus, the evidence suggests that the toluene effect is most likely a ground-state stabilization uncorrelated with large isotope effects.
Figure 13.
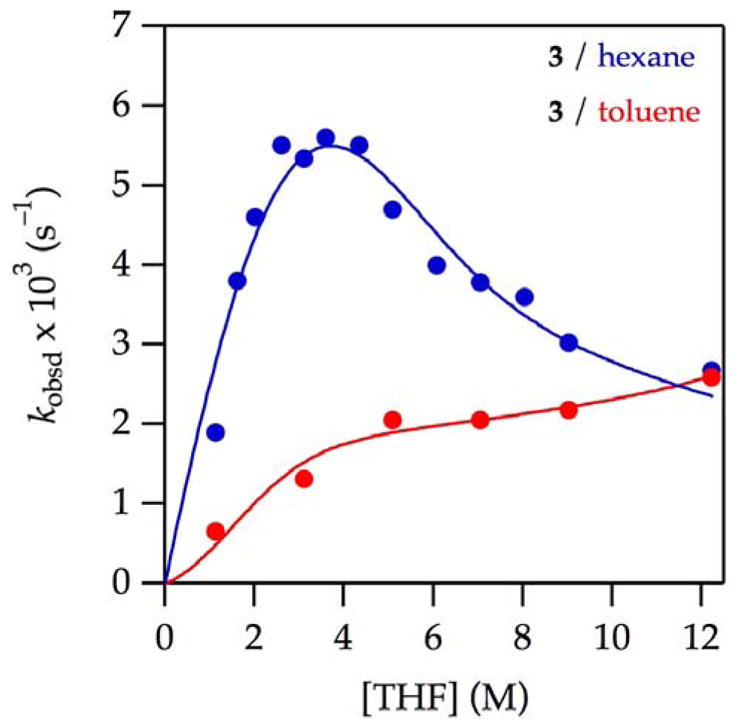
Plot of kobsd vs THF concentration for the enolization of 0.0050 M 2-methylcyclohexanone 3 with 0.10 M LiHMDS with THF in hexane (
 ) and toluene (
 ) at −78 °C.
Conclusions
The study described herein, which shows that enolizations of an oxazolidinone by LiHMDS proceed via multiple mechanisms with widely varying solvent, cosolvent, and isotopic sensitivities, has a number of disparate implications. The reaggregation of LiHMDS dimer to form highly reactive dimers has little precedent but is of interest to those debating the influence of aggregation on reactivity. From the vantage point of a structural and mechanistic organolithium chemist, the mechanistic complexity is on the high end but not unprecedented. Rate studies of LDA-mediated metalations have shown that medium effects are usually unimportant; changing THF–hexane proportions over a broad range reveals little or no contributions from the change in polarity.19 The differences observed with aromatic and aliphatic cosolvents are therefore surprising. However, we and others have noted these differences,44 which are not well-understood.52 The large kinetic isotope effects that implicate tunneling are not that rare in strong-base-mediated lithiations,26 but these lack scrutiny as well.
Our results also underscore some general principles of complex mechanistic studies. The mechanism-dependent isotope effects, in conjunction with hydrocarbon cosolvent effects, proved critical to deconvoluting the complex reaction coordinate. Espenson53 reminds us that only through complex dependencies can one glean complex mechanisms.
The roles played by synergies cannot be overstated. Traditional kinetic methods based on initial rates and flooding techniques and numerical methods are tremendously powerful when used in concert. The numerical methods cannot be applied robotically, however. They require a combination of patience, judgment, and a moral compass: the desire to get it right, not just get a fit. We sense this final element is often overlooked. Lastly, kinetics methods guide and constrain the computations while the computations provide details that are experimentally elusive and often unexpected. The combination is greater than the sum of its parts.
From a more synthetic organic perspective, this study was inspired by a plant-scale oxazolidinone enolization–alkylation sequence used by Pfizer that proved challenging during scale-up.12 Ongoing studies should help us understand whether the mechanistic complexity of enolization contributes to the idiosyncrasies that include LiHMDS batch and source dependencies. The sensitivity of the oxazolidinone enolization to hydrocarbons also reminds us that the choice of cosolvent matters even in reactions involving much more polar solvents. In a pharmaceutical setting in which percent yield, trace impurities, and processing subtleties are overriding economic parameters, the choice of hydrocarbon cosolvent—often toluene versus heptane—may be acutely important.
Experimental
Reagents and Solvents
THF, toluene, and hexane were distilled from blue or purple solutions containing sodium benzophenone ketyl. LiHMDS was prepared as a ligand- and LiCl-free recrystallized solid.15 Air- and moisture-sensitive materials were manipulated under argon using standard glovebox, vacuum line, and syringe techniques. Oxazolidinone 9 is commercially available, and 9-d2 was prepared from 2,2-dideuterio-propionyl chloride following a literature protocol.54
(S)-(+)-4-benzyl-3-propionyl-2-oxazolidinone-2,2-d2 (9-d2)
Propionic acid-2,2-d2 (4.90 mL, 65.7 mmol, 98% D) was added to a flame-dried 100 mL two-neck round-bottom flask and dissolved with 50 mL of dry THF. The solution was stirred and cooled to 0 °C under an argon atmosphere, and sodium hydride (1.89 g, 78.8 mmol, 1.2 equiv) was added slowly by placing a powder funnel in an open neck and carefully pouring the powder into the reaction via the funnel. Caution! Reduce the positive flow of inert gas out of the flask and add the solid slowly in small portions. The funnel was replaced with a stopper, and the reaction mixture was allowed to stir for an additional 15 min. The THF was removed in vacuo, yielding sodium propionate-2,2-d2 as a white solid. The salt was dried in vacuo (87%) and used immediately in the next step.
A flame-dried 50 mL one-neck round-bottom flask charged with 5.63 g (57.4 mmol) of sodium propionate-2,2-d2 and 16.5 mL (114.8 mmol, 2 equiv) of phthaloyl chloride was connected through a short-path glass apparatus to a two-neck receiving flask cooled in a dry ice-acetone bath prepared with fresh acetone. The reaction mixture was maintained at 150 °C with vigorous magnetic stirring, and propionyl chloride-2,2-d2 was allowed to distill into the receiving flask as it formed (74%). The product was used immediately in the next step.
A flame-dried 250 mL one-neck round-bottom flask was charged with (S)-(−)-4-benzyl-2-oxazolidinone (5.96 g, 33.6 mmol) and 40 mL of dry THF under an argon atmosphere. The mixture was stirred and cooled to −78 °C using a dry ice-acetone bath prepared with fresh acetone. n-Butyllithium (1.6 M solution in hexanes, 25.2 mL, 40.3 mmol, 1.2 equiv) was added dropwise, and the reaction mixture was stirred for 15 min to yield a bright orange solution. Propionyl chloride-2,2-d2 (3.0 mL, 33.6 mmol) was dissolved in 10 mL of dry THF and added dropwise to the reaction mixture. After 10 min, the cooling bath was removed and the reaction was allowed to warm to 0 °C over 30 min, stirred for an additional 30 min at 0 °C, and quenched with saturated aqueous NH4Cl. The THF was removed in vacuo, and the mixture was extracted with CH2Cl2.
The combined organic layer was dried over Na2SO4 and concentrated in vacuo. Flash chromatography yielded 5.58 g (71 %) of 9-d2: Rf = 0.41 in 25% ethyl acetate/hexanes; 1H NMR (500 MHz, CDCl3) δ 1.19 (s, 3H), 2.75–2.79 (dd, J = 6, 12 Hz, 1H), 3.29–3.32 (dd, J = 6, 12 Hz, 1H), 4.15–4.22 (m, 2H), 4.65–4.69 (m, 1H), 7.20–7.35 (m, 5H); 13C NMR (125.79 MHz, CDCl3) δ 8.2, 37.9, 55.1, 66.2, 127.3, 128.9, 129.4, 135.3, 153.5, 174.1. The 13C NMR spectrum matched that of unlabeled acylated oxazolidinone 9 except for the absence of the peak at δ 29.2 corresponding to the deuterium-substituted C-2. Integration of the 1H NMR spectrum indicated d2 = 100%. High-resolution mass spectrometry (DART ionization, orbitrap mass analyzer), calcd for C13H13D2NO3 [M + H]+ = 236.12558, found 236.12666. Deuterium content was evaluated from the relative intensities of m/z = 234 (H + C13H15NO3), m/z = 235 (H + C13H14DNO3), and m/z = 236 (H + C13H13D2NO3) for 9, 9-d1, and 9-d2, respectively, and corrected for the natural abundance of 13C, as measured in the protio standard (9). High-resolution mass spectrometry analysis indicated d2 = 95%.
IR Spectroscopic Analyses
IR spectra were recorded with an in situ IR spectrometer fitted with a 30-bounce, silicon-tipped probe. The spectra were acquired in 16 scans at a gain of 1 and a resolution of 4 cm−1. A representative reaction was carried out as follows: The IR probe was inserted through a nylon adapter and O-ring seal into an oven-dried, cylindrical flask fitted with a magnetic stir bar and a T-joint. The T-joint was capped with a septum for injections and a nitrogen line. After evacuation under full vacuum, heating, and flushing with nitrogen, the flask was charged with LiHMDS (84 mg, 0.50 mmol) in THF–hexane (or toluene, 4.9 mL total volume) and cooled in a dry ice–acetone bath prepared with fresh acetone. After a background spectrum was recorded, oxazolidinone 9 or 9-d2 (0.025 mmol in 0.10 mL THF or toluene) was added with stirring. For rapid reactions, IR spectra were recorded every 6 s with monitoring of the absorbance at 1783–1793 cm−1 during the course of the reaction.
NMR Spectroscopic Analyses
All NMR samples for reaction monitoring and structure elucidation were prepared using stock solutions and sealed under partial vacuum. Standard 1H, 6Li, and 13C NMR spectra were recorded at 500, 73.57, and 125.79 MHz, respectively.
Supplementary Material
Acknowledgments
We thank the National Institutes of Health (GM039764) for support and a research supplement for GJR.
Footnotes
Notes
The authors declare no competing financial interests.
Supporting Information. Spectroscopic, kinetic, and computational data, mechanistic models and derivations, and complete ref 33. This material is available free of charge via the Internet at http://pubs.acs.org.
References and Footnotes
- 1.For an incisive review of lithium amides in organic synthesis, see: Eames J. Product Subclass 6: Lithium Amides. In: Snieckus V, editor. Science of Synthesis. 8a. Thieme; New York: 2006. p. 173.Gray M, Snieckus V, Lebel H. Lithium Hexamethyldisilazide. In: Fuchs PL, editor. Handbook of Reagents for Organic Synthesis: Reagents for Silicon-Mediated Organic Synthesis. Wiley; New York: 2011. p. 356.
- 2.(a) Fraser RR, Mansour TS. J Org Chem. 1985;50:3232. [Google Scholar]; (b) Streitwieser A, Facchetti A, Xie L, Zhang X, Wu EC. J Org Chem. 2012;77:985. doi: 10.1021/jo202253q. [DOI] [PubMed] [Google Scholar]
- 3.Lucht BL, Collum DB. Acc Chem Res. 1999;32:1035. [Google Scholar]
- 4.Lucht BL, Collum DB. J Am Chem Soc. 1995;117:9863. [Google Scholar]
- 5.(a) Zhao P, Condo A, Keresztes I, Collum DB. J Am Chem Soc. 2004;126:3113. doi: 10.1021/ja030582v. [DOI] [PubMed] [Google Scholar]; (b) Godenschwager PF, Collum DB. J Am Chem Soc. 2007;129:12023. doi: 10.1021/ja074018m. [DOI] [PubMed] [Google Scholar]
- 6.For recent or particularly germane examples of crystal structures of solvated LiHMDS, see: Usher M, Protchenko AV, Rit A, Campos J, Kolychev EL, Tirfoin R, Aldridge S. Chem Eur J. 2016;22:11685. doi: 10.1002/chem.201601840.Nako AE, White AJP, Crimmin MR. Chem Sci. 2013;4:691.Li Q, Zhou S, Wang S, Zhu X, Zhang L, Feng Z, Guo L, Wang F, Wei Y. Dalton Trans. 2013;42:2861. doi: 10.1039/c2dt32513f.Williard PG, Liu QY. J Org Chem. 1994;59:1596.Power PP, Xu X. J Chem Soc, Chem Commun. 1984:358.Power PP. Acc Chem Res. 1988;21:147.Henderson KW, Dorigo AE, Liu QL, Williard PG. J Am Chem Soc. 1997;119:11855.Engelhardt LM, Jolly BS, Junk PC, Raston CL, Skelton BW, White AH. Aust J Chem. 1986;39:1337.Lappert MF, Slade MJ, Singh A, Atwood JL, Rogers RD, Shakir R. J Am Chem Soc. 1983;105:302.Mulvey RE, Robertson SD. Angew Chem, Int Ed. 2013;52:11470. doi: 10.1002/anie.201301837.
- 7.(a) Honda K, Harris TV, Hatanaka M, Morokuma K, Mikami K. Chem Eur J. 2016;22:8796. doi: 10.1002/chem.201601090. [DOI] [PubMed] [Google Scholar]; (b) Popenova S, Mawhinney RC, Schreckenbach G. Inorg Chem. 2007;46:3856. doi: 10.1021/ic061599s. [DOI] [PubMed] [Google Scholar]; (c) Pratt LM. Bull Chem Soc Jpn. 2005;78:890. [Google Scholar]; (d) Pratt LM, Streitwieser A. J Org Chem. 2003;68:3830. doi: 10.1021/jo026902v. [DOI] [PubMed] [Google Scholar]; (e) Romesberg FE, Bernstein MP, Gilchrist JH, Harrison AT, Fuller DJ, Collum DB. J Am Chem Soc. 1993;115:3475. [Google Scholar]; (f) Sapse A-M, Kaufmann E, Schleyer PvR, Gleiter R. Inorg Chem. 1984;23:1569. [Google Scholar]
- 8.For the seminal spectroscopic investigations of LiHMDS see: Kimura BY, Brown TL. J Organomet Chem. 1971;26:57.
- 9.For additional physicochemical studies of LiHMDS, see: Wannagat U. Adv Inorg Chem Radiochem. 1964;6:237.Rogers RD, Atwood JL, Grüning R. J Organomet Chem. 1978;157:229.Mootz D, Zinnius A, Böttcher B. Angew Chem, Int Ed Engl. 1969;8:378.Renaud P, Fox MA. J Am Chem Soc. 1988;110:5702.Fjeldberg T, Lappert MF, Thorne AJ. J Mol Struct. 1984;125:265.Fjeldberg T, Hitchcock PB, Lappert MF, Thorne AJ. J Chem Soc, Chem Commun. 1984:822.Engelhardt LM, May AS, Raston CL, White AHJ. Chem Soc, Dalton Trans. 1983:1671.Williard PG, Liu QY, Lochmann L. J Am Chem Soc. 1992;114:348.Lochmann L, Trekoval J. J Organomet Chem. 1975;99:329.Boche G, Langlotz I, Marsch M, Harms K, Frenking G. Angew Chem, Int Ed, Engl. 1993;32:1171.Arnett EM, Moe KD. J Am Chem Soc. 1991;113:7068.Arnett EM, Moe KD. J Am Chem Soc. 1991;113:7288.Anglehardt LM, Jolly BS, Punk P, Raston CL, Skelton BW, White AH. Aust J Chem. 1986;39:133.Arnett EM, Fisher FJ, Nichols MA, Ribeiro AA. J Am Chem Soc. 1990;112:801.Grimm DT, Bartmess JE. J Am Chem Soc. 1992;114:1227.Henderson KW, Dorigo AE, Liu Q-Y, Williard PG, Schleyer PvR, Bernstein PR. J Am Chem Soc. 1996;118:1339.
- 10.For rate studies of the alkylation of LiHMDS/lithium enolate mixed aggregates in THF, see: Kim Y-J, Streitwieser A. Org Lett. 2002;4:573. doi: 10.1021/ol017175d.
- 11.Tallmadge EH, Jermaks J, Collum DB. J Am Chem Soc. 2016;138:345. doi: 10.1021/jacs.5b10980. [DOI] [PMC free article] [PubMed] [Google Scholar]
- 12.Singer RA, Ragan JA, Bowles P, Chisowa E, Conway BG, Cordi EM, Leeman KR, Letendre LJ, Sieser JE, Sluggett GW, Stanchina CL, Strohmeyer H, Blunt J, Taylor S, Byrne C, Lynch D, Mullane S, O’Sullivan MM, Whelan M. Org Process Res Dev. 2014;18:26. [Google Scholar]
- 13.For reviews of organolithium chemistry in pharmaceutical process research, see: Farina V, Reeves JT, Senanayake CH, Song JJ. Chem Rev. 2006;106:2734. doi: 10.1021/cr040700c.Wu G, Huang M. Chem Rev. 2006;106:2596. doi: 10.1021/cr040694k.Rathman TL, Bailey WF. Org Process Res Dev. 2009;13:144.
- 14.For selected examples in which LiHMDS is used on large scale, see: Duan S, Place D, Perfect HH, Ide ND, Maloney M, Sutherland K, Price-Wiglesworth KE, Wang K, Olivier M, Kong F, Leeman K, Blunt J, Draper J, McAuliffe M, O’Sullivan M, Lynch D. Org Process Res Dev. 2016;20:1191.Knight J, Guizzetti S, Zhao W, Schwindeman JA, Zhao D. Org Process Res Dev. 2015;19:1392.Pan X, Xu S, Huang R, Yu W, Liu F. Org Process Res Dev. 2015;19:611.Peng Z, Ragan JA, Colon-Cruz R, Conway BG, Cordi EM, Leeman K, Letendre LJ, Ping LJ, Sieser JE, Singer RA, Sluggett GW, Strohmeyer H, Vanderplas BC, Blunt J, Mawby N, Meldrum K, Taylor S. Org Process Res Dev. 2014;18:36.Rathman T, Schwindeman JA. Org Process Res Dev. 2014;18:1192.
- 15.For a dissolving metal-based preparation of LiCl-free LiHMDS, see: Tomasevich LL, Collum DB. J Am Chem Soc. 2014;136:9710. doi: 10.1021/ja504365z.
- 16.(a) Rein AJ, Donahue SM, Pavlosky MA. Curr Opin Drug Discovery Dev. 2000;3:734. [PubMed] [Google Scholar]; (b) Eisenbeis SA, Chen R, Kang M, Barrila M, Buzon R. Org Process Res Dev. 2015;19:244. and references cited therein. [Google Scholar]
- 17.The absorbance of 9 is solvent dependent in the absence of lithium salts: (a) 1783 cm−1 in neat THF ; (b) 1787 cm−1 in THF–toluene mixtures; (c) 1793 cm−1 in THF–hexane or THF–cyclopentane mixtures. For detailed analysis of solvent-dependent IR absorbances, see: Reimers JR, Hall LE. J Am Chem Soc. 1999;121:3730.
- 18.Rate measurements at < 0.5 M THF–hexane were complicated by overlapping absorbances of partial substrate-LiHMDS complexation and by poor solubilities. Moreover, solutions containing LiHMDS (0.10 M), and 9-d2 (0.005 M) in neat toluene at −78 °C show absorbances corresponding to a LiHMDS-bound oxazolidinone (1767 and 1680 cm−1) to the exclusion of free oxazolidinone. Serial addition of THF shows full decomplexation at [THF] ≥ 0.15 M (1.5 equiv/LiHMDS).
- 19.For a treatise on rate studies of lithium amides, see: Collum DB, McNeil AJ, Ramírez A. Angew Chem, Int Ed. 2007;46:3002. doi: 10.1002/anie.200603038.For detailed review and leading references to the structures and reactivities in organolithium chemistry, see: Reich HJ. Chem Rev. 2013;113:7130. doi: 10.1021/cr400187u.
- 20.Enolization at < 1.0 M THF–cyclopentane showed minor deviations from first-order decays that could be construed as evidence of basal-level autocatalysis. No evidence of mixed aggregation was observed.
- 21.Casado J, Lopez-Quintela MA, Lorenzo-Barral FM. J Chem Educ. 1986;63:450. [Google Scholar]
- 22.LiHMDS concentration refers to the concentration of the monomer subunit (normality)
- 23.Previous studies3a suggest that AS4 also coexists with AS3 in neat THF at −78 °C. Although it quantitatively adds perturbations in the modelling, it in no way undermines comparisons of any of the models.
- 24.The rate law provides the stoichiometry of the transition structure relative to that of the reactants: Edwards JO, Greene EF, Ross J. J Chem Educ. 1968;45:381.
- 25.THF concentrations are corrected to be just the free (uncoordinated) THF concentration. At high concentrations wherein the correction would become slightly more complex, it also becomes miniscule.
- 26.(a) Ma Y, Breslin S, Keresztes I, Lobkovsky E, Collum DB. J Org Chem. 2008;73:9610. doi: 10.1021/jo801410s. [DOI] [PMC free article] [PubMed] [Google Scholar]; (b) Hoepker AC, Gupta L, Ma Y, Faggin MF, Collum DB. J Am Chem Soc. 2011;133:7135. doi: 10.1021/ja200906z. [DOI] [PMC free article] [PubMed] [Google Scholar]; (c) Singh KJ, Collum DB. J Am Chem Soc. 2006;128:13753. doi: 10.1021/ja064655x. [DOI] [PubMed] [Google Scholar]; (d) Rennels RA, Rutherford JL, Collum DB. J Am Chem Soc. 2000;122:8640. [Google Scholar]; (e) Anderson DR, Faibish NC, Beak P. J Am Chem Soc. 1999;121:7553. [Google Scholar]; (f) Meyers AI, Mihelich ED. J Org Chem. 1975;40:3158. [Google Scholar]
- 27.Isotope effects for LiHMDS-mediated ketone enolizations: Held G, Xie LF. Microchem J. 1997;55:261.Xie LF, Saunders WH. J Am Chem Soc. 1991;113:3123.
- 28.Rate measurements above 0.25 M of LiHMDS in 1.0 M THF–hexane at −78 °C were precluded by poor solubilities, unlike 1.0 M THF–toluene where rates were determined up to 0.40 M LiHMDS.
- 29.(a) Occam’s razor constrains you to employing the simplest mechanism to explain the observables. The often-stated variant that claiming “the simplest model is most likely correct” is an incorrect statement of Occam’s intent and, in our opinions, foolish in almost all settings Adams MM, editor. William Ockham. Univ. of Notre Dame Press; Notre Dame: 1987. Plurality should not be assumed without necessity; p. 156.See also: Hoffman R, Minkin VI, Carpenter BK. HYLE: Int J Philos Chem. 1997;3:3.
- 30.+Li(THF)6: Schenk C, Schnepf A. Angew Chem, Int Ed Engl. 2007;46:5314. doi: 10.1002/anie.200700530.+Li(THF)6: Schenk C, Henke F, Santiso-Quinones G, Krossing I, Schnepf A. Dalton Trans. 2008:4436. doi: 10.1039/b717506j.
- 31.Ohtaki H, Radnai T. Chem Rev. 1993;93:1157.Chang S, Severson MW, Schmidt PP. J Phys Chem. 1985;89:2892.Worsfold DJ, Bywater S. Can J Chem. 1964;42:2884.Roovers JEL, Bywater S. Macromolecules. 1968;1:328.Bywater S, Worsfeld DJ. J Organometal Chem. 1967;10:1.(f) Also, see reference 45.
- 32.Depue JS, Collum DB. J Am Chem Soc. 1988;110:5524. [Google Scholar]
- 33.Frisch MJ, et al. GaussianVersion 3.09; revision A.1. Gaussian, Inc; Wallingford, CT: 2009. [Google Scholar]
- 34.From Wikipedia, an isodesmic reaction is a chemical reaction in which the type of chemical bonds broken in the reactant are the same as the type of bonds formed in the reaction product.
- 35.Cohen AJ, Mori-Sánchez P, Yang W. Science. 2008;321:792. doi: 10.1126/science.1158722. [DOI] [PubMed] [Google Scholar]
- 36.The computations use the Gaussian standard state of 10 atmIf the THF concentration is corrected to neat THF (approximately 13 M) each solvation step benefits from approximately 20 kcal/mol of additional stabilization at −78 °C (195 K) Pratt LM, Merry S, Nguyen SC, Quan P, Thanh BT. Tetrahedron. 2006;62:10821.
- 37.Even if monomers were the most reactive form, driving an equilibrium to the preferred aggregation state but at the wrong solvation state will inhibit a reaction.
- 38.For some recent reports of triple ions, see: Kolonko KJ, Biddle MM, Guzei IA, Reich HJ. J Am Chem Soc. 2009;131:11525. doi: 10.1021/ja903479p.Jones AC, Sanders AW, Sikorski WH, Jansen KL, Reich HJ. J Am Chem Soc. 2008;130:6060. doi: 10.1021/ja8003528.Dewan R, Datta B, Roy MC, Roy MN. Fluid Phase Equil. 2013;358:233.
- 39.Lucht BL, Bernstein MP, Remenar JF, Collum DB. J Am Chem Soc. 1996;118:10707. [Google Scholar]
- 40.Physicochemical studies of LiClO4 in THF, substituted THF’s, and THF/benzene mixtures: Badiali JP, Cachet H, Cyrot A, Lestrade JC. J Chem Soc, Farad Trans. 1973;69:1339.Cachet H, Cyrot A, Fekir M, Lestrade JC. J Phys Chem. 1979;83:2419.Ashby EC, Dobbs FR, Hopkins HP., Jr J Am Chem Soc. 1973;95:2823.Matsuda Y, Morita M, Tachihara F. Bull Chem Soc Japan. 1986;59:1967.Delsignore M, Maaser HE, Petrucci S. J Phys Chem. 1984;88:2405.Tobishima S, Yamaji A. Electrochim Acta. 1983;28:1067.Bhattacharyya DN, Lee CL, Smid J, Szwarc M. J Phys Chem. 1965;69:608.Wong MK, Popov AI. J Inorg Nucl Chem. 1972;34:3615.
- 41.(a) Peddie V, Pietsch M, Bromfield KM, Pike RN, Duggan PJ, Abell AD. Synthesis. 2010;11:1845. [Google Scholar]; (b) Falck JR, Gao S, Prasad RN, Koduru SR. Bioorg Med Chem Lett. 2008;18:1768. doi: 10.1016/j.bmcl.2008.02.034. [DOI] [PMC free article] [PubMed] [Google Scholar]; (c) Schmidt B, Wildermann H. J Chem Soc Perkin Trans. 2002;1:1050. [Google Scholar]; (d) Murata Y, Kamino T, Hosokawa S, Kobayashi S. Tetrahedron Lett. 2002;43:8121. [Google Scholar]; (e) Jacobson IC, Reddy GP. Tetrahedron Lett. 1996;37:8263. [Google Scholar]; (f) Less SL, Handa S, Millburn K, Leadlay PF, Dutton CJ, Staunton J. Tetrahedron Lett. 1996;37:3515. [Google Scholar]
- 42.Haesler J, Schindelholz I, Riguet E, Bochet CG, Hug W. Nature. 2007;446:526. doi: 10.1038/nature05653. [DOI] [PubMed] [Google Scholar]
- 43.Liang J, Hoepker AC, Algera RF, Ma Y, Collum DB. J Am Chem Soc. 2015;137:6292. doi: 10.1021/jacs.5b01668. [DOI] [PMC free article] [PubMed] [Google Scholar]
- 44.Reich suspected a requisite pre-aggregation step in the addition of aryllithiums to esters but found it difficult to document definitively: Plessel KN, Jones AC, Wherritt DJ, Maksymowicz RM, Poweleit ET, Reich HJ. Org Lett. 2015;17:2310. doi: 10.1021/acs.orglett.5b00650.
- 45.(a) Ma Y, Ramírez A, Singh KJ, Keresztes I, Collum DB. J Am Chem Soc. 2006;128:15399. doi: 10.1021/ja060964b. [DOI] [PubMed] [Google Scholar]; (b) Godenschwager PF, Collum DB. J Am Chem Soc. 2007;129:12023. doi: 10.1021/ja074018m. [DOI] [PubMed] [Google Scholar]; (c) Chadwick ST, Rennels RA, Rutherford JL, Collum DB. J Am Chem Soc. 2000;122:8640. [Google Scholar]; (d) Lucht BL, Collum DB. J Am Chem Soc. 1996;118:2217. [Google Scholar]; (e) Wu S, Lee S, Beak P. J Am Chem Soc. 1996;118:715. [Google Scholar]; (f) Hsieh HL, Quirk RP. Anionic Polymerization: Principles and Practical Applications. Marcel Dekker; New York: 1996. [Google Scholar]; g Lewis HL, Brown TLJ. Am Chem Soc. 1970;92:4664. [Google Scholar]
- 46.(a) Eliezer I, Adida S. J Phys Chem. 1973;77:87. [Google Scholar]; (b) McAuliffe C. J Phys Chem. 1966;70:1267. [Google Scholar]
- 47.(a) Kohen Amnon, Limbach Hans-Heinrich., editors. Isotope effects in chemistry and biology. CRC Press; New York: 2005. [Google Scholar]; (b) Bell RP. The Tunnel Effect in Chemistry. Chapman & Hall; New York: 1980. [Google Scholar]
- 48.Carpenter BK. Nat Chem. 2010;2:80. doi: 10.1038/nchem.531. [DOI] [PubMed] [Google Scholar]
- 49.(a) Shimada S, Ikeda Y, Sasaki M. Mem Konan Univ, Sci & Eng Ser. 2004;51:141. [Google Scholar]; (b) Wu A, Mader EA, Datta A, Hrovat DA, Borden WT, Mayer JM. J Am Chem Soc. 2009;131:11985. doi: 10.1021/ja904400d. [DOI] [PMC free article] [PubMed] [Google Scholar]; (c) Caldin EF, Mateo S. J Chem Soc, Faraday Trans 1. 1975;71:1876. [Google Scholar]; (d) Kwon OH, Lee YS, Yoo BK, Jang DJ. Angew Chem, Int Ed. 2006;45:415. doi: 10.1002/anie.200503209. [DOI] [PubMed] [Google Scholar]
- 50.(a) Zong Y, McHale JL. J Chem Phys. 1997;106:4963. [Google Scholar]; (b) Miller JR, Beitz JV, Huddleston RK. J Am Chem Soc. 1984;106:5057. [Google Scholar]
- 51.Trouble emerges here in that the Keq extracted from the fit is an order of magnitude too high relative to that observed experimentally; the maximum for [AS2]‡ should appear around 5–6 M THF according to the experimentally determined monomer-dimer ratio versus THF.
- 52.Ma JC, Dougherty DA. Chem Rev. 1997;97:1303. doi: 10.1021/cr9603744. [DOI] [PubMed] [Google Scholar]
- 53.Espenson JH. Chemical Kinetics and Reaction Mechanisms. 2. McGraw-Hill; New York: 1995. [Google Scholar]
- 54.Isotopologue 9-d2 was prepared using CH3CD2CO2H by a standard procedure: Garg A, Khosla C, Cane DE. J Am Chem Soc. 2013;135:16324. doi: 10.1021/ja408944s.Cane DE, Tan W, Ott WR. J Am Chem Soc. 1993;115:527.Cane DE, Block MH. J Am Chem Soc. 1988;53:4923.
Associated Data
This section collects any data citations, data availability statements, or supplementary materials included in this article.


