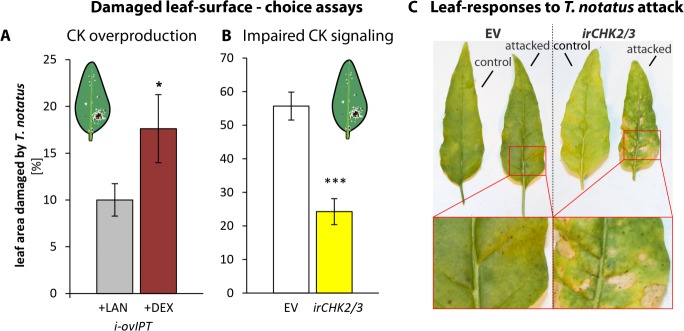
Figure 6. Cytokinin-regulated traits mediate Tupiocoris notatus feeding preferences and alter leaf responses to feeding.
(A) and (B): Surface damage on N. attenuata plants after 10 d of T. notatus feeding. (A) T. notatus could choose between dexamethasone-inducible isopentenyltransferase-overexpressing plants (i-ovipt) treated with dexamethasone-containing lanolin paste (+DEX) or lanolin paste without dexamethasone as control (+LAN; figure based on data from Schäfer et al., 2013). Statistically significant differences were identified with pairwise t-test: N = 7, p=0.032. (B) Choice between empty vector (EV) and irchk2/3 plants silenced in the two cytokinin receptor genes NaCHK2 and NaCHK3 (irchk2/3). Pairwise t-test: N = 6, p<0.001. Error bars depict standard errors. *p<0.05, ***p<0.001. (C) Representative pictures of leaves of EV or irchk2/3 plants with or without T. notatus damage. Magnifications show necrotic lesions occurring only in irchk2/3 plants after several days of mirid feeding. For raw data see Raw_data_FIGURE_6 (Dryad: Brütting et al., 2018).


