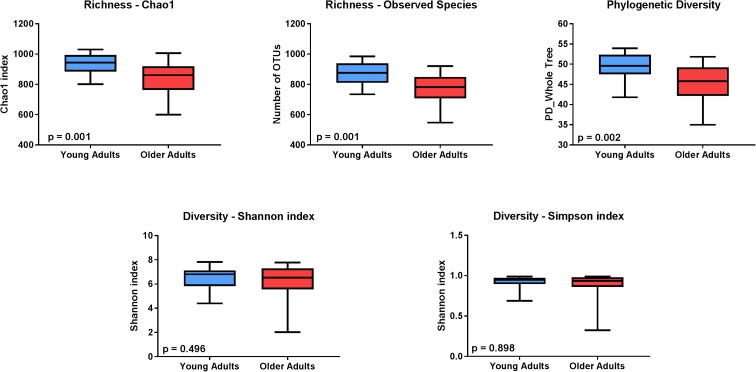
Fig. 2.
Comparison of α-diversity of the serum microbiome between healthy young (blue) and older adults (red). Five indices were used to represent the richness (chao1, observed species), phylogenetic diversity, and sample diversity (shannon and simpson indices). Box whiskers indicate the range of observed values

