

Abstract
Background
Clinical assessment of intravascular volume status is challenging. In humans, ultrasonographic assessment of the inferior vena cava diameter, directly or as a ratio to the aortic diameter is used to estimate intravascular volume status.
Objectives
To ultrasonographically obtain reference values (RV) for caudal vena cava diameter (CVCD), area (CVCa) and aortic ratios using 3 views in awake healthy dogs.
Animals
One hundred and twenty‐six healthy adult dogs from clients, students, faculty, or staff.
Methods
Prospective, multicenter, observational study. Two observer pairs evaluated CVCD by a longitudinal subxiphoid view (SV), a transverse 11th‐13th right hepatic intercostal view (HV), and a longitudinal right paralumbar view (PV). Inter‐rater agreements were estimated using concordance correlation coefficients (CCC). For body weight (BW)‐dependent variables, RVs were calculated using allometric scaling for variables with a CCC ≥ 0.7.
Results
The CCC was ≤0.43 for the CVC/aorta ratio at the PV and ≤0.43 in both inspiration and expiration for CVC at the SV. The RVs using allometric scaling for CVCa at the HV for inspiration, expiration, and for CVCD at the PV were 6.16 × BW0.762, 7.24 × BW0.787, 2.79 × BW0.390, respectively.
Conclusions and Clinical Importance
The CVCD, measured at the HV and PV in healthy awake dogs of various breeds has good inter‐rater agreement suggesting these sites are reliable in measuring CVCD. Established RVs for CVCD for these sites need further comparison to results obtained in hypovolemic and hypervolemic dogs to determine their usefulness to evaluate volume status in dogs.
Keywords: allometric scaling, caudal vena cava, FAST echography, intravascular volume status
Abbreviations
- Ao
aorta
- AoD
aorta diameter
- Aomax‐HV‐B
maximal aortic diameter at the hepatic view in B‐Mode
- Aomax‐HV‐M
maximal aortic diameter at the hepatic view in M‐Mode
- Aomin‐HV‐B
minimal aortic diameter at the hepatic view in B‐Mode
- Aomin‐HV‐M
minimal aortic diameter at the hepatic view in M‐Mode
- AoD‐PV‐B
aortic diameter at the paralumbar view in B‐Mode
- AoD‐PV‐M
aortic diameter at the paralumbar view in M‐Mode
- BW
body weight
- CCC
concordance correlation coefficient
- CVC
caudal vena cava
- CVC/Ao
caudal vena cava to aortic ratio
- CVCa
caudal vena cava area
- CVCamax‐HV‐B
maximal caudal vena cava area at the hepatic view in B‐Mode
- CVCamin‐HV‐B
minimal caudal vena cava area at the hepatic view in B‐Mode
- CVCCI
caudal vena cava collapsibility index
- CVCD
caudal vena cava diameter
- CVCD‐PV‐B
caudal vena cava diameter at the paralumbar view in B‐Mode
- CVCD‐PV‐M
caudal vena cava diameter at the paralumbar view in M‐Mode
- CVCmax
maximal caudal vena cava diameter
- CVCmax‐HV‐M
maximal caudal vena cava diameter at the hepatic view in M‐Mode
- CVCmax‐SV‐B
maximal caudal vena cava diameter at the subxiphoid view in B‐mode
- CVCmin
minimal caudal vena cava diameter
- CVCmin‐SV‐B
minimal caudal vena cava diameter at the subxiphoid view in B‐mode
- CVCmin‐HV‐M
minimal caudal vena cava diameter at the hepatic view in M‐Mode
- CVP
central venous pressure
- HV
transverse hepatic view at the 11th‐12th right intercostal space
- IVC
inferior vena cava
- IVCCI
inferior vena cava collapsibility index
- IVCD
inferior vena cava diameter
- IVCmax
maximal inferior vena cava diameter
- IVCmin
minimal inferior vena cava diameter
- PV
longitudinal right paralumbar view
- SD
standard derivation
- SV
longitudinal subxiphoid view
1. INTRODUCTION
Accurate assessment of intravascular volume status is crucial in the management of critically ill dogs.1 However, intravascular volume status cannot be accurately evaluated on a clinical examination, and readily available point‐of‐care diagnostic tests such as arterial blood pressure and blood lactate concentration lack precision in estimating volume status. Central venous pressure (CVP) measurement historically has been used as an indirect measure of intravascular volume status.2, 3 However, CVP measurement requires a central venous catheter, which is associated with a 39% complication rate including infection, thrombosis, and mechanical complications.4 Moreover, central venous catheter placement is relatively expensive and labor intensive.5, 6 Finally, the validity of CVP for the assessment of intravascular volume in humans7, 8 and in veterinary medicine9 has been questioned over the last few decades.
In human medicine, evaluation of inferior vena cava diameter (IVCD) and collapsibility index (IVCCI) as well as the ratio of IVC compared with the aortic diameter (IVC/Ao) all have been evaluated to assess intravascular volume status. Studies suggest they correlate well with dynamic variables of intravascular volume assessment10 and can predict fluid responsiveness in intensive care unit patients.11 The IVCD predicts volume status in spontaneously breathing healthy volunteers,12 in patients with severe sepsis, acute circulatory failure,13 and heart failure, in patients undergoing hemodialysis,14 and even in patients receiving positive pressure mechanical ventilation.15
In veterinary medicine, 2 studies reported a positive correlation between CVP and caudal vena cava diameter (CVCD) in anesthetized dogs receiving IV fluids and positive pressure ventilation.16, 17 Three recent studies evaluating CVC diameter, CVC collapsibility (CVCCI), and the CVC to Ao ratio (CVC/Ao) showed promise in evaluation of intravascular volume status in dogs.18, 19, 20 Another study on healthy dogs undergoing general anesthesia and mechanical ventilation21 reported that the CVCCI is a reliable predictor of fluid responsiveness.
However, to our knowledge, reference values (RV) for the CVCD and change in CVCD during the respiratory cycle in healthy spontaneously breathing dogs have not been reported.
The aim of our study was to establish RV and 95% prediction intervals for the CVC, change in CVCD with respirations, and CVC/Ao in healthy spontaneously breathing dogs of various breeds using B‐ and M‐mode ultrasonography at 3 different anatomic locations: the subxiphoid view (SV), the hepatic view (HV), and the paralumbar view (PV).
2. MATERIALS AND METHODS
2.1. Animals
One hundred and twenty‐six healthy client, student, faculty or staff‐owned adult dogs (1–8 years of age) were prospectively recruited; 67 from Liège University and 59 from the University of Calgary, Faculty of Veterinary Medicine. Dogs < 1 year of age were excluded because of variation in the CVC and Ao that occur during growth,22 and dogs > 8 years of age were excluded because of concern for a higher incidence of chronic disease (eg, cardiomyopathy, endocrinopathies) potentially influencing intravascular status in this population. All dogs were considered healthy based on normal physical examination. The study was approved by the ethical committees of both universities and signed owner consent was obtained. During the examination, efforts were made to minimize patient stress to limit panting and help ensure dogs breathed in a relaxed manner.
2.2. Ultrasound examination
Simultaneous ultrasonographic and ECG recordings were obtained using commercially available ultrasound machines (Logiq‐e R7 with ECG kit, GE healthcare, Scilvet, http://www.scilvet.fr, France) with a microconvex curvilinear (5–7 MHz) probe. A 5 MHz probe was used in larger breeds to get proper images for the subxiphoid and hepatic views. Two separate investigators performed duplicate measurements on each dog at each study location (4 investigators total). Of the 4 investigators, 1 was a resident in internal medicine, 2 were diplomates in internal medicine, and 1 was a diplomate in emergency medicine and critical care. All investigators were trained in FAST‐ultrasonography and basic echocardiography and additionally completed a 2‐hours training course provided by the diplomate in emergency medicine and critical care, consisting of obtaining all views on 20 healthy dogs for CVC and Ao identification.
2.3. Views
Three anatomic sites were assessed by all 4 investigators. Dogs were placed in left lateral recumbency on a standard examination table and ECG pads were placed on the footpads. Care was taken to avoid collapsing the CVC by excessive pressure on the ultrasound probe. Three views of the CVC were obtained as described below. The duration of time to obtain the target images at each site was recorded.
2.3.1. Subxiphoid view
The transducer was placed longitudinally under the subxiphoid process and angled cranially to visualize the diaphragm. The ultrasound probe then was fanned to the right of midline until the CVC could be identified at the point it crossed the diaphragm (Figure 1). The ultrasound probe then was slowly fanned off either side of the CVC and returned to the position where the CVC was subjectively felt to be at its widest diameter.
Figure 1.
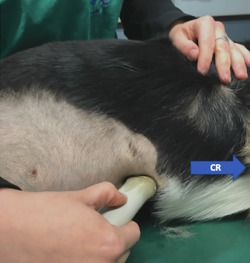
Placement of the transducer under the SV. CR, cranial direction
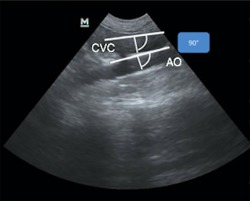
2.3.2. Hepatic view
To locate the porta hepatis, the transducer was placed parallel to the ribs (transverse to the CVC and aorta) at the 10th‐12th right intercostal space approximately just below the epaxial muscles in the upper third of the thorax (Figure 2). If aerated lung was encountered, the transducer was angled or moved caudally 1 intercostal space or the probe was placed dorsally over the epaxial muscles and slid ventrally between the ribs until the porta hepatis was visualized. In cases where the right kidney was identified, the transducer was angled or moved 1 intercostal space cranially. By doing so, a transverse image of the porta hepatis was obtained. Images were considered adequate whenever artifacts secondary to air in the lungs or gas in the gastrointestinal tract were absent and the aorta, CVC, and portal vein were visualized in a single frame (Figure 3). If the desired window could not be obtained because of gas or aerated lung, a modified view was obtained by locating the transducer between the 10th and 12th intercostal spaces, but moved caudally until the kidney adjacent to the liver was localized and the Ao and CVC were visible in the same sonographic window on cross section. The portal vein was not typically visible in this modified window.
Figure 2.
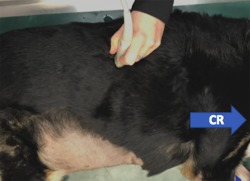
Placement of the transducer to locate the porta hepatitis (HV). CR, cranial direction
Figure 3.
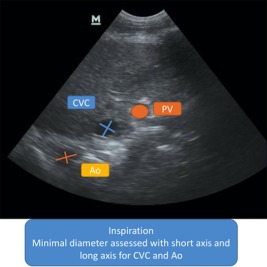
Measurement of the CVCamin‐HV‐B, Aomin‐HV‐B (HV B‐Mode). CVC, caudal vena cava; Ao, aorta; PV, portal vein
2.3.3. Paralumbar view
To obtain the PV the transducer was moved caudally under the last rib pointing in a cranial direction from behind the last rib, allowing visualization of the right kidney window (Figure 4). The probe was slowly moved or fanned medially off the right kidney until the CVC and Ao were identified. The probe was slowly rotated and fanned to obtain a longitudinal plane in which the CVC and Ao were parallel to each other within the same sonographic.
Figure 4.
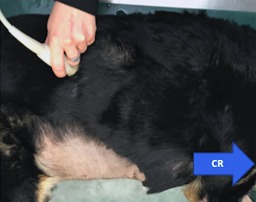
Placement of the transducer under the last rib (PV). CR, cranial direction
2.4. Measurements
At each site, cineloops (including 5 cardiac cycles, B‐mode images or both) were recorded. The M‐mode cineloops were recorded only for HV and PV. The M‐mode views at the SV site could not be obtained because of the extent of caudal dorsal displacement of the diaphragm and CVC during the respiratory cycle. Each investigator performed a single measurement for each parameter on their own cineloops and images 1 week after acquisition.
2.4.1. Subxiphoid view in B‐mode
Minimal CVCD was measured at the end of inspiration (CVCmin‐SV‐B) because the negative intrathoracic pressure during this phase of respiration displaces blood from the abdominal CVC toward the right atrium, decreasing the size of the abdominal CVC. Inversely, maximal CVCD was measured during the expiratory phase (CVCmax‐SV‐B), during which positive thoracic pressure causes blood to pool in the abdominal CVC. The CVCmin‐SV‐B and CVCmax‐SV‐B were measured by identifying the dorsal and ventral walls of the CVC (Figure 5). The cineloop was assessed for the widest and narrowest diameter of the CVC on the abdominal side of the diaphragm during expiration and inspiration, respectively. Measurements were perpendicular to the walls of the CVC. The CVCCI was calculated by using the formula (CVCmax‐SV – CVCmin‐SV)/CVCmax‐SV × 100 in B‐Mode.
Figure 5.
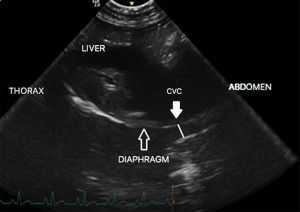
Measurement of CVCmin‐SV‐B (SV B‐Mode). Plain line CVC, caudal vena cava diameter
2.4.2. Hepatic view‐B‐mode
The short and the long axis of the CVC and Ao were measured at the narrowest diameter on inspiration (Figure 3) and maximum diameter on expiration within a single cineloop of 5 cardiac cycles. The maximal CVC area (CVCa) on expiration (CVCamax‐HV‐B) and the minimal CVCa on inspiration (CVCamin‐HV‐B) were estimated using the following mathematical formula for ellipsoid structures such as the CVC:
The diameter of the Ao was evaluated in short and long axis (Aomax‐HV‐B and Aomin‐HV‐B) on the same frames as the maximal and minimal diameter of the CVC, respectively. Reference intervals were calculated only for Aomax‐HV‐B because the mean and standard deviation (SD) of the relative differences between Aomax‐HV‐B and Aomin‐HV‐B (ie, [Aomax‐HV‐B − Aomin‐HV‐B]/Aomax‐HV‐B) indicated no difference in AoD between inspiration and expiration.
2.4.3. M‐mode
The cursor was positioned in the middle of the CVC, and the maximal CVC on expiration (CVCmax‐HV‐M) and the minimal CVC on inspiration (CVCmin‐HV‐M) were measured. The Ao was measured similarly on the same frames as the CVCmin and CVCmax (Figure 6).
Figure 6.
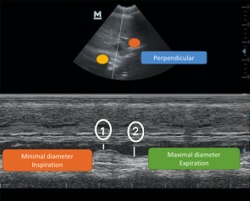
Measurement of the CVCmax‐HV‐M, CVCmin‐HV‐M (HV M‐Mode), ①CVCmin‐HV‐M, and ② CVCmax‐HV‐M
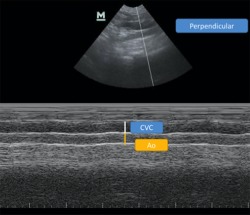
2.4.4. PV‐B‐mode
Because the diameters of the CVC and Ao do not tend to change with the respiratory cycle at this location,23 only 1 measurement of the CVCD and AoD were made at this location. The measurement at this site was made perpendicular to the wall of the CVC (CVCD‐PV‐B) and Ao (AoD‐PV‐B ; Figure 7).
Figure 7.
Measurement of CVCD‐PV‐B and AoD‐PV‐B (PV B‐Mode)
2.4.5. M‐mode
The cursor was positioned perpendicular to the walls of the vessel to allow the CVCD‐PV‐M and AoD‐PV‐M diameters to be measured (Figure 8).
Figure 8.
Measurement of CVCD‐PV‐M and AoD‐PV‐M (PV M‐Mode)
2.5. Statistics
For quantitative analysis, inter‐rater agreements were estimated by the concordance correlation coefficient (CCC).24 Reference values were calculated only when the CCC value was ≥ 0.7 (indicative of good to excellent agreement25, 26). For CVC parameters with a CCC value < 0.7, means (±SD) were provided. Normality was visually evaluated for CVCamin‐HV‐B/Ao, CVCamax‐HV‐B/Ao, CVCmin‐HV‐M, CVCmax‐HV‐M, Aomax‐HV‐M, CVCmin‐HV‐M/Ao, CVCmax‐HV‐M/Ao, CVCD‐PV‐B/AoD‐PV‐B, CVCD‐PV‐M/AoD‐PV‐M, CVCmin‐SV‐B, CVCmax‐SV‐B, and CVCCI. For time recording, medians (range) were reported.
The association between body weight (BW) and echocardiographic measurements has been reported in several studies27, 28 and is best described using allometric scaling in dogs, cats, humans and rhesus monkeys.27, 28, 29, 30 Therefore, we used allometric scaling to calculate references values for the various CVC measurements according to BW. The use of allometric scaling for echocardiographic dimensions in dogs has been described extensively.28 Briefly, this scaling relates a measurement, such as echocardiographic dimensions (or other physiological variables), to BW based on the following equation, where ED represents the echocardiographic dimension and a and b are constants: ED = a × BWb (Equation 1). After logarithmic transformation of both ED and BW, linear regression (Equation 2) provides the values of log(a) and b: Log(ED) = Log(a) + bLog(BW) (Equation 2).
For 1‐dimensional measurements (eg, echocardiographic parameters), b has a theoretical value of 1/3, and for 2‐dimensional measurements (eg, areas), b has a theoretical value of 2/3.27, 31 The adjusted R 2 is defined as the percentage of the total sum of squares that can be explained by the prediction formula, and was provided for each linear regression (Equation 2). The reference intervals of each ultrasonographic variable according to BW were obtained by the calculating the 95% prediction interval according to the following formula24, 32:
where is the estimated value of Y (here, log[ED]) for a given value of x (here, BW), t is the Student's t value for n‐2 degrees of freedom, Sx,y is the sample SD from regression (ie, the “root mean square error”), n is the number of data points in the sample, and is the calculated mean of the xi values in the sample.
As for the calculation of RV, a single dog can only be included once, and measurements obtained by a single observer from each institution were chosen arbitrarily (operators 1 and 3, respectively).
All statistics were performed using commercially available software (XLSTAT, http://www.xlstat.com, Addinsoft, Paris, France).
3. RESULTS
Median (range) time to obtain images was 90 seconds (25–270), 30 seconds (10–100), and 40 seconds (15–260) for HV, PV, and SV, respectively.
3.1. Demographic data
Demographic characteristics of the 126 dogs are shown in Table 1. The different breeds included Mixed breeds (41), Border Collies (9), Labradors (5), Golden Retrievers (4), Australian Shepherds (4), White Shepherds (4), Pit‐Bulls (3), Belgian Shepherds (3), Beagles (3), German Shepherds (3), Coonhound (3), Jack Russel Terriers (3), Blue Heelers (2), Dalmatians (2), Dobermans (2), Great Danes (2), Terriers (2), Chihuahua (2), Maltese (2), French Bulldogs (2), Whippets (2), Walker Hounds (2), Bloodhounds (2), Dachshunds (2), Welsh Corgi (1), Husky (1), Colley (1), Brittany Spaniel (1), Springer Spaniel (1), Boxer (1), Bernese Mountain dog (1), Gronendael (1), Pyrenean Mountain dog (1), Rhodesian Ridgeback (1), Cocker Spaniel (1), Lhasa Apso (1), Papillon (1), Shiba Inu (1), Sheltie (1), American Eskimo (1), and Kooikerhondje (1). In our study population, 47 deep‐chested dogs and 7 brachycephalic dogs were included. The median weight, age, and body condition score (BCS) were similar between the 2 groups, and values between the 2 locations were pooled for further statistical analysis (Table 1).
Table 1.
Demographic characteristics of healthy dogs between countries
| Country 1 (N = 67) | Country 2 (N = 59) | |
|---|---|---|
| Sex, n (%) | ||
| Neutered female | 34 (51%) | 27 (47%) |
| Neutered male | 15 (22%) | 30 (52%) |
| Intact female | 10 (15%) | 1 (0.5%) |
| Intact male | 8 (12%) | 1 (0.5%) |
| Age (years) a | 4 (1–8) | 4.5 (1–8) |
| Weight (kg) a | 20.7 (2.3–47) | 21.7 (3.4–71) |
| BCS (scale 1–9) a | 4 (2–8) | 5 (4–7) |
BCS, body condition score; n, number.
aMedian (range).
3.2. Inter‐rater agreement
The CCC was calculated for the 2 observers at each study location (Table 2). Values in bold represent the measurements with CCC ≥ 0.7.
Table 2.
Concordance correlation coefficients for each country
| Country 1 | Country 2 | |||||
|---|---|---|---|---|---|---|
| CCC | ≤0.5 | 0.5–0.7 | ≥0.7 | ≤0.5 | 0.5–0.7 | ≥0.7 |
| HV | ||||||
| CVCamin‐HV‐B | 0.71 | 0.75 | ||||
| CVCamax‐HV‐B | 0.81 | 0.79 | ||||
| Aomax‐HV‐B | 0.70 | 0.71 | ||||
| CVCamin‐HV‐B/Ao | 0.11 | 0.11 | ||||
| CVCamax‐HV‐B/Ao | 0.06 | 0.21 | ||||
| CVCmin‐HV‐M | 0.72 | 0.62 | ||||
| CVCmax‐HV‐M | 0.72 | 0.63 | ||||
| Aomax‐HV‐M | 0.63 | 0.76 | ||||
| CVCmin‐HV‐M/Ao | 0.10 | 0.21 | ||||
| CVCmax‐HV‐M/Ao | 0.18 | 0.10 | ||||
| PV | ||||||
| CVCD‐PV‐B | 0.71 | 0.85 | ||||
| AoD‐PV‐B | 0.83 | 0.88 | ||||
| CVCD‐PV‐M | 0.71 | 0.83 | ||||
| AoD‐PV‐M | 0.80 | 0.91 | ||||
| CVCD‐PV‐B/AoD‐PV‐B | 0.28 | 0.43 | ||||
| CVCD‐PV‐M/AoD‐PV‐M | 0.25 | 0.42 | ||||
| SV | ||||||
| CVCmin‐SV‐B | 0.25 | 0.42 | ||||
| CVCmax‐SV‐B | 0.46 | 0.5 | ||||
| CVCCI | 0.09 | 0.33 | ||||
In bold, CCC ≥ 0.70.
3.3. Views
For 55 dogs (43%), HV was not obtained and the modified view was used. In deep‐chested dogs, the modified view was required in 43 of 47 dogs. Data for the HV modified and standard views was pooled because the inter‐rater variability was good to excellent between observers (CCC ≥ 0.7). The RVs remained similar when evaluating results obtained from the normal or modified view separately or when evaluating results with or without a deep‐chested body conformation separately.
Means (±SD) for parameters with CCC < 0.7 were provided in Table 3. Mean (±SD) of the relative differences between Aomax‐HV‐B and Aomin‐HV‐B was 0.05 (0.1) for B‐Mode for the hepatic view. These low values indicate that Ao dimension changes only slightly with inspiration and expiration. Therefore, only the measurement of Aomax‐HV in B Mode was used for the reference intervals. The CVCD was larger in expiration than in inspiration (Tables 3 and 4).
Table 3.
Means (±SD) for parameters with CCC < 0.7
| Means | ±SD | |
|---|---|---|
| CVCamin‐HV‐B/Ao (cm) | 0.65 | 0.32 |
| CVCamax‐HV‐B/Ao (cm) | 0.81 | 0.36 |
| CVCmin‐HV‐M (cm) | 0.83 | 0.31 |
| CVCmax‐HV‐M (cm) | 0.94 | 0.31 |
| Aomax‐HV‐M (cm) | 1.1 | 0.25 |
| CVCmin‐HV‐M/Ao | 0.78 | 0.20 |
| CVCmax‐HV‐M/Ao | 0.90 | 0.21 |
| CVCD‐PV‐B/AoD‐PV‐B | 0.96 | 0.13 |
| CVCD‐PV‐M/AoD‐PV‐M | 0.94 | 0.16 |
| CVCmin‐SV‐B (cm) | 0.61 | 0.23 |
| CVCmax‐SV‐B (cm) | 0.87 | 0.27 |
| CVCCI | 0.30 | 0.12 |
Table 4.
Prediction formulas for ultrasonographic measurements as functions of BW using the allometric scaling method
| Variable | Formulas | R 2 |
|---|---|---|
| HV | ||
| CVCamin‐HV‐B (mm2) | 6.16 × BW0.762 | 0.578 |
| CVCamax‐HV‐B (mm2) | 7.24 × BW0.787 | 0.645 |
| Aomax‐HV‐B (mm) | 3.85 × BW0.323 | 0.499 |
| PV | ||
| CVCD‐PV‐B (mm) | 2.79 × BW0.390 | 0.688 |
| CVCD‐PV‐M (mm) | 2.53 × BW0.419 | 0.670 |
| AoD‐PV‐B (mm) | 3.49 × BW0.328 | 0.786 |
| AoD‐PV‐M (mm) | 3.49 × BW0.332 | 0.762 |
3.4. Reference values for echocardiographic dimensions related to BW
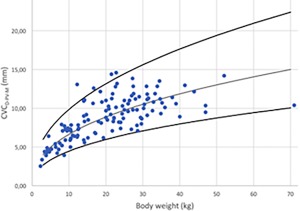
Estimations of constants a and b for predictions of echocardiographic dimensions related to BW, as well as the respective R 2 calculated from Equation 2, are presented in Table 4. Numerical values of estimated predictions with their 95% prediction intervals for a fixed BW from 3 kg to 70 kg are presented in Table 5 and Figures 9, 10, 11, 12, 13, 14, 15.
Table 5.
Predicted CVC and Ao measurements and 95% prediction intervals for 126 healthy dogs for PV and HV
| Weight (kg) | CVCamin‐HV‐B (mm2) | CVCamax‐HV‐B (mm2) | Aomax‐HV‐B (mm) | CVCD‐PV‐B (mm) | AoD‐PV‐B (mm) | CVCD‐PV‐M (mm) | AoD‐PV‐M (mm) |
|---|---|---|---|---|---|---|---|
| 3.00 | 14.23 (5.96–33.98) | 17.1 (97.88–37.48) | 5.50 (3.45–8.77) | 4.28 (3.01–6.08) | 5.01 (3.99–6.30) | 4.01 (2.71–5.94) | 5.01 (3.91–6.41) |
| 4.00 | 17.72 (7.42–42.31) | 21.55 (9.88–47.00) | 6.03 (3.78–9.63) | 4.79 (3.37–6.80) | 5.51 (4.38–6.93) | 4.52 (3.06–6.70) | 5.51 (4.30–7.06) |
| 5.00 | 21.00 (8.79–50.15) | 25.69 (11.78–56.02) | 6.49 (4.07–10.35) | 5.22 (3.68–7.42) | 5.93 (4.72–7.45) | 4.97 (3.35–7.35) | 5.93 (4.63–7.60) |
| 6.00 | 24.13 (10.11–57.63) | 29.65 (13.59–64.65) | 6.88 (4.31–10.98) | 5.61 (3.95–7.97) | 6.30 (5.01–7.91) | 5.36 (3.62–7.94) | 6.30 (4.92–8.07) |
| 7.00 | 27.14 (11.37–64.82) | 33.47 (15.35–72.99) | 7.23 (4.53–11.54) | 5.96 (4.19–8.46) | 6.62 (5.27–8.32) | 5.72 (3.86–8.47) | 6.63 (5.18–8.50) |
| 8.00 | 30.05 (12.58–71.76) | 37.17 (17.05–81.07) | 7.55 (4.73–12.05) | 6.27 (4.42–8.91) | 6.92 (5.50–8.70) | 6.05 (4.08–8.95) | 6.93 (5.41–8.88) |
| 9.00 | 32.87 (13.77–78.51) | 40.78 (18.70–88.94) | 7.84 (4.92–12.51) | 6.57 (4.63–9.33) | 7.19 (5.72–9.04) | 6.35 (4.29–9.41) | 7.21 (5.63–9.23) |
| 10.00 | 35.62 (14.92–85.07) | 44.31 (20.32–96.62) | 8.12 (5.09–12.95) | 6.84 (4.82–9.72) | 7.44 (5.92–9.36) | 6.64 (4.48–9.83) | 7.47 (5.83–9.56) |
| 11.00 | 38.31 (16.04–91.48) | 47.75 (21.90–104.14) | 8.37 (5.25–13.35) | 7.10 (5.00–10.09) | 7.68 (6.11–9.65) | 6.91 (4.67–10.23) | 7.71 (6.02–9.87) |
| 12.00 | 40.93 (17.14–97.76) | 51.14 (23.45–111.52) | 8.61 (5.40–13.73) | 7.35 (5.17–10.43) | 7.90 (6.29–9.93) | 7.17 (4.84–10.61) | 7.93 (6.19–10.16) |
| 13.00 | 43.51 (18.22–103.91) | 54.46 (24.97–118.77) | 8.83 (5.54–14.09) | 7.58 (5.34–10.77) | 8.11 (6.46–10.20) | 7.41 (5.01–10.97) | 8.14 (6.36–10.43) |
| 14.00 | 46.04 (19.28–109.94) | 57.73 (26.47–125.90) | 9.05 (5.67–14.44) | 7.80 (5.49–11.08) | 8.31 (6.61–10.45) | 7.65 (5.16–11.32) | 8.35 (6.52–10.69) |
| 15.00 | 48.52 (20.32–115.88) | 60.95 (27.95–132.92) | 9.25 (5.80–14.76) | 8.02 (5.64–11.38) | 8.50 (6.77–10.69) | 7.87 (5.31–11.65) | 8.54 (6.67–10.94) |
| 16.00 | 50.97 (21.34–121.73) | 64.12 (29.40–139.84) | 9.45 (5.92–15.07) | 8.22 (5.79–11.67) | 8.69 (6.91–10.92) | 8.08 (5.46–11.97) | 8.73 (6.81–11.17) |
| 17.00 | 53.38 (22.35–127.48) | 67.25 (30.84–146.67) | 9.64 (6.04–15.37) | 8.42 (5.93–11.95) | 8.86 (7.05–11.14) | 8.29 (5.60–12.28) | 8.90 (6.95–11.40) |
| 18.00 | 55.76 (23.35–133.16) | 70.34 (32.26–153.41) | 9.81 (6.15–15.66) | 8.61 (6.06–12.22) | 9.03 (7.18–11.35) | 8.49 (5.74–12.58) | 9.07 (7.08–11.62) |
| 19.00 | 58.11 (24.33–138.76) | 73.40 (33.66–160.07) | 9.99 (6.26–15.94) | 8.79 (6.19–12.48) | 9.19 (7.31–11.55) | 8.69 (5.87–12.86) | 9.24 (7.21–11.83) |
| 20.00 | 60.42 (25.30–144.30) | 76.42 (35.04–166.66) | 10.16 (6.37–16.20) | 8.97 (6.31–12.73) | 9.34 (7.44–11.74) | 8.88 (6.00–13.14) | 9.40 (7.34–12.03) |
| 22.00 | 64.98 (27.21–155.17) | 82.37 (37.77–179.64) | 10.47 (6.56–16.71) | 9.31 (6.55–13.21) | 9.64 (7.67–12.12) | 9.24 (6.24–13.68) | 9.70 (7.57–12.42) |
| 24.00 | 69.43 (29.07–165.81) | 88.21 (40.45–192.36) | 10.77 (6.75–17.19) | 9.63 (6.78–13.67) | 9.92 (7.89–12.47) | 9.58 (6.47–14.19) | 9.98 (7.79–12.78) |
| 26.00 | 73.80 (30.90–176.25) | 93.94 (43.07–204.86) | 11.05 (6.93–17.64) | 9.93 (6.99–14.10) | 10.18 (8.10–12.80) | 9.91 (6.69–14.67) | 10.25 (8.00–13.13) |
| 28.00 | 78.09 (32.70–186.49) | 99.57 (45.66–217.16) | 11.32 (7.10–18.06) | 10.22 (7.20–14.52) | 10.44 (8.30–13.12) | 10.22 (6.90–15.13) | 10.50 (8.20–13.45) |
| 30.00 | 82.31 (34.46–196.56) | 105.13 (48.20–229.27) | 11.58 (7.26–18.47) | 10.50 (7.39–14.91) | 10.67 (8.49–13.42) | 10.52 (7.10–15.58) | 10.75 (8.39–13.77) |
| 32.00 | 86.46 (36.20–206.47) | 110.60 (50.71–241.20) | 11.82 (7.41–18.86) | 10.77 (7.58–15.29) | 10.90 (8.67–13.70) | 10.81 (7.30–16.00) | 10.98 (8.57–14.06) |
| 34.00 | 90.55 (37.92–216.24) | 116.00 (53.19–252.98) | 12.06 (7.56–19.24) | 11.03 (7.76–15.66) | 11.12 (8.85–13.98) | 11.09 (7.49–16.41) | 11.20 (8.75–14.35) |
| 36.00 | 94.58 (39.60–225.87) | 121.34 (55.64–264.62) | 12.28 (7.70–19.59) | 11.27 (7.94–16.01) | 11.33 (9.02–14.24) | 11.35 (7.67–16.81) | 11.42 (8.91–14.62) |
| 38.00 | 98.56 (41.27–235.37) | 126.61 (58.05–276.11) | 12.50 (7.83–19.94) | 11.51 (8.11–16.35) | 11.54 (9.18–14.50) | 11.61 (7.84–17.20) | 11.62 (9.08–14.89) |
| 40.00 | 102.49 (42.92–244.76) | 131.82 (60.44–287.48) | 12.71 (7.96–20.27) | 11.75 (8.27–16.68) | 11.73 (9.33–14.74) | 11.87 (8.01–17.57) | 11.82 (9.23–15.14) |
| 45.00 | 112.12 (46.95–267.75) | 144.62 (66.31–315.38) | 13.20 (8.27–21.06) | 12.30 (8.66–17.46) | 12.19 (9.70–15.32) | 12.47 (8.42–18.46) | 12.29 (9.60–15.75) |
| 50.00 | 121.49 (50.87–290.14) | 157.11 (72.04–342.63) | 13.66 (8.56–21.79) | 12.81 (9.02–18.20) | 12.62 (10.04–15.86) | 13.03 (8.80–19.29) | 12.73 (9.94–16.31) |
| 55.00 | 130.65 (54.71–312.01) | 169.34 (77.65–369.30) | 14.09 (8.83–22.47) | 13.30 (9.36–18.88) | 13.02 (10.36–16.37) | 13.56 (9.16–20.08) | 13.14 (10.26–16.83) |
| 60.00 | 139.61 (58.46–333.40) | 181.33 (83.15–395.46) | 14.49 (9.08–23.11) | 13.76 (9.69–19.54) | 13.40 (10.66–16.84) | 14.06 (9.50–20.82) | 13.53 (10.56–17.32) |
| 65.00 | 148.39 (62.14–354.38) | 193.12 (88.55–421.16) | 14.87 (9.32–23.72) | 14.19 (9.99–20.15) | 13.76 (10.95–17.29) | 14.54 (9.82–21.53) | 13.89 (10.84–17.79) |
| 70.00 | 157.02 (65.75–374.98) | 204.71 (93.87–446.44) | 15.23 (9.55–24.30) | 14.61 (10.29–20.74) | 14.09 (11.21–17.72) | 15.00 (10.13–22.21) | 14.24 (11.11–18.23) |
Figure 9.
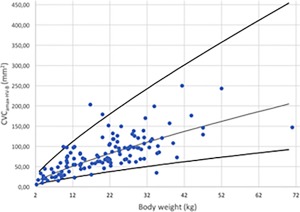
Maximal CVC area in B‐Mode for hepatic view (CVCamax‐HV‐B) versus BW after logarithmic transformation for the 126 dogs (dots). The regression line and the 95% prediction interval are shown in plain lines
Figure 10.
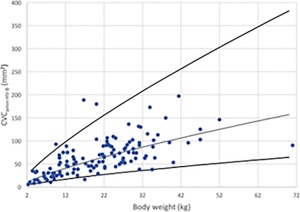
Minimal CVC area in B‐Mode for hepatic view (CVCamin‐HV‐B) versus BW after logarithmic transformation for the 126 dogs (dots). The regression line and the 95% prediction interval are shown for this variable in plain lines
Figure 11.
Maximal Ao in B‐Mode for hepatic view (Aomax‐HV‐B) versus BW after logarithmic transformation for the 126 dogs (dots). The regression line and the 95% prediction interval are shown for this variable in plain lines
Figure 12.
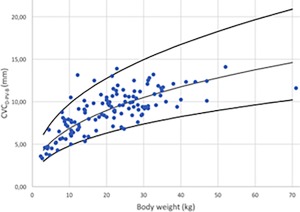
CVC diameter in B‐Mode for PV (CVCD‐PV‐B) versus BW after logarithmic transformation for the 126 dogs (dots). The regression line and the 95% prediction interval are shown for this variable in plain lines
Figure 13.
CVC diameter in M‐Mode for PV (CVCD‐PV‐M) versus BW after logarithmic transformation for the 126 dogs (dots). The regression line and the 95% prediction interval are shown for this variable in plain lines
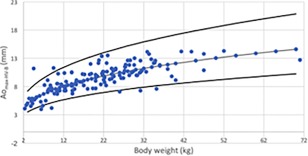
Figure 14.
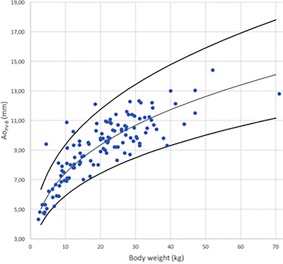
Maximal Ao in B‐Mode for PV (AoD‐PV‐B) versus BW after logarithmic transformation for the 126 dogs (dots). The regression line and the 95% prediction interval are shown for this variable in plain lines
Figure 15.
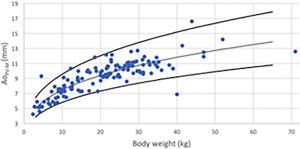
Maximal Ao in M‐Mode for PV (AoD‐PV‐M) versus BW after logarithmic transformation for the 126 dogs (dots). The regression line and the 95% prediction interval are shown for this variable in plain lines
4. DISCUSSION
Ours is the first study to describe RV of sonographically measured CVC values at 3 different anatomic locations in spontaneously breathing healthy dogs. Reference values for variables related to BW (ie, CVCamin‐HV‐B, CVCamax‐HV‐B, Aomax‐HV‐B, CVCD‐PV‐B, CVCD‐PV‐M, AoD‐PV‐B) were provided for dogs ranging in weight from 3 to 70 kg. Means (±SD) were determined for CVCamin‐HV‐B/Ao, CVCamax‐HV‐B/Ao, CVCmin‐HV‐M, CVCmax‐HV‐M, Aomax‐HV‐M, CVCmin‐HV‐M/Ao, CVCmax‐HV‐M/Ao, CVCD‐PV‐B/AoD‐PV‐B, CVCD‐PV‐M/Ao‐PV‐M, CVCmin‐SV‐B, CVCmax‐SV‐B, and CVCCI.
The HV site was first described for assessment of the porta hepatis in a transverse sonographic plane with the Ao at the left, the CVC at the middle, and portal vein at the right of the image.17 In our study, in non‐fasted spontaneously breathing healthy animals, it was not possible to visualize the porta hepatis in up to 43% of the dogs with the non‐modified view. The porta hepatis was particularly challenging to identify in deep‐chested dogs, those with intestinal gas located in the right upper abdominal quadrant, and in tachypneic dogs. The RVs did not change when evaluating deep‐chested dogs or the modified view separately, and therefore deep‐chested body conformation and the need for the modified view do not seem to hamper the use of the HV. Unfortunately, we only included 7 brachycephalic dogs and therefore cannot comment on the effect of brachycephalic body conformation on the results of this procedure. Similarly, in humans, it is reported that intra‐abdominal bowel gas negatively impacts the acquisition of IVC images.33 For dogs in which the porta hepatis was not visible, a modified view was used to allow 3 vessels to be visualized in the same plane as the right kidney. It is uncertain if and how the modified view may influence the measurements obtained at the HV site, because the standard porta hepatis view and modified view were never measured in the same dog, but the results remained very similar between groups. Given that the CVC at the HV is elliptical in shape, the area of the CVC was reported. The angulation of the probe during the HV positioning may have influenced the area of the vessel and may account for some of the variation noted between investigators.
Using allometric scaling, the predicted value of CVCD‐PV‐B for a 20‐kg dog at the PV site would be 0.89 cm, which is similar to the estimated mean CVCD of a 20 kg American Foxhound (0.96 cm) calculated in a previous study.16 Allometric scaling was used for parameters related to BW (CVCamin‐HV‐B, CVCamax‐HV‐B, Aomax‐HV‐B, CVCD‐PV‐B, CVCD‐PV‐M, and AoD‐PV‐B) with 95% prediction intervals for dogs ranging in weight from 3 to 70 kg. This approach was used to better reflect the clinical setting where BW is commonly and more easily obtained in the emergency setting. The estimated values of the constant b in Equation 1 were close to the theoretical value of 1/3 for our 1‐dimensional measurements (ie, Aomax‐HV‐B, CVCD‐PV‐B, CVCD‐PV‐M, AoD‐PV‐B; Table 4), which indicates that the use of allometric scaling seems relevant to predict these CVC and Ao measurements according to the dog's weight. The estimated constant b was slightly higher than the theoretical value of 2/3 for our 2‐dimensional measurements (ie, CVCamin‐HV‐B, CVCamax‐HV‐B; Table 4). Further studies on 2‐dimensional measurements with allometric scaling of the CVC in dogs need to be performed to investigate whether this theoretical value of 2/3 is suitable for CVC areas in dogs. The values of R 2 were lower in the HV compared with the PV sites, suggesting that the HV site fitted less with the linear regression (see Equation 2). This result may arise from a greater variability of the CVC measurements when measured at the HV site because of respiratory movements, whereas at the PV sites, it has been shown that respiratory movements influence CVC values minimally.23
In humans, the IVCCI provides a better assessment of intravascular volume and can better predict fluid responsiveness in critically ill patients than absolute IVC diameter alone.6, 33 In the current study, the inspiratory and expiratory diameters of the CVC at the subxiphoid location were used to calculate CVCCI. However, RV were not calculated at this location because the inter‐rater variability for CVCCI was poor (CCC < 0.7), and only means (±SD) were provided. Poor inter‐rater variability was probably a consequence of respiratory movement of the liver, diaphragm, and CVC that occurs at this site and uncontrolled breathing, making it difficult to measure the diameter of the CVC at the same CVC location on inspiration and expiration. Although inter‐rater variability for the CVCCI may be high in healthy dogs, it is possible that CVC measurements at this location will have less inter‐rater variability when measured in hypervolemic or hypovolemic dogs. In humans, the greatest variation of IVCCI occurs in healthy populations,34 with less variation occurring in patients with values outside established reference intervals.35 However, IVCCI still is widely used in humans in critical care units to determine intravascular status. Despite high inter‐rater variability, CVC assessment at this location still may permit differentiation of dogs that can tolerate a fluid bolus (hypovolemic or euvolemic CVC) from dogs that may not be able to tolerate a fluid bolus because of hypervolemia (distended CVC).
In human medicine, the IVC/Ao often is used to assess intravascular volume because it can be used in patients with various weights and body sizes.36, 37, 38 Therefore, comparing the diameter of the IVC with the diameter of the abdominal aorta corrects for patients of various age, size, and weight. Two recent studies validated ultrasonographic assessment of CVC/Ao using the spleno‐renal and hepatic views to estimate volemia in dogs.18, 20 In our study, a RV for CVC/Ao was not calculated because of poor inter‐rater variability, but means (±SD) were provided.
In human medicine, the IVC diameter reference interval varies greatly among individuals but is not substantially influenced by individual characteristics.1 A few studies report normal IVC values in human adults and pediatric patients.10, 28 One study found a statistically significant positive correlation between age and IVC diameter in healthy pediatric patients.39 In our study, only dogs between 1 and 8 years of age were included, and we may have failed to detect changes in pediatric and geriatric patients.
Sonographic measurement of the CVC and Ao at the 3 anatomic locations in our study is simple, easily learned using a short training session (good inter‐rater agreement), and can be performed rapidly23 as in humans.40 As indicated by a high CCC value, the PV and HV sites had good inter‐rater agreement between the 2 observers in each country. Further investigation by novice veterinary sonographers is required to further assess feasibility of these techniques on healthy and critically ill patients.
Our study had some limitations. Dogs were assessed in left lateral recumbency. The position of the patient is known to influence CVC diameter in humans, with left lateral recumbency creating the smallest diameter, right lateral recumbency creating the largest diameter and dorsal recumbency providing intermediate values for IVC measurement.41 The effect of patient position on the CVCD in dogs still needs to be evaluated. Furthermore, the true volume status of the dogs in this study was based on history and physical examination findings, and as previously mentioned, is difficult to assess in healthy dogs. In addition, because echocardiography was not performed, it is possible that occult underlying cardiac pathology particularly that leading to right‐sided congestive heart disease, may have influenced the CVCD. Finally, we cannot exclude an effect of body conformation in brachycephalic dogs.
5. CONCLUSIONS
We determined sonographic reference intervals for the CVC and aorta at 3 different anatomic locations in healthy spontaneously breathing dogs. The RVs using allometric scaling for CVCa at the HV for inspiration and expiration, and Aomax at the HV in B‐Mode were 6.16 × BW0.762, 7.24 × W0.787, 3.85 × BW0.323. The RVs using allometric scaling for CVCD and AoD at the PV in B‐Mode were 2.79 × BW0.390 and 3.49 × BW0.332, respectively.
The SV, although easily obtained, had poor inter‐rater variability, and further studies are required to determine the value of this location to discriminate normovolemic from hypovolemic and hypervolemic dogs. Values outside these established reference intervals should prompt the clinician to further investigate the intravascular volume status of the patient.
CONFLICT OF INTEREST DECLARATION
Authors declare no conflict of interest.
OFF‐LABEL ANTIMICROBIAL DECLARATION
Authors declare no off‐label use of antimicrobials
INSTITUTIONAL ANIMAL CARE AND USE COMMITTEE (IACUC) OR OTHER APPROVAL DECLARATION
Ethical approval obtained at University of Calgary and University of Liège, #14–1749 and #AC16–0079.
ACKNOWLEDGMENTS
The work was performed at Liège (Belgium) and Calgary (Canada) Universities. This study was supported by Scil Animal Care Company (EVECC grant obtained in 2016). An abstract was presented at the 2017 EVECC congress in Dublin. Acknowledgment to Dr. Gregory Lisciandro for the cineloops of the subxiphoid view, the UCVM (University of Calgary Veterinary Medicine) and ULg (University of Liège) veterinary students, and the ULg/UCVM/Western Vet/and CARE veterinary clinic faculty, staff and students that volunteered their dogs.
Darnis E, Boysen S, Merveille A‐C, Desquilbet L, Chalhoub S, Gommeren K. Establishment of reference values of the caudal vena cava by fast‐ultrasonography through different views in healthy dogs. J Vet Intern Med. 2018;32:1308–1318. 10.1111/jvim.15136
Funding information Scil Animal Care Company
REFERENCES
- 1. Gui J, Guo J, Nong F, et al. Impact of individual characteristics on sonographic IVC diameter and the IVC diameter/aorta diameter index. Am J Emerg Med. 2015;33:1602–1605. [DOI] [PubMed] [Google Scholar]
- 2. De Backer D, Scolletta S. Year in review 2010: critical care cardiology. Crit Care. 2011;15:241. [DOI] [PMC free article] [PubMed] [Google Scholar]
- 3. Kalantari K, Chang JN, Ronco C, Rosner MH. Assessment of intravascular volume status and volume responsiveness in critically ill patients. Kidney Int. 2013;83:1017–1028. [DOI] [PubMed] [Google Scholar]
- 4. Adamantos S, Brodbelt D, Moores AL. Prospective evaluation of complications associated with jugular venous catheter use in a veterinary hospital. J Small Anim Pract. 2010;51:254–257. [DOI] [PubMed] [Google Scholar]
- 5. Gong P, Huang XE, Chen CY, Liu JH, Meng AF, Feng JF. Comparison of complications of peripherally inserted central catheters with ultrasound guidance or conventional methods in cancer patients. Asian Pac J Cancer Prev. 2012;13:1873–1875. [DOI] [PubMed] [Google Scholar]
- 6. Naghipour B, Faridaalaee G. Correlation between central venous pressure and inferior vena cava sonographic diameter; determining the best anatomic location. Emergency (Tehran). 2016;4:83–87. [PMC free article] [PubMed] [Google Scholar]
- 7. Hu B, Xiang H, Liang H, et al. Assessment effect of central venous pressure in fluid resuscitation in the patients with shock: a multi‐center retrospective research. Chin Med J (Engl). 2013;126:1844–1849. [PubMed] [Google Scholar]
- 8. Marik PE, Baram M, Vahid B. Does central venous pressure predict fluid responsiveness? A systematic review of the literature and the tale of seven mares. Chest. 2008;134:172–178. [DOI] [PubMed] [Google Scholar]
- 9. Hutchinson KM, Shaw SP. A review of central venous pressure and its reliability as a hemodynamic monitoring tool in veterinary medicine. Top Companion Anim Med. 2016;31:109–121. [DOI] [PubMed] [Google Scholar]
- 10. Miller A, Mandeville J. Predicting and measuring fluid responsiveness with echocardiography. Echo Res Pract. 2016;3:G1–G12. [DOI] [PMC free article] [PubMed] [Google Scholar]
- 11. Corl KA, George NR, Romanoff J, et al. Inferior vena cava collapsibility detects fluid responsiveness among spontaneously breathing critically‐ill patients. J Crit Care. 2017;41:130–137. [DOI] [PubMed] [Google Scholar]
- 12. Patil S, Jadhav S, Shetty N, et al. Assessment of inferior vena cava diameter by echocardiography in normal Indian population: A prospective observational study. Indian Heart J. 2016;68:S26–S30. [DOI] [PMC free article] [PubMed] [Google Scholar]
- 13. Zhang Q, Liu D, Wang X, et al. Inferior vena cava diameter and variability on longitudinal plane measured through ultrasonography from different sites: a comparison study. Zhonghua Nei Ke Za Zhi. 2014;53:880–883. [PubMed] [Google Scholar]
- 14. Mandelbaum A, Ritz E. Vena cava diameter measurement for estimation of dry weight in haemodialysis patients. Nephrol Dial Transplant. 1996;11:24–27. [DOI] [PubMed] [Google Scholar]
- 15. Dipti A, Soucy Z, Surana A, Chandra S. Role of inferior vena cava diameter in assessment of volume status: a meta‐analysis. Am J Emerg Med. 2012;30:1414–1419.e1. [DOI] [PubMed] [Google Scholar]
- 16. Nelson NC, Drost WT, Lerche P, Bonagura JD. Noninvasive estimation of central venous pressure in anesthetized dogs by measurement of hepatic venous blood flow velocity and abdominal venous diameter. Vet Radiol Ultrasound. 2010;51:313–323. [DOI] [PubMed] [Google Scholar]
- 17. Meneghini C, Rabozzi R, Franci P. Correlation of the ratio of caudal vena cava diameter and aorta diameter with systolic pressure variation in anesthetized dogs. Am J Vet Res. 2016;77:137–143. [DOI] [PubMed] [Google Scholar]
- 18. Cambournac M, Goy‐Thollot I, Violé A, Boisvineau C, Pouzot‐Nevoret C, Barthélemy A. Sonographic assessment of volaemia: development and validation of a new method in dogs. J Small Anim Pract. 2018;59(3):174–182. [DOI] [PubMed] [Google Scholar]
- 19. Tuplin MC, Romero AE, Boysen SR. Influence of the respiratory cycle on caudal vena cava diameter measured by sonography in healthy foals: a pilot study. J Vet Intern Med. 2017;31(5):1556–1562. [DOI] [PMC free article] [PubMed] [Google Scholar]
- 20. Kwak J, Yoon H, Kim J, Kim M, Eom K. Ultrasonographic measurement of caudal vena cava to aorta ratios for determination of volume depletion in normal beagle dogs. Vet Radiol Ultrasound. 2018;59(2):203–211. [DOI] [PubMed] [Google Scholar]
- 21. Bucci M, Rabozzi R, Guglielmini C, Franci P. Respiratory variation in aortic blood peak velocity and caudal vena cava diameter can predict fluid responsiveness in anaesthetised and mechanically ventilated dogs. Vet J. 2017;227:30–35. [DOI] [PubMed] [Google Scholar]
- 22. Kutty S, Li L, Hasan R, Rangamani S, Danford DA. Systemic venous diameters, collapsibility indices, and right atrial measurements in normal pediatric subjects. J Am Soc Echocardiogr. 2014;27:155–162. [DOI] [PubMed] [Google Scholar]
- 23. Darnis E, Merveille A‐C, Desquilbet L, et al. Inter‐observer agreement between non‐cardiologist veterinarians and a cardiologist after a 6‐hour training course for echographic evaluation of basic echocardiographic parameters and caudal vena cava diameter in fifteen healthy Beagles. J Vet Emerg Crit Care. In press. [DOI] [PubMed] [Google Scholar]
- 24. Lin LI. A concordance correlation coefficient to evaluate reproducibility. Biometrics. 1989;45:255–268. [PubMed] [Google Scholar]
- 25. Landis JR, Koch GG. The measurement of observer agreement for categorical data. Biometrics. 1977;33:159–174. [PubMed] [Google Scholar]
- 26. Partik BL, Stadler A, Schamp S, et al. 3D versus 2D ultrasound: accuracy of volume measurement in human cadaver kidneys. Invest Radiol. 2002;37:489–495. [DOI] [PubMed] [Google Scholar]
- 27. Häggström J, Andersson Å, Falk T, et al. Effect of Body Weight on Echocardiographic Measurements in 19,866 Pure‐Bred Cats with or without Heart Disease. J Vet Intern Med. 2016;30:1601–1611. [DOI] [PMC free article] [PubMed] [Google Scholar]
- 28. Cornell CC, Kittleson MD, Della Torre P, et al. Allometric scaling of M‐mode cardiac measurements in normal adult dogs. J Vet Intern Med. 2004;18:311–321. [DOI] [PubMed] [Google Scholar]
- 29. Oxborough D, Ghani S, Harkness A, et al. Impact of methodology and the use of allometric scaling on the echocardiographic assessment of the aortic root and arch: a study by the Research and Audit Sub‐Committee of the British Society of Echocardiography. Echo Res Pract. 2014;1:1–9. [DOI] [PMC free article] [PubMed] [Google Scholar]
- 30. Korcarz CE, Padrid PA, Shroff SG, Weinert L, Lang RM. Doppler echocardiographic reference values for healthy rhesus monkeys under ketamine hydrochloride sedation. J Med Primatol. 1997;26:287–298. [DOI] [PubMed] [Google Scholar]
- 31. Kwak HS, Im HG, Shim EB. A model for allometric scaling of mammalian metabolism with ambient heat loss. Integr Med Res. 2016;5:30–36. [DOI] [PMC free article] [PubMed] [Google Scholar]
- 32. Snedecor GW, Cochran WG. Statistical methods. 6th ed. Ames: Iowa State University Press; 1967:xiv, 593.
- 33. Nagdev AD, Merchant RC, Tirado‐Gonzalez A, Sisson CA, Murphy MC. Emergency department bedside ultrasonographic measurement of the caval index for noninvasive determination of low central venous pressure. Ann Emerg Med. 2010;55:290–295. [DOI] [PubMed] [Google Scholar]
- 34. Finnerty NM, Panchal AR, Boulger C, et al. Inferior vena cava measurement with ultrasound: what is the best view and best mode? West J Emerg Med. 2017;18:496–501. [DOI] [PMC free article] [PubMed] [Google Scholar]
- 35. Stawicki SP, Braslow BM, Panebianco NL, et al. Intensivist use of hand‐carried ultrasonography to measure IVC collapsibility in estimating intravascular volume status: correlations with CVP. J Am Coll Surg. 2009;209:55–61. [DOI] [PubMed] [Google Scholar]
- 36. Kieliszczyk J, Baranowski W, Kosiak W. Usefulness of ultrasound examination in the evaluation of a neonate's body fluid status. J Ultrason. 2016;16:125–134. [DOI] [PMC free article] [PubMed] [Google Scholar]
- 37. Kwon H, Jung JY, Lee JH, et al. Sonographic aorta/IVC cross‐sectional area index for evaluation of dehydration in children. Am J Emerg Med. 2016;34:1840–1844. [DOI] [PubMed] [Google Scholar]
- 38. Durajska K, Januszkiewicz E, Szmygel Ł, Kosiak W. Inferior vena cava/aorta diameter index in the assessment of the body fluid status ‐ a comparative study of measurements performed by experienced and inexperienced examiners in a group of young adults. J Ultrason. 2014;14:273–279. [DOI] [PMC free article] [PubMed] [Google Scholar]
- 39. Kathuria N, Ng L, Saul T, Lewiss RE. The baseline diameter of the inferior vena cava measured by sonography increases with age in normovolemic children. J Ultrasound Med. 2015;34:1091–1096. [DOI] [PubMed] [Google Scholar]
- 40. Mathew LL, Neha V. Ultrasound guided volume assessment using inferior vena cava diameter. Open Emerg Med J. 2010;22–24. [Google Scholar]
- 41. Ciozda W, Kedan I, Kehl DW, Zimmer R, Khandwalla R, Kimchi A. The efficacy of sonographic measurement of inferior vena cava diameter as an estimate of central venous pressure. Cardiovasc Ultrasound. 2015;14:33. [DOI] [PMC free article] [PubMed] [Google Scholar]