 This study aimed to explore the role of the NF-κB signaling pathway in rat liver toxicity after nano NiO exposure.
Abstract
Studies have demonstrated that nano NiO could induce liver toxicity in rats, but its mechanism remains unclear. This study aimed to explore the role of the NF-κB signaling pathway in rat liver toxicity after nano NiO exposure. Male Wistar rats were exposed to nano NiO (0.015, 0.06 and 0.24 mg per kg b.w.) and micro NiO (0.24 mg per kg b.w.) by intratracheal instillation twice a week for 6 weeks. To investigate the liver toxicity induced by nano NiO, the indicators of liver function and inflammatory response were detected, and the histopathological changes were observed. The levels of NF-κB signaling pathway related gene and protein expression were examined using RT-qPCR and western blot techniques in the liver tissue. The results showed that the activities of alanine aminotransferase (ALT), aspartate aminotransferase (AST), alkaline phosphatase (ALP) and gamma-glutamyltranspeptidase (GGT) increased after nano NiO exposure. Cellular edema, hepatic sinus disappearance, and neutrophil and lymphocyte infiltration were observed. Nano NiO increased the concentrations of pro-inflammatory cytokines (IL-1β and IL-6), but decreased the levels of anti-inflammatory cytokines (IL-4 and IL-10). It also induced the upregulation of TNF-α, NF-κB-inducible kinase (NIK), IκB kinase alpha (IKK-α) and NF-κB mRNA, while inducing the downregulation of the inhibitor kappa B (IκB) alpha. In addition, we found that the protein content of NIK, IKK-α, p-IKK-α, p-IκB-α and NF-κB was elevated, whereas that of IκB-α was reduced. The results indicated that the NF-κB signaling pathway played an important role in rat liver toxicity induced by nano NiO.
Introduction
Nanoparticles, with a diameter range of 1 to 100 nm in at least one dimension of scale, have unique physicochemical properties such as small size, large surface area and high surface reactivity, and have been applied in medical healthcare, scientific research and various industries.1,2 Nano nickel oxide (NiO) as a new product has been widely used in battery electrodes, sensor magnetic materials, diesel-fuel additives and catalyzers, which has increased the probability of human exposure.3,4
In recent years, researchers have focused on pulmonary toxicity induced by nano NiO. Horie et al.5 reported that nano NiO induced oxidative stress in rat lung tissue and human lung carcinoma A549 cells. Pietruska et al.6 found that nano NiO led to abnormal apoptosis in human lung epithelial cells via the hypoxia inducing factor 1 alpha pathway. Our previous studies indicated that nano NiO caused pulmonary fibrosis and inflammatory response, which was mediated by the transforming growth factor-beta 1 (TGF-β1) and nuclear factor kappa B (NF-κB) signaling pathway, as well as Th1/Th2 imbalance.7–9 In addition, nano NiO induced cytotoxicity in HeLa cells, human bronchial cells, HCT 116 carcinoma epithelial cells and human breast cancer cells.10–13
The liver is known to be responsible for the metabolism of exogenous substances including proteins, carbohydrates, drugs and toxins.14 Nanoparticles can enter the blood circulatory system via skin and the gastrointestinal and respiratory tract, and be deposited in the liver.15 Nano nickel particles induced oxidative stress and apoptosis via the mitochondrial pathway in HepG2 cells.16,17 Nano nickel zinc ferrite particles resulted in cytotoxicity, fragmented DNA and apoptosis in HepG2 cells.18 Nano NiO caused cytotoxicity, generation of reactive oxygen species, micronuclei induction, chromatin condensation, DNA damage and increased activity of the caspase-3 enzyme in HepG2 cells along with an increase in the bax mRNA level and a decrease in bcl-2.19 Magaye et al.20 found that nano nickel, introduced by intravenous injection, could result in lymphocytic infiltration at the periphery and distorted architecture of the liver parenchyma, and in an increase in the liver weight/body weight coefficient as well as the activity of alkaline phosphatase (ALP) and alanine aminotransferase (ALT) in a dose dependent manner. An elevated activity of ALT and aspartate aminotransferase (AST) in serum, and an increasing number of Kupffer cells, binucleated hepatocytes and akaryotic hepatocytes in rat liver, were discovered after repeated intraperitoneal injections of nano NiO.21 Taken together, existing studies have indicated that nano NiO can trigger liver toxicity, while its potential mechanisms are still unclear.
Tumor necrosis factor alpha (TNF-α), as a trigger for liver disease, played a critical role in the progress of the inflammatory response.22–24 Nano gold particles could be uptaken by macrophages after entering the blood circulatory system and organs, with the secretion of key cytokines such as TNF-α.25 Meanwhile TNF-α could mediate the activation of the NF-κB signaling pathway regulated by the NF-κB-inducible kinase (NIK)/IκB kinase alpha (IKK-α) axis.26–29 Chen et al.30 reported that nano titanium oxide (TiO2) induced an increase in TNF-α and pro-inflammatory gene A20 mRNA levels, with IκB-α phosphorylation and NF-κB signaling pathway activation in HepG2 cells, hinting that the NF-κB signaling pathway participated in the inflammation response. Nano TiO2 exposure led to large overall fatty degeneration, necrosis, and some inflammatory cell infiltration in rat liver, as well as an elevation of the protein content of TNF-α, TLRs, NIK, IKK-α, IKK-β and NF-κB, which suggested that nano TiO2 induced the liver inflammatory response via the NF-κB signaling pathway in rats.23 Therefore we hypothesized that nano NiO could induce liver toxicity via the activation of the NF-κB signaling pathway mediated by TNF-α.
In the present study, liver damaged models were built following the intratracheal instillation of nano NiO in rats. In order to verify liver toxicity, we evaluated the liver function indicators including ALT, AST, ALP and gamma-glutamyltranspeptidase (GGT) in serum, and the inflammatory cytokines (IL-1β, IL-6, IL-4 and IL-10) in liver tissue. To explore the potential mechanism, we examined the gene expression levels of TNF-α, NIK, IKK-α, IκB-α and NF-κB, as well as the protein content of TNF-α, NIK, IKK-α, p-IKK-α, IκB-α, p-IκB-α and NF-κB.
Materials and methods
NiO sample preparation
Nano and micro NiO were obtained from ST-nano science and technology Co., Ltd (Shanghai, China). Preparation of the NiO samples, detection methods for NiO particle characterization and the endotoxin assay conditions are detailed in the ESI.
Animals and treatment
Forty male Wistar rats (180–220 g) were purchased from the Experimental Animal Center of Lanzhou University (SCXK2013-0002, Lanzhou, China), and housed in a temperature (20 ± 2 °C) and relative humidity (60%) controlled room with a lighting schedule of 12 h alternate light–dark cycles, and commercial diets and tap water were available ad libitum. The rats were left to acclimatize to these conditions for one week before the commencement of intratracheal instillation. All experimental protocols were performed in accordance with institution criteria for the care and use of laboratory animals approved by the Ethical Committee of Lanzhou University.
Forty adult male Wistar rats were randomized into five groups for intratracheal instillation, namely control group, 0.015 mg kg–1 nano NiO group, 0.06 mg kg–1 nano NiO group, 0.24 mg kg–1 nano NiO group and 0.24 mg kg–1 micro NiO group. These dosages of nano and micro NiO were based on our previous studies.8 All rats were anesthetized with diethyl ether and intratracheally instilled with 0.9% normal saline and NiO suspensions (a volume of 1 ml per kg b.w.) twice a week for six weeks. The liver tissues were dissected quickly and blood samples (5 ml from each rat) from the rats were collected into non-heparinized tubes by exsanguination via the heart and stored at –80 °C for further analysis.
Liver enzyme assay in serum
Serum was separated from blood clots by centrifugation at 1200g for 10 min. The activity of the liver enzymes including ALT, AST, ALP and GGT in serum was assayed using commercial kits (Nanjing Jiancheng bioengineering institute, China).
Histopathological examination
To explore whether the liver was injured by nano NiO in rats, the middle lobes of the liver tissue were fixed in 4% paraformaldehyde, cut into 5 μm sections and then transferred onto slides after being embedded in paraffin. The sections were passed in xylene to dewax, then dehydrated in ethanol of different concentrations, and stained with hematoxylin and eosin. The slides were dehydrated with 95% and absolute ethanol, cleared in xylene and sealed by neutral gum.
Inflammatory response cytokine assay in liver tissue
The right lobes of the liver tissue were homogenized with 0.9% normal saline and centrifuged at 1100g for 20 min at 4 °C. The supernatant was collected and stored at –80 °C for further analysis. The content of the pro-inflammatory cytokines (IL-1β and IL-6) and anti-inflammatory cytokines (IL-4 and IL-10) was measured using enzyme-linked immunosorbent assay (ELISA) kits for rats (Elabscience, China) according to the instructions.
RNA isolation and real-time quantitative polymerase chain reaction
A real-time quantitative polymerase chain reaction (RT-qPCR) was performed to quantify the mRNA relative expression levels of TNF-α, NIK, IKK-α, IκB-α and NF-κB. Total RNA was extracted from approximately 95 mg caudate lobes of liver using 1 ml TRIzol reagent (Invitrogen, USA). The quality and purity of total RNA were assayed using a NanoDrop 2000C spectrophotometer (Thermo Scientific, USA). Complementary DNA (cDNA) was synthesized using total RNA (1 μg) with an A260/A280 ratio of between 1.8 and 2.2 using a Fast Quant RT kit (Tiangen Biotech Co., Ltd, China) and oligo primers (Shanghai Generay Biotechnology, China) after gDNA clearance.
RT-qPCR was performed in a IQ5 Multicolor Real-Time PCR Detection System (Bio-Rad, USA) with the following thermal cycler settings, as recommended by the manufacturers (Tiangen Biotech Co., Ltd, China): 15 min at 95 °C followed by 40 cycles including denaturation at 95 °C for 10 s, annealing at 50–60 °C for 20 s, and extension at 72 °C for 32 s, then the temperature was increased to 95 °C by 0.5 °C per second to generate the melting curve. The primer sequences of TNF-α, NIK, IKK-α, IκB-α and NF-κB are listed in Table 1. β-Actin was used as the internal reference, and the relative expression levels of mRNA were quantified with the Pfaffl method.31 The relative mRNA expression of the target genes is expressed as a fold change compared with the control group.
Table 1. Primer sequences and theoretical amplification length.
| Genes | Primer sequences (5′ to 3′) | Product size (bp) | |
| β-Actin | Forward | CCAACCGTGAAAAGATGA | 102 |
| Reverse | TACGACCAGAGGCATACAG | ||
| TNF-α | Forward | CCCCTTTATCGTCTACTCCT | 131 |
| Reverse | AGCGTCTCGTGTGTTTCT | ||
| NIK | Forward | ATCTGTTTCCCCTCATCTTT | 156 |
| Reverse | TGGTATCTGTGCTTCTCTCC | ||
| IKK-α | Forward | TCTGGGCTAAAGGAGGAC | 127 |
| Reverse | TGAGTTGCTGTGATGCTG | ||
| IκB-α | Forward | GACTTTGGGTGCTGATGT | 140 |
| Reverse | CCTGGTAGGTTACTCTGTTGA | ||
| NF-κB | Forward | AATGGTGGAGTTTGGGAA | 113 |
| Reverse | GCTGGCTTTGTAATGTTGA |
Western blot
Approximately 100 mg of the caudate lobes of liver were homogenized in 1.0 ml radioimmunoprecipitation buffer containing 10 μl phenylmethanesulfonyl fluoride and 10 μl β-glycerophosphoric acid disodium salt (calcineurin inhibitor), then centrifuged at 14 000g at 4 °C for 5 min. The concentrations of the total protein in the supernatant were quantified with the bicinchoninic acid assay kit (Thermo Scientific, USA). The protein samples were denatured at 99 °C for 5 min after being mixed with sodium dodecyl sulfate (SDS) buffer.
For the western blot, protein samples (50 μg) and 2.5 μl rainbow prestained protein marker (10–170 kDa, Thermo Scientific, USA) were separated using SDS-polyacrylamide gel electrophoresis (SDS-PAGE). TNF-α was separated using 15% SDS-PAGE, NIK was separated using 8% SDS-PAGE, and β-actin, IKK-α, p-IKK-α, IκB-α, p-IκB-α and NF-κB were separated using 10% SDS-PAGE. The proteins were transferred to the polyvinylidenedifluoride membranes (Millipore, USA) in transfer buffer. Then the membranes were blocked in blocking buffer (Tris-saline-Tween 20 buffer (TBST) containing 5% skimmed milk). After being washed for three 5 min periods in TBST, the membranes were incubated overnight at 4 °C in goat anti-rat β-actin, NIK, IKK-α, and NF-κB (1 : 500 dilution) primary antibodies, as well as in rabbit anti-rat TNF-α, p-IKK-α, IκBα and p-IκB-α (1 : 500 dilution) primary antibodies, seperately. The blots were then incubated in horseradish peroxidase-conjugated rabbit anti-goat and goat anti-rabbit secondary antibodies (1 : 5000 dilution) for 120 min at room temperature on a rocking table after being rinsed in TBST for three 5 min periods. Then the membranes were incubated using an enhanced chemiluminescence reagent (Thermo Scientific, USA) and exposed in a Molecular Imager ChemiDoc XRS System (Bio-Rad, USA) after being rinsed for three 5 min periods in TBST. A semiquantitative analysis of the target immunolabeled bands was performed using Image Pro-Plus 6.0 software (Media Cybernetics, USA), to calculate the ratio of p-IKK-α/IKK-α and p-IκB-α/IκB-α respectively.
Statistical analysis
All data were analyzed using SPSS 20.0 software (IBM, USA) and expressed as mean ± standard deviation. One-way analysis of variance (ANOVA) was performed for comparisons among multiple groups. The significance of the difference between two groups was judged according to the least significant difference (LSD) test. A two tailed value of p less than 0.05 was considered as a statistical difference.
Results
Particle characterization
The average size of nano NiO was 20 nm and that of micro NiO was 1 μm in the powder form, analysed using a scanning electron microscope. The hydrodynamic size of nano NiO was 244.5 nm in an exposure medium, analysed using dynamic light scattering in the exposure medium. The results of the endotoxin examination were negative in the NiO suspension. The details of the physicochemical characterizations are presented in the ESI.
Liver dysfunction and histopathological changes
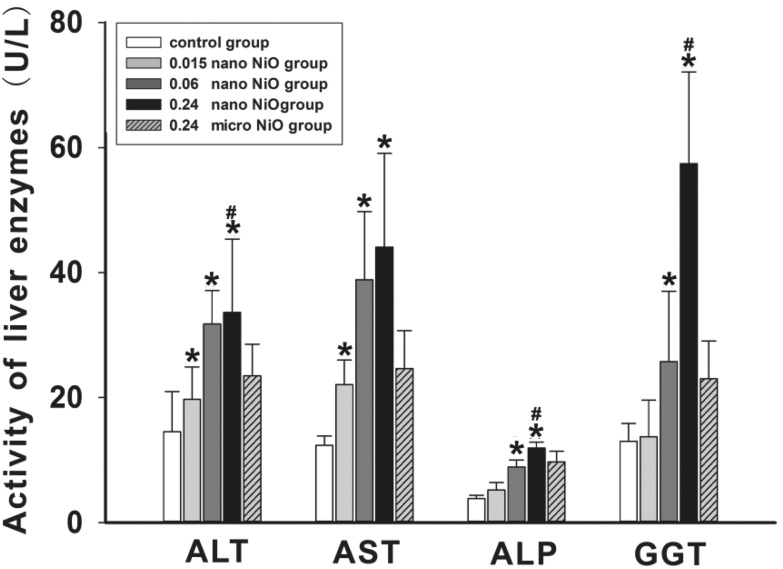
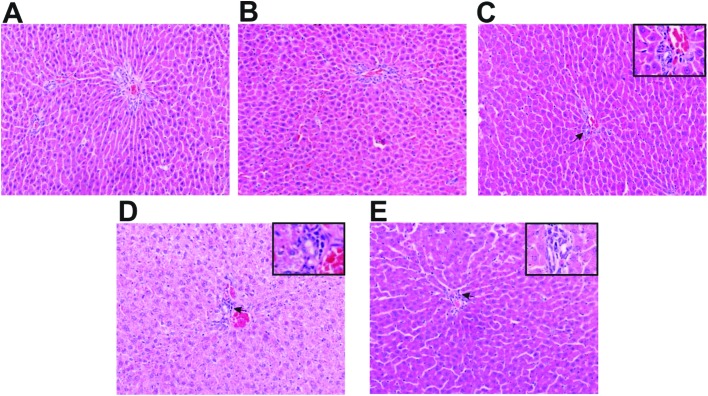
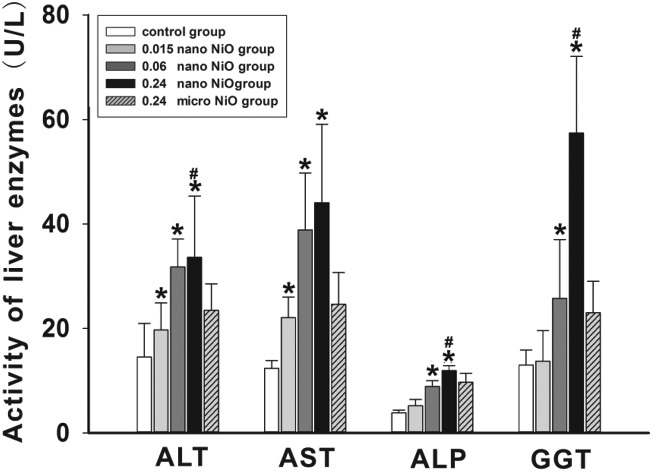
We detected the activity of the liver enzymes including ALT, AST, ALP and GGT in serum (Fig. 1), and observed the histopathological changes in rat liver (Fig. 3) to verify whether liver dysfunction was induced by nano NiO. Compared with the control group, an elevation of ALT, AST, ALP and GGT appeared in the 0.06 and 0.24 mg kg–1 nano NiO group (p < 0.05). In addition, the ALT, ALP and GGT activity was increased in the 0.24 mg kg–1 nano NiO group compared to the micro NiO group (p < 0.05). Fig. 2 shows that nano NiO caused hepatic cellular edema, hepatic sinus disappearance, and neutrophil and lymphocyte infiltration, as well as sporadic spotty necrosis in the nano NiO 0.24 mg kg–1 group.
Fig. 1. The changes in the indicators of liver function in rats, n = 8. Data are expressed as mean ± standard deviation. *Significant difference from the control group, p < 0.05. #Significant difference from the 0.24 mg kg–1 micro NiO group, p < 0.05.
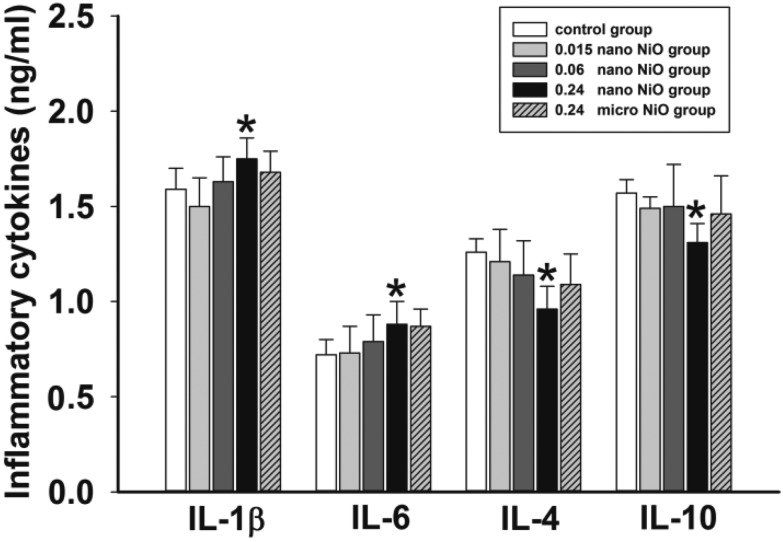
Fig. 3. Levels of inflammatory cytokines in rat liver, n = 8. Data are expressed as mean ± standard deviation. *Significant difference from the control group, p < 0.05.
Fig. 2. Photomicrographs stained by hematoxylin and eosin in rat liver (×200), n = 5. (A) Control, (B) 0.015 mg kg–1 nano NiO, (C) 0.06 mg kg–1 nano NiO, (D) 0.24 mg kg–1 nano NiO, and (E) 0.24 mg kg–1 micro NiO. Parts of the photos were amplified to observe any abnormal changes (×400). → represents the infiltration of neutrophils and lymphocytes.
Pro-/anti-inflammatory cytokine imbalance
To evaluate whether nano NiO could induce inflammation response, we measured the concentrations of the pro-inflammatory (IL-1β and IL-6) and anti-inflammatory (IL-4 and IL-10) cytokines by ELISA assay in liver tissue. As shown in Fig. 3, the content of IL-1β and IL-6 was elevated, while the content of IL-4 and IL-10 was reduced in the 0.24 mg kg–1 nano NiO group, when compared to the control group (p < 0.05).
Increasing content of TNF-α
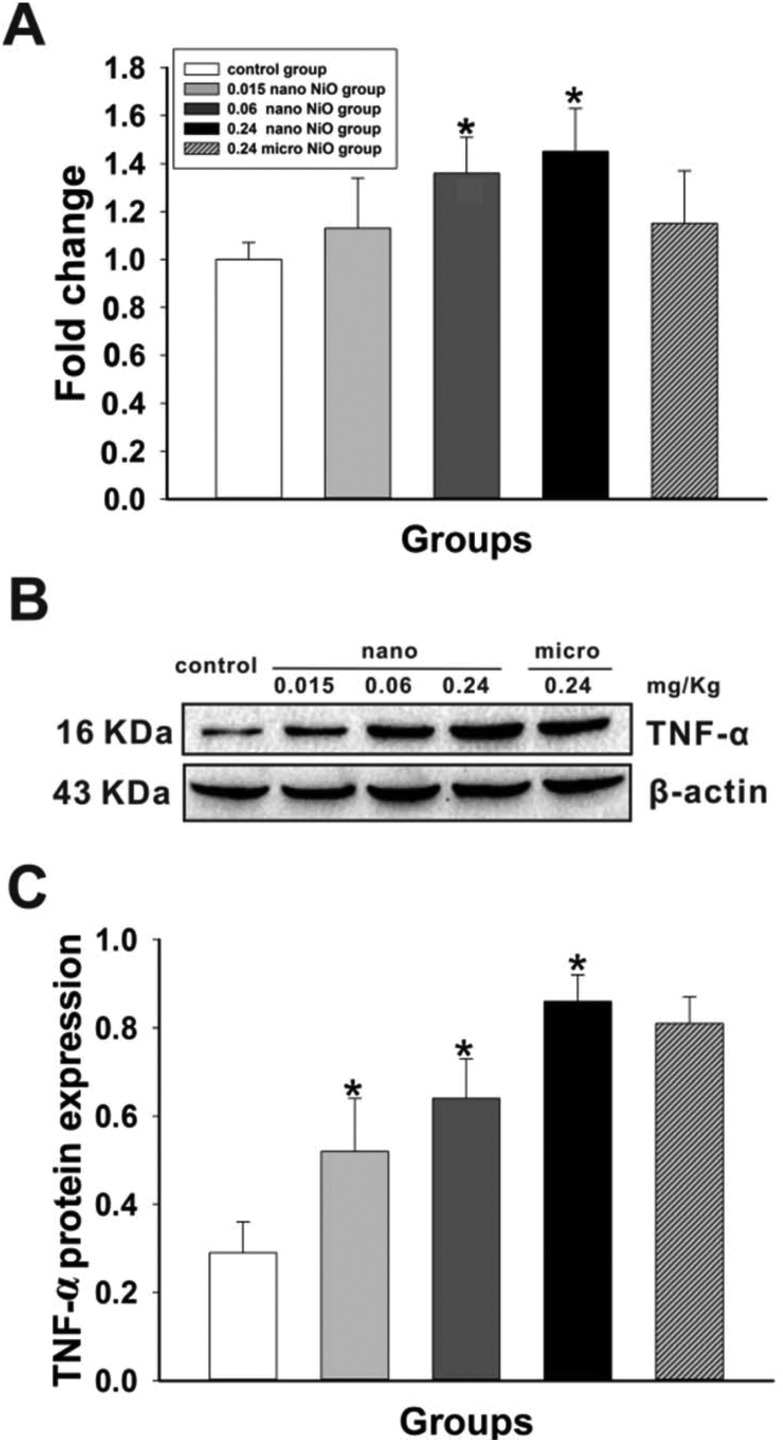
We examined the mRNA and protein levels of TNF-α in rat liver (Fig. 4) to verify if TNF-α was activated by nano NiO. Compared with the control group, nano NiO led to an upregulation of the mRNA and protein levels of TNF-α in the 0.06 and 0.24 mg kg–1 groups (p < 0.05).
Fig. 4. The increasing levels of TNF-α mRNA and protein in rat liver. (A) Relative mRNA expression levels, n = 8. (B) Protein expression levels and (C) semiquantitative analysis, n = 5. *Significant difference from the control group, p < 0.05.
Gene expression of the NF-κB pathway
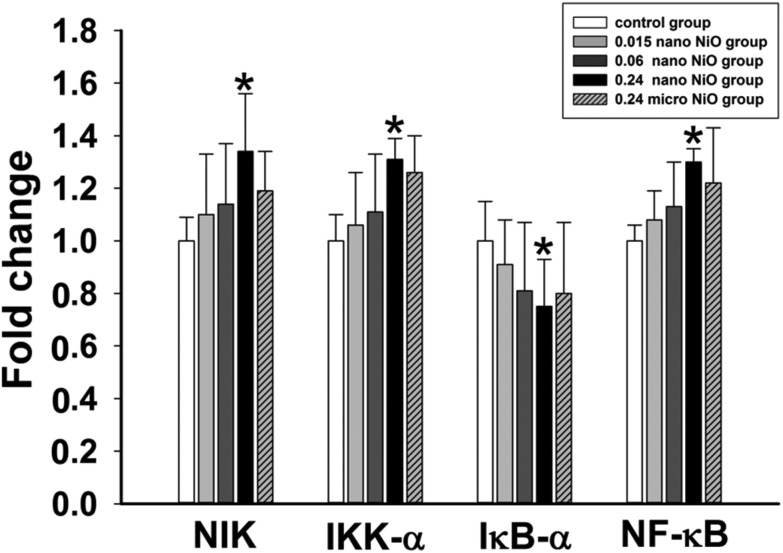
To explore the potential mechanism, the mRNA expression levels of the NF-κB pathway were detected using RT-qPCR. As shown in Fig. 5, nano NiO resulted in upregulation of the NIK, IKK-α and NF-κB mRNA levels, while resulting in downregulation of the IκB-α mRNA levels. Those results implied that the NF-κB pathway was associated with liver toxicity.
Fig. 5. Relative mRNA expression levels of NIK, IKK-α, IκB-α and NF-κB in rat liver after NiO particle exposure. Data are expressed as mean ± standard deviation, n = 8. *Significant difference from the control group, p < 0.05.
NIK/IKK-α activated by TNF-α
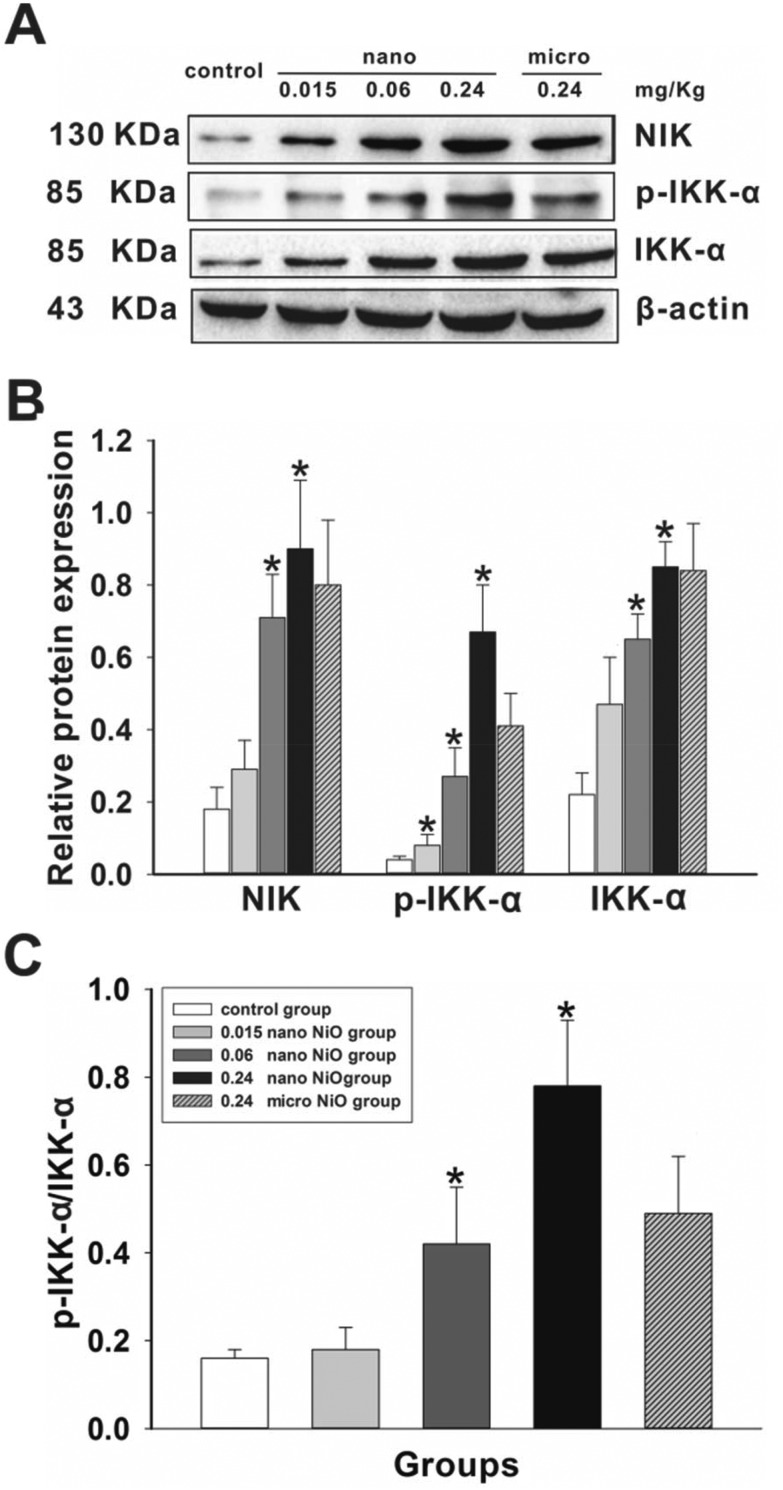
We detected the protein expression levels of NIK, IKK-α and p-IKK-α using western blot to judge whether NIK/IKK-α could be activated by TNF-α (Fig. 6). Compared to the control group, the protein expression levels of NIK, IKK-α and p-IKK-α were increased in the 0.24 mg kg–1 nano NiO group, followed by an increasing ratio of p-IKK-α/IKK-α (p < 0.05).
Fig. 6. Nano NiO increases NIK, IKK-α and p-IKK-α protein expression in rat liver. (A) Protein expression levels and (B) semiquantitative analysis of NIK, p-IKK-α and IKK-α, n = 5. (C) The protein ratio of p-IKK-α and IKK-α, n = 5. *Significant difference from the control group, p < 0.05.
NF-κB activated by phosphorylated IκB-α
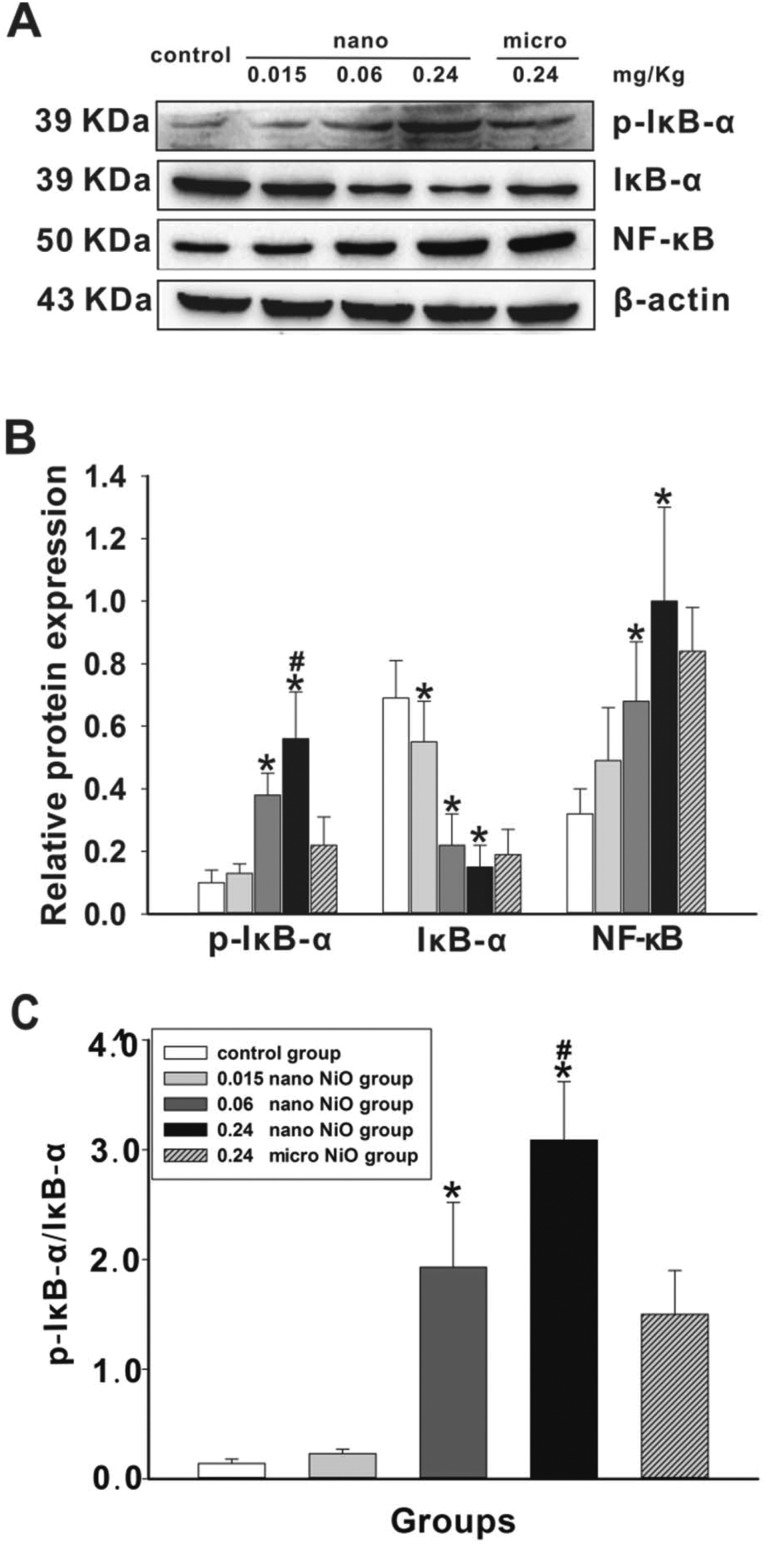
In order to verify whether NF-κB was activated by phosphorylated IκB-α, the expression levels of IκB-α, p-IκB-α and NF-κB were assayed in rat liver. As shown in Fig. 7, the protein expression levels of p-IκB-α and NF-κB were upregulated, while that of IκB-α was downregulated in the 0.24 mg kg–1 nano NiO group (p < 0.05), hinting at NF-κB activation. The protein content of p-IκB-α was upregulated in the 0.24 mg kg–1 nano NiO group compared with the 0.24 mg kg–1 micro NiO group (p < 0.05).
Fig. 7. Changes in the p-IκB-α, IκB-α and NF-κB protein levels induced by nano NiO in rat liver. (A) Protein expression levels and (B) semiquantitative analysis of p-IκB-α, IκB-α and NF-κB, n = 5. (C) The protein ratio of p-IκB-α and IκB-α, n = 5. *Significant difference from the control group, p < 0.05. #Significant difference from the micro NiO group, p < 0.05.
Discussion
Studies reported that nano NiO could induce cytotoxicity in HepG2 cells and liver lesions in rats. However the precise and integrated mechanisms were still unclear, so we constructed liver damaged models to explore the role of the NF-κB signaling pathway in liver toxicity, using a method of intratracheal instillation of nano NiO in rats.
The reasons for selecting intratracheal instillation are as follows: (1) We chose intratracheal instillation as the administration method based on the Vasili et al.32 method to construct the liver injury model in rats. (2) The respiratory tract is the main channel of nanoparticle occupational exposure in real conditions. (3) Intratracheal instillation of nanoparticles as an appropriate technique for evaluating possible nanoparticle occupational hazards is a well-established occupational exposure model.33 (4) Nanoparticles can enter the blood circulatory system and be deposited in the liver after entering the body via the respiratory tract.15
Indicators of liver function in serum, namely ALT, AST, ALP and GGT, are commonly used to assess the severity of cellular injury.34 Pari et al.35 found that nickel sulfate could induce liver damage with the increased activity of AST, ALT, ALP, GGT and LDH. Magaye et al.20 reported that nano nickel led to the elevation of ALT, AST, and ALP activity in rat serum. In the present study, we also observed the increased activity of ALT, AST, ALP and GGT (Fig. 1), indicating liver dysfunction was induced by nano NiO.
To further verify the liver toxicity induced by nano NiO, histopathological changes were observed. Magaye et al.20 reported that nano nickel induced lymphocytic infiltration at the periphery and the distorted architecture of the liver parenchyma in rats by HE staining after intravenous injection. Increased numbers of Kupffer cells, binucleated hepatocytes and akaryotic hepatocytes were observed in rat liver after repeated intraperitoneal injections of nano NiO.21 In the present study, the pathological results showed that nano NiO could induce abnormal changes in rat liver tissue including cellular edema, neutrophil and lymphocyte infiltration, hepatic sinus disappearance and sporadic spotty necrosis (Fig. 2). The pathological results indicated that nano NiO could lead to liver lesions.
We detected levels of inflammatory cytokines in rat liver to explore whether the inflammatory response was caused by nano NiO. The pro-inflammatory cytokines TNF-α, IL-1β and IL-6 were mediators in the development of various inflammatory diseases.36 The critical anti-inflammatory cytokines IL-4 and IL-10 could suppress the production of pro-inflammatory cytokines.37 Our previous studies reported that nano NiO could promote the production of cytokine-induced neutrophil chemoattractant 1 (CINC)-1, CINC-2αβ, CINC-3, TNF-α and IL-6 in serum and rat lung tissue, but inhibit the expression of IL-10.7,9 Liu et al.38 reported that nickel sulfate induced an elevation of the protein levels of TNF-α and IL-6 in rat liver. Our results showed that the concentrations of IL-1β and IL-6 increased in rat liver after nano NiO exposure, while the concentrations of IL-4 and IL-10 decreased (Fig. 3). The pro-/anti-inflammatory cytokine imbalance implied that nano NiO could induce an inflammatory response in rat liver.
TNF is involved in physiological immune and inflammatory processes, while its overproduction can lead to tissue damage.39 TNF, as the causative factor in promoting liver injury, has been confirmed to have inflammation interactions with numbers of xenobiotic agents including nanoparticles.40 Our previous studies have discovered a significant increase of TNF-α in serum and in rat lung after nano NiO exposure.7,9 Liu et al. reported that nickel sulfate increased TNF-α protein levels in mice liver.38 Our results showed that TNF-α content increased in nano NiO groups (Fig. 4).
NIK is an important regulator in mediating the TNF-α-induced activation of the NF-κB signaling pathway.29 NIK was kept in low abundance by an ubiquitin-dependent degradation mechanism in normal conditions, but it accumulated after stimulation of the appropriate receptors such as LTRβ (a member of the TNF receptor family).41 Accumulated NIK could phosphorylate and activate IKK-α.27,42 IKK-α, as the central component of the NF-κB signaling pathway, was phosphorylated on serine residues to activate other kinases.43,44 Our previous studies have demonstrated that nano NiO could induce pulmonary damage in rats, with upregulation of the mRNA and protein expression levels of NIK and IKK-α.7 Cui et al.23 reported that nano TiO2 led to upregulation of the TNF-α, TLRs, NIK, IKK-α and IKK-β protein expression levels. Our results showed that nano NiO resulted in upregulation of NIK and IKK-α mRNA levels as well as NIK, IKK-α and p-IKK-α protein content (Fig. 5 and 6), hinting that NIK/IKK-α could be activated by TNF-α.
NF-κB dimers existed in the cytoplasm inactively by combination with an inhibitory IκB subunit.45 Activated IKK-α could induce proteasome mediated degradation and serine phosphorylation of IκB, resulting in the release of active NF-κB that can translocate to the nucleus.28 In the nucleus, NF-κB bonded to gene promoters in their transcriptional regulatory regions, triggering a sequence of physiological or pathological effects such as an inflammatory response.46,47 Our previous studies have found that the activation of the NF-κB signaling pathway played an important role in pulmonary toxicity induced by nano NiO.7 Liu et al.38 reported that nickel sulfate could induce oxidative stress and inflammatory responses in mice liver through TLR4/p38/NF-κB, upregulating the TNF-α and NF-κB protein expression levels. We also observed the reduction of IκB-α mRNA and protein levels but elevation of the p-IκB-α protein expression levels after nano NiO exposure, which further induced the upregulation of the NF-κB mRNA and protein expression levels (Fig. 5 and 7). Our results indicated that the NF-κB signaling pathway was activated by nano NiO via the NIK/IKK-α axis in rat liver.
Due to the larger specific surface area and higher surface reactivity, the nano particles released more ions for intracellular uptake than the micro particles, and caused stronger organ toxicity.48 Our results also showed that nano NiO could induce stronger liver toxicity than micro NiO.
In summary, the results indicated that the NF-κB signaling pathway played an important role in TNF-α mediated liver toxicity after nano NiO exposure in rats. However, the precise and integrated mechanisms of liver toxicity induced by nano NiO should be further verified by in vitro studies.
Conflict of interest
The authors declare that there is no conflict of interest.
Funding
This work was supported by the Fundamental Research Funds for the Central Universities of China (lzujbky-2016-205) and the National Natural Science Foundation of China (81602874).
Supplementary Material
Acknowledgments
We thank Mrs Chunhua Wang for her timely processing of the histopathology slides and Mr Xun Zhang for his help in assaying the histology slides.
Footnotes
†Electronic supplementary information (ESI) available. See DOI: 10.1039/c6tx00444j
References
- Auffan M., Rose J., Bottero J. Y., Lowry G. V., Jolivet J. P., Wiesner M. R. Nat. Nanotechnol. 2009;4(10):634–641. doi: 10.1038/nnano.2009.242. [DOI] [PubMed] [Google Scholar]
- Buzea C., Pacheco I. I., Robbie K. Biointerphases. 2007;2(4):17–71. doi: 10.1116/1.2815690. [DOI] [PubMed] [Google Scholar]
- Gong N., Shao K., Feng W., Lin Z., Liang C., Sun Y. Chemosphere. 2011;83(4):510–516. doi: 10.1016/j.chemosphere.2010.12.059. [DOI] [PubMed] [Google Scholar]
- Magaye R., Gu Y., Wang Y., Su H., Zhou Q., Mao G., Shi H., Yue X., Zou B., Xu J., Zhao J. J. Mol. Histol. 2016;47(3):273–286. doi: 10.1007/s10735-016-9671-6. [DOI] [PubMed] [Google Scholar]
- Horie M., Fukui H., Nishio K., Endoh S., Kato H., Fujita K., Miyauchi A., Nakamura A., Shichiri M., Ishida N., Kinugasa S., Morimoto Y., Niki E., Yoshida Y., Iwahashi H. J. Occup. Health. 2011;53(2):64–74. doi: 10.1539/joh.l10121. [DOI] [PubMed] [Google Scholar]
- Pietruska J. R., Liu X., Smith A., McNeil K., Weston P., Zhitkovich A., Hurt R., Kane A. B. Toxicol. Sci. 2011;124(1):138–148. doi: 10.1093/toxsci/kfr206. [DOI] [PMC free article] [PubMed] [Google Scholar]
- Chang X. H., Zhu A., Liu F. F., Zou L. Y., Su L., Li S., Sun Y. B. Environ. Toxicol. 2016 doi: 10.1002/tox.22329. [DOI] [PubMed] [Google Scholar]
- Chang X. H., Zhu A., Liu F. F., Zou L. Y., Su L., Liu S. K., Zhou H. H., Sun Y. Y., Han A. J., Sun Y. F., Li S., Li J., Sun Y. B. Hum. Exp. Toxicol. 2016 doi: 10.1177/0960327116666650. [DOI] [PubMed] [Google Scholar]
- Zhu A., Chang X. H., Sun Y. B., Zou L. Y., Su L., Sun Y. F., Li S., Liu S. K., Sun Y. Y., Zhou H. H., Li J. J. Nanosci. Nanotechnol. 2017;17(3):1753–1761. [Google Scholar]
- Ada K., Turk M., Oguztuzun S., Kilic M., Demirel M., Tandogan N., Ersayar E., Latif O. Folia Histochem. Cytobiol. 2010;48(4):524–529. doi: 10.2478/v10042-010-0045-8. [DOI] [PubMed] [Google Scholar]
- Ahamed M., Alhadlaq H. A. OncoTargets Ther. 2014;7:269–280. doi: 10.2147/OTT.S58044. [DOI] [PMC free article] [PubMed] [Google Scholar]
- Duan W. X., He M. D., Mao L., Qian F. H., Li Y. M., Pi H., Liu C., Chen C. H., Lu Y. H., Cao Z. W., Zhang L., Yu Z. P., Zhou Z. Toxicol. Appl. Pharmacol. 2015;286(2):80–91. doi: 10.1016/j.taap.2015.03.024. [DOI] [PubMed] [Google Scholar]
- Perez J. E., Contreras M. F., Vilanova E., Felix L. P., Margineanu M. B., Luongo G., Porter A. E., Dunlop I. E., Ravasi T., Kosel J. Nanotoxicology. 2016;10(7):871–880. doi: 10.3109/17435390.2015.1132343. [DOI] [PubMed] [Google Scholar]
- Soleimanpour H., Safari S., Shahsavari Nia K., Sanaie S., Alavian S. M. Hepatitis Mon. 2016;16(4) doi: 10.5812/hepatmon.32636. [DOI] [PMC free article] [PubMed] [Google Scholar]
- Hong J., Zhang Y. Q. Nanotechnology. 2016;27(11) doi: 10.1088/0957-4484/27/11/112001. [DOI] [PubMed] [Google Scholar]
- Ahamed M., Akhtar M. J., Alhadlaq H. A., Khan M. A. M., Alrokayan S. A. Chemosphere. 2015;135:278–288. doi: 10.1016/j.chemosphere.2015.03.079. [DOI] [PubMed] [Google Scholar]
- Ahmad J., Alhadlaq H. A., Siddiqui M. A., Saquib Q., Al-Khedhairy A. A., Musarrat J., Ahamed M. Environ. Toxicol. 2015;30(2):137–148. doi: 10.1002/tox.21879. [DOI] [PubMed] [Google Scholar]
- Al-Qubaisi M. S., Rasedee A., Flaifel M. H., Ahmad S. H., Hussein-Al-Ali S., Hussein M. Z., Eid E. E., Zainal Z., Saeed M., Ilowefah M., Fakurazi S., Mohd Isa N., Zowalaty M. E. Int. J. Nanomed. 2013;8(1):2497–2508. doi: 10.2147/IJN.S42367. [DOI] [PMC free article] [PubMed] [Google Scholar]
- Ahamed M., Ali D., Alhadlaq H. A., Akhtar M. J. Chemosphere. 2013;93(10):2514–2522. doi: 10.1016/j.chemosphere.2013.09.047. [DOI] [PubMed] [Google Scholar]
- Magaye R. R., Yue X., Zou B. Int. J. Nanomed. 2014;9(1):1393–1402. doi: 10.2147/IJN.S56212. [DOI] [PMC free article] [PubMed] [Google Scholar]
- Katsnelson B. A., Minigaliyeva I. A., Panov V. G., Privalova L. I., Varaksin A. N., Gurvich V. B., Sutunkova M. P., Shur V. Y., Shishkina E. V., Valamina I. E., Makeyev O. H. Food Chem. Toxicol. 2015;86:351–364. doi: 10.1016/j.fct.2015.11.012. [DOI] [PubMed] [Google Scholar]
- Auguet T., Vidal F., López-Dupla M., Broch M., Gutiérrez C., Olona M., Oltra C., Aguilar C., González E., Quer J. C., Sirvent J. J., Richart C. Drug Alcohol Depend. 2008;92(1–3):91–99. doi: 10.1016/j.drugalcdep.2007.07.008. [DOI] [PubMed] [Google Scholar]
- Cui Y., Liu H., Zhou M., Duan Y., Li N., Gong X., Hu R., Hong M., Hong F. J. Biomed. Mater. Res., Part A. 2011;96(1):221–229. doi: 10.1002/jbm.a.32976. [DOI] [PubMed] [Google Scholar]
- He C., Yin L., Song Y., Tang C., Yin C. Acta Biomater. 2015;17:98–106. doi: 10.1016/j.actbio.2015.01.041. [DOI] [PubMed] [Google Scholar]
- Walkey C. D., Olsen J. B., Guo H., Emili A., Chan W. C. J. Am. Chem. Soc. 2012;134(4):2139–2147. doi: 10.1021/ja2084338. [DOI] [PubMed] [Google Scholar]
- Senftleben U., Cao Y., Xiao G., Greten F. R., Krähn G., Bonizzi G., Chen Y., Hu Y., Fong A., Sun S. C., Karin M. Science. 2001;293(5534):1495–1499. doi: 10.1126/science.1062677. [DOI] [PubMed] [Google Scholar]
- Sun S. C. Sci. Signaling. 2010;3(123):pe18. doi: 10.1126/scisignal.3123pe18. [DOI] [PMC free article] [PubMed] [Google Scholar]
- Chiba T., Inoko H., Kimura M., Sato T. Biomol. Concepts. 2016;4(2):187–196. doi: 10.1515/bmc-2012-0039. [DOI] [PubMed] [Google Scholar]
- Al-Sadi R., Guo S., Ye D., Mawat R., Ma T. Y. Am. J. Pathol. 2016;186(5):1151–1165. doi: 10.1016/j.ajpath.2015.12.016. [DOI] [PMC free article] [PubMed] [Google Scholar]
- Chen J., Zhang J., Cao J., Xia Z., Gan J. J. Hazard. Mater. 2016;304:370–378. doi: 10.1016/j.jhazmat.2015.11.002. [DOI] [PubMed] [Google Scholar]
- Pfaffl M. W. Nucleic Acids Res. 2001;29(9):2002–2007. doi: 10.1093/nar/29.9.e45. [DOI] [PMC free article] [PubMed] [Google Scholar]
- Vasili A., Sharifi G., Faramarzi M., Noori A., Yazdanshenas S. Gen. Physiol. Biophys. 2016;35(1):35–43. doi: 10.4149/gpb_2015031. [DOI] [PubMed] [Google Scholar]
- Mizuguchi Y., Myojo T., Oyabu T., Hashiba M., Lee B. W., Yamamoto M., Todoroki M., Nishi K., Kadoya C., Ogami A., Morimoto Y., Tanaka I., Shimada M., Uchida K., Endoh S., Nakanishi J. Inhalation Toxicol. 2013;25(1):29–36. doi: 10.3109/08958378.2012.751470. [DOI] [PubMed] [Google Scholar]
- Kunutsor S. K. Liver Int. 2016;36(12):1723–1734. doi: 10.1111/liv.13221. [DOI] [PubMed] [Google Scholar]
- Pari L., Prasath A. Chem.-Biol. Interact. 2008;173(2):77–83. doi: 10.1016/j.cbi.2008.02.010. [DOI] [PubMed] [Google Scholar]
- Khan H. A., Abdelhalim M. A., Alhomida A. S., Al Ayed M. S. Genet. Mol. Res. 2013;12(4):5851–5857. doi: 10.4238/2013.November.22.12. [DOI] [PubMed] [Google Scholar]
- Pachkoria K., Lucena M. I., Crespo E., Ruiz-Cabello F., Lopez-Ortega S., Fernandez M. A., Romero-Gomez M., Madrazo A., Durán J. A., Dios A. M., Borraz Y., Navarro J. M., Andrade R. J. J. Hepatol. 2008;49(1):107–114. doi: 10.1016/j.jhep.2008.03.017. [DOI] [PubMed] [Google Scholar]
- Liu C. M., Zheng G. H., Ming Q. L., Chao C., Sun J. M. J. Agric. Food Chem. 2013;61(5):1146–1154. doi: 10.1021/jf304562b. [DOI] [PubMed] [Google Scholar]
- Chen C. Y., Huang Y. L., Lin T. H. Arch. Biochem. Biophys. 1998;356(2):127–132. doi: 10.1006/abbi.1998.0761. [DOI] [PubMed] [Google Scholar]
- Tukov F. F., Luyendyk J. P., Ganey P. E., Roth R. A. Toxicol. Sci. 2007;100(1):267–280. doi: 10.1093/toxsci/kfm209. [DOI] [PubMed] [Google Scholar]
- Yin L., Wu L., Wesche H., Arthur C. D., White J. M., Goeddel D. V., Schreiber R. D. Science. 2001;291(5511):2162–2165. doi: 10.1126/science.1058453. [DOI] [PubMed] [Google Scholar]
- Razani B., Zarnegar B., Ytterberg A. J., Shiba T., Dempsey P. W., Ware C. F., Loo J. A., Cheng G. Sci. Signaling. 2010;3(123):ra41. doi: 10.1126/scisignal.2000778. [DOI] [PMC free article] [PubMed] [Google Scholar]
- Israël A. Cold Spring Harbor Perspect. Biol. 2010;2(3):a000158. doi: 10.1101/cshperspect.a000158. [DOI] [PMC free article] [PubMed] [Google Scholar]
- Polley S., Passos D. O., Huang D. B., Mulero M. C., Mazumder A., Biswas T., Verma I. M., Lyumkis D., Ghosh G. Cell Rep. 2016;17(8):1907–1914. doi: 10.1016/j.celrep.2016.10.067. [DOI] [PMC free article] [PubMed] [Google Scholar]
- Li Q., Van Antwerp D., Mercurio F., Lee K. F., Verma I. M. Science. 1999;45(2):170–171. doi: 10.1126/science.284.5412.321. [DOI] [PubMed] [Google Scholar]
- Kabe Y., Ando K., Hirao S., Yoshida M., Handa H. Antioxid. Redox Signaling. 2005;7(3–4):395–403. doi: 10.1089/ars.2005.7.395. [DOI] [PubMed] [Google Scholar]
- Ren Y. X., Yang J., Sun R. M., Zhang L. J., Zhao L. F., Li B. Z., Li L., Long H. T., Sun Q. M., Huang Y. C., Li X. J. Cytotechnology. 2016;68(6):2625–2636. doi: 10.1007/s10616-016-9987-9. [DOI] [PMC free article] [PubMed] [Google Scholar]
- Pietroiusti A., Campagnolo L., Fadeel B. Small. 2013;9(9–10):1557–1572. doi: 10.1002/smll.201201463. [DOI] [PubMed] [Google Scholar]
Associated Data
This section collects any data citations, data availability statements, or supplementary materials included in this article.


