

Abstract
Given the crucial role of DNA damage in human health and disease, it is important to be able to accurately measure both mitochondrial (mtDNA) and nuclear (nDNA) damage. In this unit, we describe a method based on a long-amplicon quantitative PCR-based assay; the main strength of the assay is that a separate mitochondrial isolation is not necessary, which can often be labor-intensive and artifact generating. Here, we present a detailed protocol of the QPCR-based assay that we have newly revised with particular attention to application in Homo sapiens, Rattus norvegicus, and Caenorhabditis elegans, due to changes in availability of PCR reagents. We also describe optimized extraction protocols for high-quality DNA from multiple rat tissues for which these procedures had not previously been described.
Keywords: mitochondrial DNA damage, nuclear DNA damage, Parkinson’s disease, neurodegeneration, QPCR-based assay
INTRODUCTION
The genomes (both nuclear and mitochondrial) of all organisms are constantly being bombarded by endogenous and exogenous sources that can damage DNA. While numerous DNA repair mechanisms in the cell are devoted to protect against DNA damage, damaged DNA can either evade repair or be produced beyond the DNA repair machinery’s capacity, such as under oxidative stress conditions (Friedberg, 2006). Persistent or unrepaired DNA damage may lead to mutagenesis and genome instability. DNA damage has been implicated in cancer, mitochondrial diseases, aging and age-related diseases, in particular Parkinson’s disease (PD) (Haugen et al., 2010; Howlett et al., 2017; Sanders & Greenamyre, 2013; Sanders, Howlett, McCoy, & Greenamyre, 2014; Sanders, Laganiere, et al., 2014; Sanders, McCoy, et al., 2014; Sanders et al., 2017; Wolters & Schumacher, 2013). Given the crucial role of DNA damage in human health and disease, it is important to be able to accurately measure both mitochondrial (mtDNA) and nuclear (nDNA) damage.
Advances in liquid chromatography/mass spectrometry techniques and repair enzyme-based assays have proven useful in detection of specific DNA modifications (C. Gonzalez-Hunt, Wadha, M. and Sanders, L.H., 2018). However, these aforementioned methodologies are limited in detection of mtDNA damage. In general, assaying mtDNA damage is technically challenging due to the small fraction that mtDNA represents of the total cellular DNA. In addition, care must be taken to avoid artifactual oxidation during mitochondrial isolation procedures leading to artificially higher levels (Maynard, de Souza-Pinto, Scheibye-Knudsen, & Bohr, 2010). One method to measure both mtDNA and nDNA damage and repair in the same biological sample is the long-amplicon quantitative polymerase chain reaction (QPCR)-based assay (Kalinowski, Illenye, & Van Houten, 1992; Salazar & Van Houten, 1997; Yakes & Van Houten, 1997). The QPCR-based assay has been adapted to mammalian and non-mammalian models or systems (Meyer, 2010), highlighting the broad utility of this method. The principle behind the QPCR-based assay, as well as the advantages and limitations to this assay has been previously discussed extensively (Meyer, 2010). Inconveniently, the DNA polymerase (GeneAmp XL) that had been optimized for the QPCR-based assay, which was available through Life Technologies, was discontinued. Therefore, our goal was to identify new DNA polymerases that are compatible to use in the QPCR-based assay with multiple species, in order to maximize utility and minimize cost. Below, we provide detailed protocols for the QPCR-based assay described with new readily available DNA polymerases.
BASIC PROTOCOL 1
QUANTITATIVE PCR-BASED ASSAY
The revised protocol described here using the KAPA LongRange Hot Start DNA polymerase was optimized for human and rat samples. Other DNA polymerases were tested for their utility in this QPCR-based assay, and we chose the KAPA LongRange Hot Start DNA polymerase for its ability to work with several species. For Caenorhabditis elegans samples, we suggest the New England Biolabs LongAmp Hot Start Master Mix.
Materials
KAPA Long Range Hot Start DNA Polymerase Kit (KAPABiosystems) or New England Biolabs LongAmp Hot Start Master Mix for C. elegans.
Primers, species- and target genome-specific (we typically purchase from Integrated DNA Technologies); primer sequences and annealing temperatures are available in (C. P. Gonzalez-Hunt et al., 2016)
Bovine Serum Albumin (BSA; Gemini Bio Products)
Nuclease Free Water (e.g., Sigma-Aldrich W4502-1L)
High-quality thermal cycler (we use the Biometra T1)
0.2 mL PCR tubes (individual tubes, strips, or sealed PCR plates are acceptable)
PCR hood (we use the CBS SCIENTIFIC P-048-202 PCR Workstation) with germicidal (ultraviolet with peak emission at 254 nm) lamp for sterilization
Dedicated pipettes and sterile aerosol barrier pipet tips; pipettors are regularly swabbed with ethanol, stored in the PCR hood, and sterilized with the UV lamp prior to each use; tips are purchased sterile
Protocol Steps
- Make a master mix if several samples are being run simultaneously. Use the KAPA LongRange Hot Start kit and add the following components in this order:
- Nuclease-free H2O (for a final volume of 50 μL)
- 15 ng sample DNA with final target template DNA concentration of 3 ng/μL (typically, it is possible to reduce this to as low as 5 ng input (concentration of 1 ng/μL), especially if you have a PCR-based absolute measure of mitochondrial and nuclear DNA copy number for normalization purposes)
- 10 μL of 5X buffer solution
- 1 μL of BSA in nuclease-free H2O (1.0 mg/mL stock)
- 1 μL of dNTPs (10 mM stock)
- 2.5 μL of each primer working solution (10 μM stock)
- 3.5 μL of MgCl2 (25 mM stock supplied in kit)
If using C. elegans lysate as template, we recommend the New England Biolabs Long Amp Hot Start Master Mix Kit in place of the KAPA LongRange Hot Start Kit. PCR reactions are assembled as follows, and a master mix can be made if multiple samples are run simultaneously:
5 μL nematode lysate
25 μL LongAmp 2x Master Mix
2 μL each primer (10 μM stocks, 0.4 μM final concentration)
16 μL sterile molecular biology grade water
Primers that amplify specific mitochondrial and nuclear PCR products have been well described for multiple species (C. P. Gonzalez-Hunt et al., 2016) however, all PCR reactions should be quality-checked and, if necessary, optimized when first employed with any new reagents, and with new thermocyclers.
-
2. Briefly (1-2 seconds) vortex and spin (~5 seconds, using a mini-centrifuge) the master mix, and aliquot 25 μL into the appropriate number of PCR reaction tubes (or wells of a PCR plate).
Include control reactions of a “50% control” that contain control DNA that is diluted 1:1 with H2O. “Control DNA” refers here to one or more of the samples that is expected to amplify well (e.g., cells not exposed to a toxicant in an experiment), and therefore serves to ascertain that even the samples that amplify best are not exceeding the log-linear range of the assay. To ensure there is no contamination, a “no template control” that does not include template DNA and instead H2O should be included in the run. The appropriate cycle number, which is when “50% control” reaction results in 40% - 60% of the PCR product of the undiluted control reaction, indicating a reaction that is in the log-linear phase of amplification, must be determined with each experiment. 40%-60%, rather than a strict 50%, is used to allow for pipetting error and other technical sources of variability between reactions. The appropriate cycle number will be influenced by many factors, including amount of starting template; good starting points can be found (Meyer, 2010).
- 3. The PCR amplification profile is as follows for the large mitochondrial PCR product using the KAPA LongRange Hot Start kit:
- Melting: 94 °C for 3 min
- Amplification: the optimized number of cycles (26 - 28) of melting (94 °C for 15 sec) and annealing (66 °C for 12 min).
- Final extension: To complete the profile and finalize amplification of products, perform a final extension for 10 min at 72 °C.
- Holding: Hold at 4 °C until products are removed for quantification. If the post-amplification holding step will be performed overnight, or for other reasons the samples are likely to sit in the thermocycler for an extended period of time, it is preferable to hold at 8 °C, as this temperature puts less strain on the thermocycler.
The PCR amplification profile for the nuclear PCR product is as follows: 94 °C for 3 min, followed by the optimized number of cycles (26 - 28) of 94 °C for 15 sec, annealing temperature (68 °C) for 10 min. To complete the profile, perform a final extension for 10 min at 72 °C, then hold at 4 °C until products are removed for quantification. For the small mitochondrial PCR product the PCR amplification profile is: 94 °C for 1 min, followed by the optimized number of cycles (~20) of 94 °C for 15 sec, annealing temperature (60°C) for 45 sec, 72 °C for 45 sec. To complete the profile, perform a final extension for 10 min at 72 °C, then hold at 4 °C until products are removed for quantification.
-
4. The PCR amplification profile is as follows for the nuclear fragment PCR product using the KAPA LongRange Hot Start kit: 94 °C for 3 min, followed by the optimized number of cycles of 94 °C for 15 sec, annealing temperature (66 - 68°C) for 45 sec, and 72 °C for 45 sec. To complete the profile perform a final extension for 10 min at 72 °C.
The PCR amplification profile for the NEB LongAmp Master Mix kit is as follows: 94 °C for 2 min, followed by the optimized number of cycles of 94 °C for 30 sec and 64 °C for 11 min and 30 sec, and then a final extension of 72 °C for 10 min.
The PCR primers previously published (C. P. Gonzalez-Hunt et al., 2016) have been tested and verified to result in a single, specific, PCR product. However, when first optimizing the assay, it is recommended to check the specificity of the PCR products on an agarose gel, as conditions may vary slightly based on laboratory equipment and PCR kits used. It is critical to obtain a single product to ensure accurate quantification in step 6. If new PCR primers are desired, follow the recommendations described here (Meyer, 2010).
Quantify the resulting PCR products
PCR products are quantified using the same materials as for quantification of the template DNA is quantified (Support Protocol 2).
5. Add 10 μL of each PCR product and 90 μL of TE buffer to each of triplicate wells. This amount may be adjusted to ensure that readings are well within the standard curve (we often use 5 μL), but the amount pipetted should not be so low as to significantly increase pipetting error (e.g., 1 μL).
6. Add 100 μL PicoGreen working solution to each well and incubate at room temperature in the dark for 10 min. Follow steps 6, 7 and 8 in Support Protocol 2 for fluorescent quantification of DNA.
Data analysis
7. After obtaining the fluorescence values from the plate reader software, subtract the no template control values and/or background fluorescence from PCR product values.
8. Average all sample values of the triplicate wells. If the “50% control” does not fall within 40% - 60% of the untreated controls, this data set is invalid and cycle number should be adjusted.
-
9. Normalize large mitochondrial PCR product fluorescence values for copy number differences using the small mitochondrial PCR product. To normalize, divide each sample’s small mitochondrial product value by the average of all small mitochondrial products to get a correction factor for each sample. Then, divide each sample’s large mitochondrial value by its correction factor. This is the normalized large mitochondrial fluorescence value (A. M. Furda, Bess, Meyer, & Van Houten, 2012a). Normalization for nuclear DNA damage is unnecessary if starting with PicoGreen-quantified total template DNA: since total DNA is dominated by nuclear DNA, template nDNA will be the same across samples. If using worm lysate (in which starting template DNA is not quantified), amplification of the large nuclear product may be normalized to amplification of a small nuclear fragment using the same procedure described above.
Alternatively, real-time PCR-derived mtDNA and nDNA copy number values can be used for normalization; see reference (Rooney et al., 2015) for real-time PCR protocol. Differences in mtDNA copy number between samples or treatments can obscure results, as it changes the amount of template DNA for the reaction. Additionally, large nuclear PCR product values from the small C. elegans lysate protocol must also be normalized, as the DNA is not quantified prior to the PCR reaction.
10. Divide the normalized fluorescence values of each sample by the average normalized fluorescence value to get a ratio.
-
11. Perform the negative natural log (-ln) of the ratio to obtain the lesion frequency per fragment. This value is normalized to the number of lesions/10kb. Examples of this calculation can be found in (C. P. Gonzalez-Hunt et al., 2016).
At least three biological samples should be analyzed per condition, with at least three separate QPCR runs to calculate the average lesion frequency.
SUPPORT PROTOCOL 1
DNA EXTRACTION FROM CELLS AND TISSUE OF MULTIPLE SPECIES
DNA integrity, which includes both purity and intact high molecular weight DNA are both crucial to the reliable amplification of long PCR targets. While the genomic tip protocol is described here within, other DNA isolation procedures will work for this QPCR-based assay as well, as long as the size of isolated DNA is on average >10kb. Phenol extraction should be avoided to prevent potential artifactual oxidation (Maynard et al., 2010).
Materials
QIAGEN Buffer G2, Buffer QBT, Buffer QC, Buffer QF, Buffer EB
Isolation Buffer I (recipe detailed below)
Isolation Buffer II (recipe detailed below)
Proteinase K (QIAGEN)
RNAse A (QIAGEN)
70% Ethanol (v/v)
Isopropanol (Sigma)
QIAGEN Buffer C1 (cat # 19060; only available as part of the Genomic DNA Buffer Set) (Primary neuroprogenitor cells and neurons, Rat blood)
1x PCR Lysis Buffer (C. elegans lysate)
QIAGEN Genomic Tips G/20, G/100 or G/500
15 mL or 50 mL conical tubes (Corning)
1.5 mL microcentrifuge tubes (VWR)
Water bath at 50°C (Fisher)
Refrigerated microcentrifuge (we use an Eppendorf 5417C in a cold room at 4 °C)
Glass pestle (Kimble-Chase Kontes Tissue Grinder Pestle A and B with small and large clearance) (Brain tissue)
QIAGEN TissueRuptor (120V, 60Hz) (Rat muscle)
QIAGEN TissueRuptor Disposable Probes (Rat muscle)
Vacutainer with anti-coagulant (Rat blood, BD Microtainer 02-669-38)
Platinum worm pick (C. elegans lysate)
Brain Tissue
This protocol is used for DNA extraction of rat or mouse brain tissue. Use the Qiagen G/20 Tips if extracting from < 20 mg tissue, and G/100 or G/500 for larger tissue samples, <100 mg and <400 mg tissue, respectively.
-
Collect ~10 mg - 400 mg mouse or rat brain tissue. Tissue may be flash frozen in liquid nitrogen and stored at −80°C.
Animal use must be ethically approved by your research institution.
Place brain tissue in a microcentrifuge tube with 500 μL of Isolation Buffer I for 10 minutes on ice. Volumes may be adjusted according to starting tissue sample size.
Add an equal volume of Isolation Buffer II (i.e. 500 μL).
Homogenize the tissue using a glass pestle until the homogenate is cloudy and free of any particulates.
Centrifuge at 10,000 × g for 20 min, at 4 °C and then proceed with the genomic tip protocol.
Primary neuroprogenitor cells and neurons
This protocol was optimized for rat primary neuronal cultures and human induced pluripotent stem cell (iPSC)-derived neuroprogenitor cells or neurons (Sanders, Laganiere, et al., 2014; Sanders, McCoy, et al., 2014). We recommend starting with at least 2.5 × 10⁶ cells.
Centrifuge cells for 10 min at 1500 × g at 4 °C to pellet in a centrifuge tube.
Add 1 volume of Buffer C1 and 3 volumes of cold distilled water to cell pellet. Incubate for 10 minutes on ice. For 5 × 10⁶ cells we use 1 mL of Buffer C1 and 3 mL of cold distilled water. Volumes may be adjusted depending of the amount of cells, as long as the 1:3 ratio is maintained.
Centrifuge samples at 10,000 × g for 20 minutes at 4 °C. Proceed with genomic tip protocol.
Cell lines
DNA from cultured cells can be used in the QPCR-based assay. The assay has been tested in lymphoblastoid cells and HeLa cells, and we predict most cells lines are compatible. A minimum of 2.5 × 10⁶ and no more than 5.0 × 10⁶ cells should be used with the Qiagen G/20 tips. For larger amounts of cells, follow the genomic-tip G/100 or G/500 protocol.
Resuspend cell lines in Isolation Buffer I (500 μL) for 10 minutes on ice, and then add equal volume of Isolation Buffer II (500 μL).
-
Centrifuge samples at 10,000 × g for 20 minutes at 4 °C. Proceed with genomic tip protocol.
Do not attempt homogenization using either a mechanical or manual homogenizer, this will only result in fragmented mitochondrial DNA.
Rat muscle
Muscle is especially difficult to homogenize and extract DNA. This protocol was optimized for rat skeletal muscle (gracilis), but may be applicable to other types of muscle tissue.
Place tissue sample in Isolation Buffer 1 (500 μL) for 10 minutes on ice and then add equal volume of Isolation Buffer II (500 μL).
Homogenize the tissue with the Qiagen TissueRuptor (120V, 60Hz) paired with the QIAGEN TissueRuptor Disposable Probes. If the muscle needs further homogenization, use the Kimble-Chase Kontes Tissue Grinder Pestle A and B with small and large clearance.
Centrifuge samples at 10,000 × g for 20 minutes at 4 °C. Proceed with genomic tip protocol.
Rat blood
This protocol was developed for use of rat blood, but it may apply to blood from other animals, including human blood samples. Circulating blood should be procured in a vacutainer that contains an anti-coagulant and processed within 2 hours at room temperature.
-
Vortex the whole blood sample and transfer it, avoiding clots, into a 15 mL conical tube.
Collect blood into a vacutainer that contains an anti-coagulant, such as sodium citrate, to avoid clotting problems. Do not use EDTA in particular, as it will interfere with the PCR reaction. Blood can be stored up to five days at 4 °C without the loss of DNA yield.
Add 1 volume of Buffer C1 (Qiagen catalogue # 19060; only available as part of the Genomic DNA Buffer Set) and 3 volumes of cold distilled water to cell pellet.
Mix by inverting the tube until sample becomes translucent. Incubate on ice for 20 min. Centrifuge samples at 10,000 × g for 20 minutes at 4 °C. Proceed with genomic tip protocol.
-
Decant supernatant. A small white pellet will remain.
An additional rinse with Buffer C1 and distilled water and 20-min centrifugation can be done if the pellet is not white or has noticeable residual debris and hemoglobin present before proceeding with genomic tip protocol.
C. elegans
This protocol was developed (Meyer et al., 2007) to permit extraction of total DNA from large batches of nematodes; major advantages of this approach are the ability to obtain larger amounts of DNA, and the ability to quantify and test the molecular weight of the extracted DNA via gel electrophoresis. Recent changes are described in more detail in (C. P. Gonzalez-Hunt et al., 2016). To lyse large numbers of C. elegans, wash nematodes off plates and centrifuge at 2,200 × g for 2 min to pellet.
Remove supernatant, and resuspend nematodes in residual volume of media.
Using a glass Pasteur pipette, drip into liquid nitrogen to create frozen pellets (can be stored at −80 °C).
3. Grind frozen pellets in a liquid nitrogen chilled mortar and pestle.
4. Scoop the resulting powder into pre-aliquoted buffer G2 (2 mLs) with 4 μL RNase A (100 mg/mL; Qiagen). Vortex briefly and add 100 μL proteinase K (>600 mAU/mL; 20 μg/μL; Qiagen). Vortex for 5 seconds and incubate at 50º C for at least 2 hours, and thereafter follow the Qiagen 20/G Genomic Tips Tissue protocol for DNA isolation (Rooney et al., 2015). Additional detail is provided in (Meyer, 2010).
C. elegans lysate (small number, direct-use)
This protocol was developed (Boyd et al., 2010) to permit extraction of total DNA from small numbers of nematodes, or even single nematodes; major advantages of this approach are the ability to analyze inter-individual variability in DNA damage, and perform experiments with far fewer animals.
Using a platinum worm pick, transfer six worms into 90 μL of 1x PCR-Lysis buffer pre-aliquoted into PCR tubes. This amount can be scaled (e.g., one worm into 15 μL), and the ratio of worm number to μL lysis buffer may be decreased in the case of very small (e.g., first larval stage) worms if desired.
Freeze on dry ice or at -80 °C immediately. Keep samples frozen for at least 10 min before proceeding.
Thaw, briefly (1-2 seconds) vortex and spin (~5 seconds, using a mini-centrifuge).
-
Heat in a thermal cycler at 65 °C for 1 hour, followed by 95 °C for 15 minutes.
This lysate can be used as PCR template without quantification, however, both mitochondrial and nuclear copy numbers must be measured with short PCR products to normalize for differences in genome copy numbers(A. M. Furda et al., 2012a; Rooney et al., 2015).
SUPPORT PROTOCOL 2
QUANTIFICATION OF TEMPLATE DNA
Materials
Quant-iT PicoGreen dsDNA reagent (Life Technologies)
1X Tris-EDTA (TE), pH 7.5
λ (Lambda) DNA/Hind III Fragments (Invitrogen)
NanoDrop Spectrophotometer (Thermo Scientific) or similar instrument
96 well plate, NUNC, no lid, non-sterile, flat, white or black (Thermo Scientific)
A fluorescence reader capable of measuring fluorescence with 485 nm excitation and 530 nm emission (SpectraMax Plate Reader, Molecular Devices)
0.5 mL autoclaved microcentrifuge tubes (to dilute DNA for PicoGreen reads)
0.6% agarose gel for large mitochondrial and nuclear PCR products
1.5% agarose gel for small mtDNA PCR product
-
Evaluate purity of sample DNA on a NanoDrop spectrophotometer or instrument equivalent. To evaluate purity, measure the absorbance of 1 μL- 2 μL sample DNA after calibrating the instrument with a blank sample, the buffer the sample DNA was eluted in.
Samples should have a A260/A280 ratio between 1.7 - 1.9, indicating relatively pure DNA. DNA samples that are of at least 10 ng/μL are acceptable, although a higher DNA concentration yield is preferable.
-
Prepare a DNA concentration standard curve by diluting λ/HindIII DNA. We typically use final concentrations of 50 ng/μL, 20 ng/μL, 15 ng/μL, 12.5 ng/μL, 10 ng/μL, 7.5 ng/μL, 5.0 ng/μL, 2.0 ng/μL, 1.0 ng/μL, 0.5 ng/μL and 0 ng/μL in TE buffer.
The concentrations of DNA dilutions are suitable for our particular spectrometer; depending on the sensitivity of the instrument, either add lower or higher concentrations of DNA dilutions. Ensure that the curve remains linear (i.e., is not compromised by limit of detection at low, or saturation at high, concentrations), and that samples fall within the curve.
Add 5 μL of each Lambda/Hind III standard and 95 μL 1x TE into triplicate wells.
-
Quantify sample DNA prior to PCR-based assay analysis. Depending on the NanoDrop DNA concentration values, dilute DNA samples in 1x TE so that all template DNA concentrations are ~10 ng/μL after dilution.
The goal is to obtain a precise quantification of DNA of approximately 10 ng/μL, prior to the final dilution. PicoGreen-based quantification is more precise than NanoDrop, due to the specificity of PicoGreen to measuring double-stranded DNA. To reduce pipetting error in the final dilution step, it is best to ensure that the penultimate template DNA concentrations are no higher than 10 - 15 ng/μL.
Add 5 μL of DNA and 95 μL of 1x TE buffer into triplicate wells in a 96 well plate.
-
Prepare PicoGreen working solution (100 μL of working solution needed per well) by adding 5 μL PicoGreen reagent per 1 mL TE buffer.
PicoGreen dye is sensitive to light. Prepare stock and working solutions in low light.
Add 100 μL PicoGreen working solution to each well, and incubate at room temperature in the dark for 10 min.
-
Measure the fluorescence of each sample with excitation at 485 nm and emission at 530 nm.
For SpectraMax spectrophotometer, use sensitivity 12 setting.
Determine DNA sample concentrations by comparing fluorescence values to those of the standard curve. If the DNA concentrations are above 15 ng/μL, re-dilute the DNA and measure again.
Based on the precisely measured concentration obtained in the last quantification, dilute the sample to 3 ng/μL in TE buffer.
REAGENTS AND SOLUTIONS
Isolation Buffer I
80 mM Sucrose
1 mM EDTA
10 mM HEPES-K-Salt
pH 7.4
Isolation Buffer II
300 mM Sucrose
1 mM EDTA
10 mM HEPES-K-Salt
pH 7.4
PCR-Lysis buffer (3.3X)
82.5 mM Tricine
264 mM KoAc
36.2% (w/v) Glycerol
7.425% (v/v) DMSO
16.95 mL nuclease-free water
Store at −20 °C indefinitely.
- Prepare for worm lysis:
- 65% nuclease-free water
- 30% lysis buffer
- 5% Proteinase K (for a final concentration of 1 μg/mL)
COMMENTARY
Background Information
The QPCR-based assay has been used for over 20 years to investigate DNA damage in multiple species and organisms (Ayala-Torres, Chen, Svoboda, Rosenblatt, & Van Houten, 2000). In brief, the principle behind this assay is that when the DNA polymerase encounters DNA damage (lesion), it is blocked and cannot replicate past it. Therefore, in an undamaged template PCR amplification will not be inhibited, while in a damaged template, the polymerase will be stalled by lesions and consequently result in less amplification. The advantages and disadvantages of this methodology have been described in great detail (A. M. Furda, Bess, Meyer, & Van Houten, 2012b; Hunter, Jung, Di Giulio, & Meyer, 2010).
Since the initial report of the QPCR-based assay, (Kalinowski et al., 1992) the DNA polymerase (GeneAmp XL) available through Life Technologies has been used. When this DNA polymerase was discontinued from being sold, it was crucial to identify a new DNA polymerase that would be compatible with the QPCR-based assay. While many different DNA polymerases were evaluated, we have identified the KAPA LongRange Hot Start DNA polymerase and the New England Biolabs LongAmp Hot Start Master Mix to work with rat and human, and C. elegans, respectively.
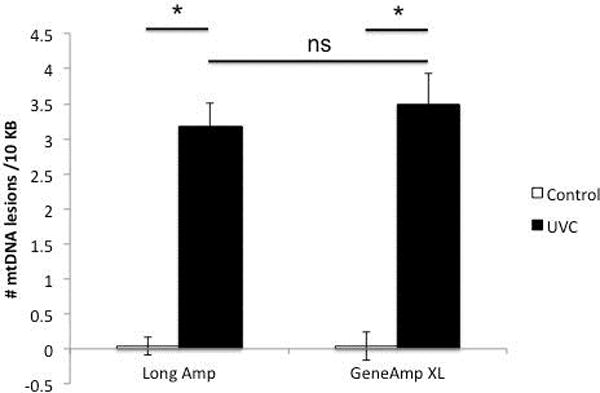
Recent studies have implicated an important role for mtDNA damage in Parkinson’s disease, the most common movement neurodegenerative disorder (Sanders, Howlett, et al., 2014; Sanders, McCoy, et al., 2014). Representative data investigating mtDNA damage in a toxin-based rat in vitro Parkinson’s disease model is shown in (Figure 1). Note that mtDNA damage levels are identical whether the newly described DNA polymerase (KAPA LongRange Hot Start DNA Polymerase) or the former (GeneAmp XL DNA polymerase) was used. Representative data from C. elegans exposed to ultraviolet C radiation is shown in (Figure 2); C. elegans has also been used to study the relationship between mtDNA damage and dopaminergic neurodegeneration (C. P. Gonzalez-Hunt et al., 2014). Mitochondrial DNA lesions are identical whether using the NEB Long Amp Master Mix kit or the former GeneAmp XL kit.
Figure 1.
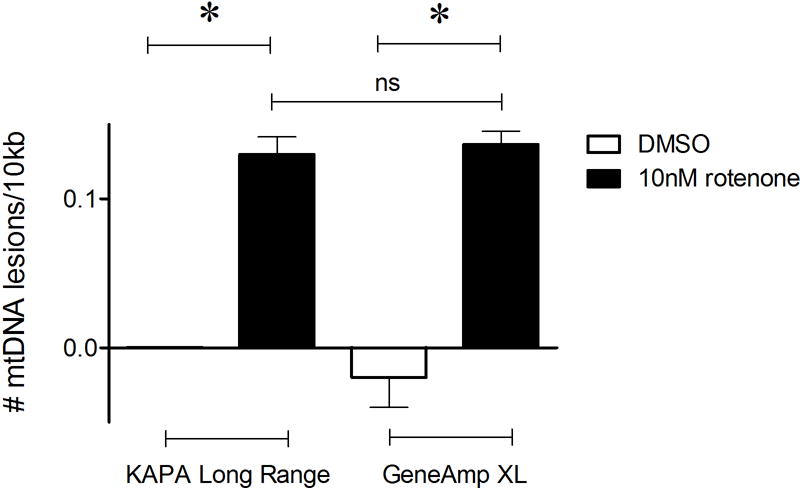
Figure 2.
Critical Parameters
There are many critical parameters that contribute to the success of implementing this protocol. First and foremost, the DNA must be high molecular weight, intact DNA that has not been sheared or damaged in any way. Though many DNA extraction protocols exist that are suitable for the QPCR-based assay, we recommend the QIAGEN Tip Protocol described here or the QIACube process (A. Furda, Santos, Meyer, & Van Houten, 2014). Of note, phenol/chloroform-based extraction methods should be avoided due to artificial oxidation. These and other critical parameters are fully described by Gonzales-Hunt et al. (C. P. Gonzalez-Hunt et al., 2016).
Troubleshooting
One of the most common problems encountered in executing this protocol is non-specific amplification of other products. Thus, it always imperative to run final PCR products on an agarose gel to verify specific PCR amplification. The particular problem of non-specific amplification would suggest that cycle number or PCR parameters need to be further optimized and suggestions can be found in (A. M. Furda et al., 2012b; Hunter et al., 2010).
Time Considerations
Revising the protocol with different DNA polymerases has not changed the overall time-frame to complete the QPCR-based assay. As previously reported, the DNA purification can take up to a couple of days, quantifying the DNA one to two hours and setting up the PCR reaction an hour or so.
Significance Statement.
DNA damage is any modification to the structure of DNA that alters its coding properties and/or interferes with cell metabolism, such as DNA replication or transcription. Accurate measurement is crucial to understand the causes and consequences of DNA damage. The long-amplicon quantitative PCR-based assay described here within allows investigation into both endogenous and exogenous sources of DNA damage.
Acknowledgments
This work was supported by the NIH (R01ES028218 and P42ES010356), the DoD (GW150184) and the William N. & Bernice E. Bumpus Foundation.
Footnotes
CONFLICTS OF INTEREST
The authors declare that there are no conflicts of interest.
LITERATURE CITED
- Ayala-Torres S, Chen Y, Svoboda T, Rosenblatt J, Van Houten B. Analysis of gene-specific DNA damage and repair using quantitative polymerase chain reaction. Methods. 2000;22(2):135–147. doi: 10.1006/meth.2000.1054. [DOI] [PubMed] [Google Scholar]
- Boyd WA, Crocker TL, Rodriguez AM, Leung MC, Lehmann DW, Freedman JH, Meyer JN. Nucleotide excision repair genes are expressed at low levels and are not detectably inducible in Caenorhabditis elegans somatic tissues, but their function is required for normal adult life after UVC exposure. Mutat Res. 2010;683(1-2):57–67. doi: 10.1016/j.mrfmmm.2009.10.008. [DOI] [PMC free article] [PubMed] [Google Scholar]
- Friedberg ECW, Siede GC, Walker GC, Wood RD, Schultz RA, Ellenberger T. DNA Repair And Mutagenesis. 2. Amer Society for Microbiology; 2006. [Google Scholar]
- Furda A, Santos JH, Meyer JN, Van Houten B. Quantitative PCR-based measurement of nuclear and mitochondrial DNA damage and repair in mammalian cells. Methods Mol Biol. 2014;1105:419–437. doi: 10.1007/978-1-62703-739-6_31. [DOI] [PMC free article] [PubMed] [Google Scholar]
- Furda AM, Bess AS, Meyer JN, Van Houten B. Analysis of DNA damage and repair in nuclear and mitochondrial DNA of animal cells using quantitative PCR. Methods in molecular biology. 2012a;920:111–132. doi: 10.1007/978-1-61779-998-3_9. [DOI] [PMC free article] [PubMed] [Google Scholar]
- Furda AM, Bess AS, Meyer JN, Van Houten B. Analysis of DNA damage and repair in nuclear and mitochondrial DNA of animal cells using quantitative PCR. Methods Mol Biol. 2012b;920:111–132. doi: 10.1007/978-1-61779-998-3_9. [DOI] [PMC free article] [PubMed] [Google Scholar]
- Gonzalez-Hunt C, Wadha M, Sanders LH. DNA damage by oxidative stress: Measurement strategies for two genomes. Current Opinion in Toxicology. 2018;7:87–94. [Google Scholar]
- Gonzalez-Hunt CP, Leung MC, Bodhicharla RK, McKeever MG, Arrant AE, Margillo KM, Meyer JN. Exposure to mitochondrial genotoxins and dopaminergic neurodegeneration in Caenorhabditis elegans. PLoS One. 2014;9(12):e114459. doi: 10.1371/journal.pone.0114459. [DOI] [PMC free article] [PubMed] [Google Scholar]
- Gonzalez-Hunt CP, Rooney JP, Ryde IT, Anbalagan C, Joglekar R, Meyer JN. PCR-Based Analysis of Mitochondrial DNA Copy Number, Mitochondrial DNA Damage, and Nuclear DNA Damage. Curr Protoc Toxicol. 2016;67:20 11 21–20 11 25. doi: 10.1002/0471140856.tx2011s67. [DOI] [PMC free article] [PubMed] [Google Scholar]
- Haugen AC, Di Prospero NA, Parker JS, Fannin RD, Chou J, Meyer JN, Van Houten B. Altered gene expression and DNA damage in peripheral blood cells from Friedreich's ataxia patients: cellular model of pathology. PLoS Genet. 2010;6(1):e1000812. doi: 10.1371/journal.pgen.1000812. [DOI] [PMC free article] [PubMed] [Google Scholar]
- Howlett EH, Jensen N, Belmonte F, Zafar F, Hu X, Kluss J, Sanders LH. LRRK2 G2019S-induced mitochondrial DNA damage is LRRK2 kinase dependent and inhibition restores mtDNA integrity in Parkinson’s disease. Hum Mol Genet. 2017 doi: 10.1093/hmg/ddx320. [DOI] [PMC free article] [PubMed] [Google Scholar]
- Hunter SE, Jung D, Di Giulio RT, Meyer JN. The QPCR assay for analysis of mitochondrial DNA damage, repair, and relative copy number. Methods. 2010;51(4):444–451. doi: 10.1016/j.ymeth.2010.01.033. [DOI] [PMC free article] [PubMed] [Google Scholar]
- Kalinowski DP, Illenye S, Van Houten B. Analysis of DNA damage and repair in murine leukemia L1210 cells using a quantitative polymerase chain reaction assay. Nucleic Acids Res. 1992;20(13):3485–3494. doi: 10.1093/nar/20.13.3485. [DOI] [PMC free article] [PubMed] [Google Scholar]
- Maynard S, de Souza-Pinto NC, Scheibye-Knudsen M, Bohr VA. Mitochondrial base excision repair assays. Methods. 2010;51(4):416–425. doi: 10.1016/j.ymeth.2010.02.020. [DOI] [PMC free article] [PubMed] [Google Scholar]
- Meyer JN. QPCR: a tool for analysis of mitochondrial and nuclear DNA damage in ecotoxicology. Ecotoxicology. 2010;19(4):804–811. doi: 10.1007/s10646-009-0457-4. [DOI] [PMC free article] [PubMed] [Google Scholar]
- Meyer JN, Boyd WA, Azzam GA, Haugen AC, Freedman JH, Van Houten B. Decline of nucleotide excision repair capacity in aging Caenorhabditis elegans. Genome Biol. 2007;8(5):R70. doi: 10.1186/gb-2007-8-5-r70. [DOI] [PMC free article] [PubMed] [Google Scholar]
- Rooney JP, Ryde IT, Sanders LH, Howlett EH, Colton MD, Germ KE, Meyer JN. PCR based determination of mitochondrial DNA copy number in multiple species. Methods Mol Biol. 2015;1241:23–38. doi: 10.1007/978-1-4939-1875-1_3. [DOI] [PMC free article] [PubMed] [Google Scholar]
- Salazar JJ, Van Houten B. Preferential mitochondrial DNA injury caused by glucose oxidase as a steady generator of hydrogen peroxide in human fibroblasts. Mutat Res. 1997;385(2):139–149. doi: 10.1016/s0921-8777(97)00047-5. [DOI] [PubMed] [Google Scholar]
- Sanders LH, Greenamyre JT. Oxidative damage to macromolecules in human Parkinson disease and the rotenone model. Free Radic Biol Med. 2013;62:111–120. doi: 10.1016/j.freeradbiomed.2013.01.003. [DOI] [PMC free article] [PubMed] [Google Scholar]
- Sanders LH, Howlett EH, McCoy J, Greenamyre JT. Mitochondrial DNA damage as a peripheral biomarker for mitochondrial toxin exposure in rats. Toxicol Sci. 2014;142(2):395–402. doi: 10.1093/toxsci/kfu185. [DOI] [PMC free article] [PubMed] [Google Scholar]
- Sanders LH, Laganiere J, Cooper O, Mak SK, Vu BJ, Huang YA, Schule B. LRRK2 mutations cause mitochondrial DNA damage in iPSC-derived neural cells from Parkinson's disease patients: reversal by gene correction. Neurobiol Dis. 2014;62:381–386. doi: 10.1016/j.nbd.2013.10.013. [DOI] [PMC free article] [PubMed] [Google Scholar]
- Sanders LH, McCoy J, Hu X, Mastroberardino PG, Dickinson BC, Chang CJ, Greenamyre JT. Mitochondrial DNA damage: molecular marker of vulnerable nigral neurons in Parkinson's disease. Neurobiol Dis. 2014;70:214–223. doi: 10.1016/j.nbd.2014.06.014. [DOI] [PMC free article] [PubMed] [Google Scholar]
- Sanders LH, Paul KC, Howlett EH, Lawal H, Boppana S, Bronstein JM, Greenamyre JT. Editor’s Highlight: Base Excision Repair Variants and Pesticide Exposure Increase Parkinson’s Disease Risk. Toxicol Sci. 2017;158(1):188–198. doi: 10.1093/toxsci/kfx086. [DOI] [PMC free article] [PubMed] [Google Scholar]
- Wolters S, Schumacher B. Genome maintenance and transcription integrity in aging and disease. Front Genet. 2013;4:19. doi: 10.3389/fgene.2013.00019. [DOI] [PMC free article] [PubMed] [Google Scholar]
- Yakes FM, Van Houten B. Mitochondrial DNA damage is more extensive and persists longer than nuclear DNA damage in human cells following oxidative stress. Proc Natl Acad Sci U S A. 1997;94(2):514–519. doi: 10.1073/pnas.94.2.514. [DOI] [PMC free article] [PubMed] [Google Scholar]