 The mechanism of uranium-induced kidney cell cytotoxicity is not fully understood.
Abstract
The mechanism of uranium-induced kidney cell cytotoxicity is not fully understood. Nrf2 is a transcription factor which can regulate gene expression of cystathionine β-synthase (CBS) and cystathionine γ-lyase (CSE) which are responsible for endogenous H2S formation. H2S is recognized as the gaseous mediator that exerts antioxidative and cytoprotective effects. Here, we assessed the in vitro effects of uranyl acetate on Nrf2 gene expression and endogenous H2S production in a stable rat kidney cell line (NRK-52E). The results imply that uranium treatment decreased cell viability and increased LDH release, indicating uranium-induced cytotoxicity. Uranium intoxication increased intracellular ROS and MDA contents, depleted GSH levels, and impaired SOD and CAT activities, which resulted in oxidative stress injuries. Uranium intoxication reduced CBS and CSE gene expression and endogenous H2S production. Uranium contamination decreased Nrf2 protein expression and nuclear translocation. RNA silencing of Nrf2 gene expression in kidney cells which had not been treated by uranium decreased CBS and CSE gene expression and endogenous H2S generation, which mirrored the effects of uranium exposure. In contrast, treating uranium-exposed kidney cells with Nrf2 activator (sulforaphane) preserved the protein levels of Nrf2, CBS and CSE, and endogenous H2S formation. Administration of NaHS (an H2S donor) to uranium-intoxicated kidney cells reduced cell damage and alleviated oxidative stress. These data imply that uranium-induced kidney cell cytotoxicity is mediated by decreased endogenous H2S production due to the down-regulation of CBS and CSE gene expression and reduced Nrf2 levels. Supplementary H2S generation and/or Nrf2 activation can mitigate the adverse effects of uranium on kidney cells.
1. Introduction
Uranium is a potentially environmentally hazardous metal, which is not physiologically or biochemically essential for mammals. The widespread applications of uranium in civilian society, the military sector and nuclear power reactors increase the release of this radionuclide into the environment. Uranium dispersion causes contamination of ground water as well as food chains, and poses a threat to the health of general populations. Once uranium enters into the human body, a small proportion gains access to the circulation and is partly stored in the target organs. The kidney, liver, brain, bone, lung and intestine are the critical target organs for uranium exposure.1 Among them, the kidney is the main target of uranium toxicity, and renal dysfunction is the most characteristic response to uranium exposure. Acute uranium intoxication can cause reversible nephrotoxicity in humans and laboratory animals.2 Many questions about the precise mechanisms of uranium-induced nephrotoxicity have not been elucidated, and these mechanisms are not easily accessible in vivo. In fact, uranium-induced kidney dysfunction is mainly related to the renal proximal tubular epithelial cells.3,4 Cell culture studies indicate that the molecular mechanism which is responsible for uranium-induced kidney cell cytotoxicity may be involved in oxidative stress by producing intracellular reactive oxygen species (ROS) and disturbing the antioxidant defense systems.5,6 However, the fine molecular mechanism of upstream events for regulating oxidative stress is still poorly defined in uranium-induced kidney cell cytotoxicity.
Hydrogen sulfide (H2S), previously known as an environmentally toxic gas, has been recognized as the third physiological gasotransmitter (after NO and CO) with a variety of biological functions.7 Endogenous H2S is formed from cysteine and homocysteine in many tissues in several enzymatic reactions catalyzed by cystathionine β-synthase (CBS), cystathionine γ-lyase (CSE) and 3-mercaptopyruvate sulfurtransferase (3MST) along with cysteine aminotransferase (CAT).8 H2S is reported to readily scavenge ROS, such as hypochlorous acid,9 superoxide,10 and hydrogen peroxide.11 In addition, H2S can increase the glutathione levels and bolster endogenous antioxidant defenses by regulating the nuclear transcription factor erthyroid 2 (NF-E2)-related factor 2 (Nrf2) pathway.12–14 Under normal homoeostatic conditions, Nrf2 is repressed in the cytoplasm by the dual actions of Kelch-like ECH associating protein 1 (Keap1) and the glycogen synthase kinase-3/beta-transducin repeat-containing protein (GSK-3/β-TrCP) axis. Upon exposure to oxidants and soft electrophiles or stimulation by endogenous signaling pathways or xenobiotics, the free fraction of Nrf2 accumulates, translocates to the nucleus and dimerizes with a small Maf protein. The Nrf2-Maf complex then recognizes and binds with the antioxidant response element (ARE) located in the promoter regions of many cell defense genes.15,16 Recent studies indicate that Nrf2 can bind with a similar ARE cis-acting regulatory element in the promoter regions of CBS and CSE genes. Nrf2 can regulate CBS and CSE expression which are involved in endogenous H2S metabolism.17 CBS and CSE expression are identified in the renal cells under normal conditions. The kidney is a major target of H2S in the body, and H2S participates in the regulation of renal functions.18
Recently, we have identified that uranium-induced nephrotoxicity in SD rats is concomitant to decreased CBS and CSE protein levels and endogenous H2S generation in the kidney homogenates, and that administration of exogenous H2S attenuates the uranium-induced acute nephrotoxicity through ameliorating oxidative stress.19 Given the antioxidant and cytoprotective properties of H2S,7,20 it was hypothesized that endogenous H2S deficiency could potentially contribute to uranium-induced kidney cell cytotoxicity. The underlying mechanism may be that endogenous H2S deficiency could result from decreased CBS and CSE gene expression which could be down-regulated by reduced Nrf2 levels due to massive oxidative stress. The current study was designed to investigate the in vitro effects of uranium intoxication in normal rat kidney proximal cells on endogenous H2S generation, H2S-producing enzymes and Nrf2 levels as upstream events of oxidative stress. Our results provide the evidence that decreased Nrf2 levels could be involved in down-regulating CBS and CSE gene expression resulting in reduced endogenous H2S production, which is involved in rat kidney cell cytotoxicity following uranium exposure.
2. Materials and methods
2.1. Chemicals, antibodies and reagent kits
Uranyl(vi) acetate dihydrate (UO2 (AC)2·2H2O) was provided as a gift by the China Nuclear Industry Group Corporation (Beijing, China) and kept in the Key Discipline Laboratory for National Defense for Biotechnology in Uranium Mining and Hydrometallurgy at the University of South China. Based on the information provided by the supplier, the isotopic composition of the uranyl acetate was 99.74% 238U, 0.26% 235U, and 0.001% 234U. Biochemical assay kits were purchased from Nanjing Jiangcheng Bioengineering Institute (Nanjing, China) for determining malondialdehyde (MDA) (No. A003-1), reduced glutathione (GSH) (No. A061-2), superoxide dismutase (SOD) (No. A001-1), catalase (CAT) (No. A007-1), and lactate dehydrogenase (LDH) (No. A020-2) levels. NE-PER Nuclear and Cytosolic Extraction Reagents (No. 78835), BCA assay Kit (No. 23235) and PowerUp™ SYBR® Green Master Mix (A25742) were bought from Thermo Scientific (Rockford, IL). TRIzol reagent (No. 15596-018) and SuperScript III Reverse Transcriptase reagents kit (No. 18080-051) were bought from Invitrogen (CA, USA). The antibodies anti-Nrf2, anti-CBS, anti-CSE, anti-histone H1 and anti-β-actin, as well as the short siRNA targeting the rat Nrf2 gene and scrambled siRNA control kits, were obtained from Santa Cruz Biotechnology (CA, USA). Sulforaphane (SFN), sodium hydrosulphide (NaHS), and 2′,7′- dichlorofluorescein diacetate (DCF-DA) were bought from Sigma (St. Louis, MO, USA). All other reagents and chemicals used were of the highest grade of purity commercially available.
2.2. Preparation of uranyl solutions
All the experiments were performed using a 0.1 M stock solution of uranyl acetate (pH 4) in sterile doubly distilled deionized water, the correct concentration being verified by inductively coupled plasma-mass spectrometry (ICP-MS) (ELANR DRC-e, PE, USA) at Guiyang Geochemistry Institute in the Chinese Academy of Sciences (Guiyang, China). For cellular intoxication, uranyl bicarbonate solutions were prepared extemporaneously using appropriate dilutions of the stock solution filtered with a 0.22 μm syringe filter in aqueous 0.1 M bicarbonate solution under sterile conditions. Just prior to cell treatments, uranyl bicarbonate solutions were diluted to their final concentrations in Dulbecco's Modified Eagle's Medium (DMEM).
2.3. Cell culture
The normal rat kidney proximal cell line (NRK-52E) has been extensively used to investigate uranium-induced cell stress and chosen as an established cell model of oxidative stress in kidney cells.5,6 The NRK cells were purchased from the Type Culture Collection in the Chinese Academy of Sciences (Shanghai Institute of Life Science, Shanghai, China). They were cultured in DMEM supplemented with 1.5 g L–1 sodium bicarbonate, 5% newborn calf serum, 100 unit per ml penicillin, and 100 μg per ml streptomycin. They were maintained at 37 °C in a humidified 5% CO2/95% air atmosphere incubator. Once at a confluence of approximately 60–70%, the kidney cells in the culture dishes were used for experiments.
2.4. Treatment and experimental protocols
To investigate the effects of uranium on in vitro Nrf2 expression and endogenous H2S generation (which could be involved in uranium-induced kidney cell cytotoxicity), a number of NRK cells (2 × 10⁴) were incubated with different concentrations of uranyl acetate (200, 400 or 800 μM) for 24 h. The concentrations of uranyl acetate were selected based on previous reports about the kidney cell cytotoxicity induced by uranium5,6 and on our preliminary experiments. In some experiments, sulforaphane (SFN, 5 mM) was added during the final 8 h of the 24 h exposure to 400 μM uranium. SFN is a naturally occurring compound from cruciferous vegetables which is identified to increase Nrf2 protein expression and nuclear translocation.21,22
For studies into the cytoprotective effects of H2S against kidney cell cytotoxicity induced by uranium, a number of NRK cells (2 × 10⁴) were divided into groups. The cells in Group I (control) were not treated with NaHS or uranyl acetate. The cells in Group II (uranium alone) were intoxicated with 400 μM of uranyl acetate for 24 h. The cells in Group III (NaHS alone) were pre-administered with different concentrations (50, 100 or 200 μM) of NaHS for 30 min. The cells in Group IV (NaHS + uranium) were pretreated with different concentrations (50, 100 or 200 μM) of NaHS for 30 min prior to exposure to 400 μM uranyl acetate for 24 h. The doses and method of administration of NaHS were chosen based on the evidence for H2S protection against cellular damage23–25 and on our preliminary experiments. Dehydrated NaHS powder was freshly dissolved in phosphate buffered saline (PBS) for use.
2.5. Nrf2 knockdown by siRNA transfection
Nrf2 knockdown in the NRK cells was accomplished using rat sequences targeting Nrf2, corresponding to the coding region nucleotides as follows: sense, 5′-GCACGGUGGAGUUCAUGA TT-3′; anti-sense 5′-UCAUUGAACUCCACCGUGCCT-3′. The cells which were not treated by agents were plated in 6-well plates overnight to form 60–70% confluent monolayers. They were transfected using Lipofectamine 2000, according to the manufacturer's instructions, with Nrf2 siRNA at 5 μM final siRNA concentration in the complete culture medium (200 ml per well in 6-well plates) and incubated at 37 °C under an atmosphere of 5% CO2 and 95% air for 6 h. The kidney cells were transfected with the same concentration of scrambled siRNA as a negative control. After 48 hours transfection, the kidney cells were harvested to extract the total expressed protein for gene expression.
2.6. Determination of intracellular ROS production
The intracellular ROS production was measured by using DCFH-DA as a probe and following the method of LeBel et al.26 Briefly, the kidney cells were seeded in a 96-well microplate at a density of 5000 cells per well. After preloading with 10 μM DCFH-DA at 37 °C for 30 min, the cells were washed with PBS and treated as described above. Fluorescence intensities were determined by SpectraMax M2 Microplate Readers (Molecular Devices, Sunnyvale, CA) using 485 nm excitation and 538 nm emission filters.
2.7. Analysis of oxidative stress markers
After the treatment described previously, the kidney cells were scraped, pelleted and re-suspended in 1 mL of 100 mM PBS, pH 7.4. The cell membranes were disrupted by sonication on ice. The cell lysates were centrifuged at 4 °C and 10 000g for 20 min and the supernatants were separated from cell debris and used for oxidative stress indices analyses using the standard commercial kits. GSH levels were presented as nmol mg–1 protein; SOD and CAT activities were expressed as unit per mg protein. All the tests were performed following the manufacturer's procedures. All measurements were normalized to the protein contents in the cell lysates. The total protein contents were measured using the BCA protein assay kit.
2.8. Measurement of lipid peroxidation in cells
MDA content, a measure of lipid peroxidation, was measured using a thiobarbituric acid reactive substances (TBARS) assay. Briefly, the kidney cells (control and treated) were collected in 1 ml PBS buffer solution (pH 7.4) and sonicated (3 × 5 s at 40 V setting on ice). The whole cell lysates were used in the TBARS assay based on the manufacturer's instructions. MDA reacts with thiobarbituric acid forming a colored product which can be measured at an absorbance of 532 nm. MDA levels were presented as nmol per mg protein.
2.9. Cell viability test
Cell viability was determined using a MTT assay.27 Briefly, a MTT stock solution (5 mg ml–1) was firstly prepared by dissolving MTT powder in PBS. After the kidney cells were treated as described above, 10 μl of MTT solution was added to each well and incubated for 2 h at 37 °C. The wells were emptied and the blue formazan crystals were dissolved in 100 μl of MTT solubilization solution (10% Triton X-100, 0.1N HCl in 2-propanol). After 5 min of dissolution at room temperature under agitation, the absorbance at 570 nm was measured using a Statfax-2100 microplate reader (Awareness Technology, Inc., FL). Cell viabilities and cytotoxicities were expressed as a percentage of the control.
2.10. Measurement of lactate dehydrogenase release
The extracellular LDH level in the cell culture medium was measured by a modification of a routine colorimetric laboratory method.28 Briefly, a volume of medium ranging from 5 to 200 μl from the cell lysate or culture medium was incubated with 0.2 mM β-NADH and 0.4 mM pyruvic acid diluted in PBS, pH 7.4. The LDH concentration in the sample is proportional to the linear decrease in absorbance at 334 nm and can be calculated using a commercial standard. The LDH release represents the percentage of LDH in the cell culture medium in relation to the total LDH (culture medium and cell lysate).
2.11. Measurement of H2S content and H2S synthesizing activity
H2S contents in the cell culture supernatants were measured using zinc acetate trapping and reaction with N,N-dimethyl-p-phenylenediamine (NNDPD), as described previously by Xia et al.18 This method has been widely adopted for the measurement of H2S concentration in tissues or cells12,18,23–25,29,30, although there is a limitation, as pointed out by Kabil and Banerjee.31 Briefly, in this method, all solutions were deoxygenated by passing through nitrogen for 30 min prior to the experiments. After the kidney cells were treated as described above, the cell culture supernatants (310 μl) were obtained and mixed with trichloroacetic acid (20% w/v, 60 μl), zinc acetate (2% w/v, 30 μl), NNDPD (20 mM; 40 μl) in 7.2 M HCl, and FeCl3 (30 mM; 30 μl) in 1.2 M HCl. The absorbance of the resulting solution (670 nm) was measured with a spectrophotometer (UV-2550, Shimadzu, Japan) for 15 min. H2S concentration was calculated against a calibration curve of NaHS (0.122–250 μM) prepared by dissolving NaHS in deoxygenated PBS.
To determine the capacity for H2S synthesis, the kidney cells were collected, washed twice with PBS, and homogenized in 50 mM ice-cold potassium phosphate buffer (pH 6.8) after the cells had been treated as described previously. In the absence or presence of l-cysteine (20 μl, 10 mM), the cellular homogenates (11% w/v, 430 μl) were added to a reaction mixture, which contained 100 mM potassium phosphate buffer (pH 7.4), pyridoxyal 5′-phosphate (20 μl, 2 mM) and saline (30 μl). The reaction was performed in tightly-stoppered cryovial test tubes and initiated by transferring the tubes from ice to a shaking water bath at 37 °C. After incubation for 30 min, 1% w/v zinc acetate (250 μl) was added to trap the evolved H2S and this was followed by the addition of 10% v/v trichloroacetic acid (250 μl) to denature the protein and stop the reaction. Subsequently, NNDPD (20 mM; 133 μl) in 7.2 M HCl was added, immediately followed by FeCl3 (30 mM; 133 μl) in 1.2 M HCl. The absorbance of the resulting solution at 670 nm was measured with spectrophotometry, and the H2S concentration was calculated against a calibration curve of NaHS. The H2S synthesizing activity was obtained as the difference in H2S generation from reaction samples in the absence and presence of l-cysteine and calculated as the H2S production per g protein per minute. For each experiment, the H2S synthesizing activity in the kidney cells exposed to a normal medium was defined as 100%, and the H2S synthesizing activity under other conditions was expressed as a percentage of the control.
2.12. RNA isolation and real-time PCR
Total RNA was isolated from the kidney cells in the presence of uranium and Nrf2 knockdown using the TRIzol reagent. For cDNA synthesis, 2 μg of total RNA was reverse transcribed to cDNA in a total volume of 20 μl with the reverse transcription reagents mixer following the supplier's instructions. CBS and CSE mRNA were determined by a real-time PCR analysis using the iQ5 real-time PCR detection system (Bio-Rad). In brief, the reaction mixture of real-time PCR contained 0.4 μM of 5′ and 3′ primers, 2 μl of cDNA product, and iQ-SYBR green supermix reagent in a total volume of 25 μl. The real-time PCR reaction conditions consisted of 1 cycle of predenaturation (95 °C for 1 min), 40 cycles of amplification (95 °C for 10 s and 60 °C for 20 s), and a cooling program of 50 °C for 30 s. Relative levels of CBS and CSE mRNA expression were respectively normalized to β-actin (internal control). The sequences of the primers were as follows: rat CBS, 5′-AGACACCGACTGGTTTCCAC-3′ (forward) and 5′-ACAGTCAGTCCAGGGTTT- GC-3′ (reverse); rat CSE, 5′-ACACTTCAGGAATGGGATGG-3′ (forward) and 5′-TGAGCA- TGCTGCAGAGTACC-3′ (reverse); and rat β-actin, 5′-GCCTCACTGTCCACCTTCCA-3′ (forward) and 5′-CCCGGCCTGAGTAGCATGA-3′ (reverse). Primers were synthesized by Sangon Biotech Co., Ltd (Shanghai, China).
2.13. Protein isolation and western blots
The kidney cells treated under various conditions were washed with cold PBS and suspended for 30 min in 0.4 ml of hypotonic lysis buffer (20 mM Tris-HCl, pH 7.5, 10 mM NaCl, 1 mM EDTA, and 2 mM Na3VO4) containing protease inhibitors (10 μg per ml leupeptin and 1 μM pepstatin). The cells were then lysed with 12.5 μl of 10% NP-40. The homogenates were centrifuged, and the supernatants, which contained the cytoplasmic extracts, were stored at –80 °C. The nuclear pellets were re-suspended in 25 μl of ice-cold nuclear-extraction buffer for 30 min, with intermittent mixing. Next, the extracts were centrifuged, and the supernatants containing the nuclear extracts were obtained. The protein contents were measured using BCA protein assay kits. The protein samples (60 μg of nuclear proteins and 50 μg of cytosolic proteins) were separated by sodium dodecyl sulphate/polyacrylamide gel electrophoresis and transferred to polyvinylidene difluoride membranes using the Semi-Dry Trans-Blot Cell (Bio-Rad Laboratories, USA). After transfer, the membranes were washed with 0.1% Tween-20 in Tris buffered saline (TBS-T) and blocked for 1 h at room temperature with 5% (w/v) skimmed milk powder in Tris buffered saline (TBS). The blots were incubated overnight at 4 °C with the primary antibodies. The primary antibodies against Nrf2 (1 : 1000), CBS (1 : 500) and CSE (1 : 200) were used. On the following day, the membranes were washed three times for 20 min each with TBS-T and incubated with the secondary antibodies for 2 h. The membranes were then washed three times with TBS-T for 20 min and once with TBS for 5 min, and the electrogenerated chemiluminescence reaction solutions were added (solution 1: 0.1 M Tris-HCl, luminol, p-coumaric acid; solution 2: 0.1 M Tris-HCl, hydrogen peroxide) for 2 min. Quantification of Nrf2 protein was expressed as a ratio to histone H1 for nuclear Nrf2 and to β-actin for cytosolic Nrf2. CBS and CSE levels were measured in the cytosolic protein samples, for which β-actin was used as the loading control. The immunoblot signals were visualized using an image analysis system equipped with BIO-ID software (Vilber Lourmat, France) and the integrated optical densities for the protein bands were calculated by Image-J software.
2.14. Statistical analysis
All data are expressed as mean ± standard error (SE) of the mean for the repeats of the individual experiments indicated. Data were analyzed by one-way analysis of variance (ANOVA), with uranium intoxication or siRNA transfection as the single factor. Data were analyzed by two-way analysis of variance (ANOVA), with uranium contamination and supplementary NaHS (or SFN) as the two factors. A probability level of P < 0.05 was considered to indicate statistically significant differences. All analyses were performed using SPSS 13.0 software (SPSS, Inc., Chicago, IL, USA).
3. Results
3.1. Uranium intoxication in kidney cells impeded the antioxidant defense system
To investigate the effect of uranium on oxidative stress in the kidney cells, we obtained data on ROS, MDA, GSH, SOD and CAT in NRK cells intoxicated with different concentrations of uranium (200, 400 or 800 μM) for 24 h. As summarized in Table 1, the intracellular ROS and MDA levels significantly increased in uranium-treated kidney cells, denoting the presence of oxidative stress. This was associated with a marked reduction in the concentration of reduced glutathione (GSH) in uranium-treated kidney cells. Uranium treatment in the kidney cells also significantly decreased SOD and CAT activities when compared to the control group. These results imply that uranium intoxication impeded the endogenous antioxidant defense system in the kidney cells.
Table 1. Intracellular ROS, MDA and oxidative stress parameters in normal rat kidney proximal cells (NRK-52E) intoxicated by uranyl acetate (U).
| Parameters | Control | U (200 μM) | U (400 μM) | U (800 μM) |
| ROS (100%) | 100 ± 3.21 | 122 ± 0.78* | 156 ± 2.33** | 321 ± 0.75*** |
| MDA (nmol per mg prot) | 9.18 ± 0.03 | 24.23 ± 0.31* | 31.72 ± 0.04** | 40.32 ± 0.27** |
| GSH (nmol per mg prot) | 22.56 ± 0.76 | 18.07 ± 0.67* | 16.54 ± 0.78* | 11.23 ± 0.39** |
| SOD (unit per mg prot) | 1.27 ± 0.51 | 0.95 ± 0.71* | 0.81 ± 0.91** | 0.64 ± 0.37** |
| CAT (unit per mg prot) | 4.60 ± 0.27 | 3.81 ± 0.57* | 2.67 ± 0.83** | 1.21 ± 0.61*** |
3.2. Uranium intoxication in kidney cells induced cytotoxicity
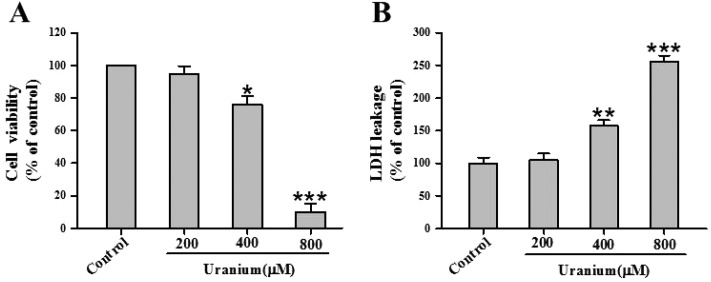
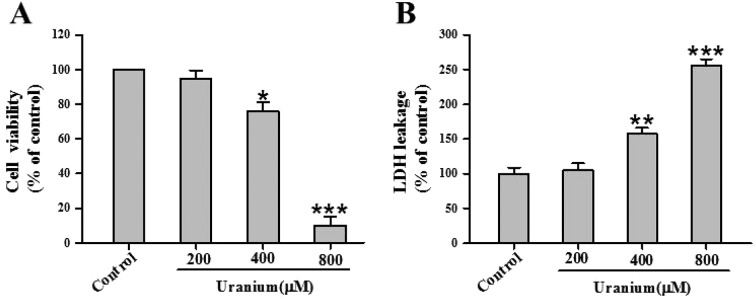
To gain insight into uranium-induced kidney cell cytotoxicity, we investigated cell viability and extracellular LDH leakage in NRK cells treated with various concentrations of uranium (200, 400 or 800 μM) for 24 h. As shown in Fig. 1A, there was no significant difference in cytotoxicity between 200 μM uranium-exposed and control groups. Exposure to 400 or 800 μM concentrations of uranium significantly decreased cell viability compared with the control group. Likewise, treatment of the kidney cells with 400 or 800 μM uranium significantly increased LDH leakage when compared with the control group (Fig. 1B), indicating that uranium intoxication in the kidney cells caused cell membrane damage.
Fig. 1. Effects of uranyl acetate on cell viability and LDH leakage in normal rat kidney proximal cells (NRK-52E). After the kidney cells were incubated with different concentrations of uranyl acetate (200, 400 or 800 μM) for 24 h, cell viability (A) was determined by MTT assay, and LDH leakage (B) was tested by a routine colorimetric laboratory method as described in the “Materials and methods” section. Values are expressed as the mean ± SE (n = 5). An asterisk represents a significant difference between uranium-treated and untreated cells (one-way ANOVA, *P < 0.05, **P < 0.01, ***P < 0.001).
3.3. Uranium treatment in kidney cells affected endogenous H2S levels, H2S synthesizing activity, and expression of H2S-producing enzymes
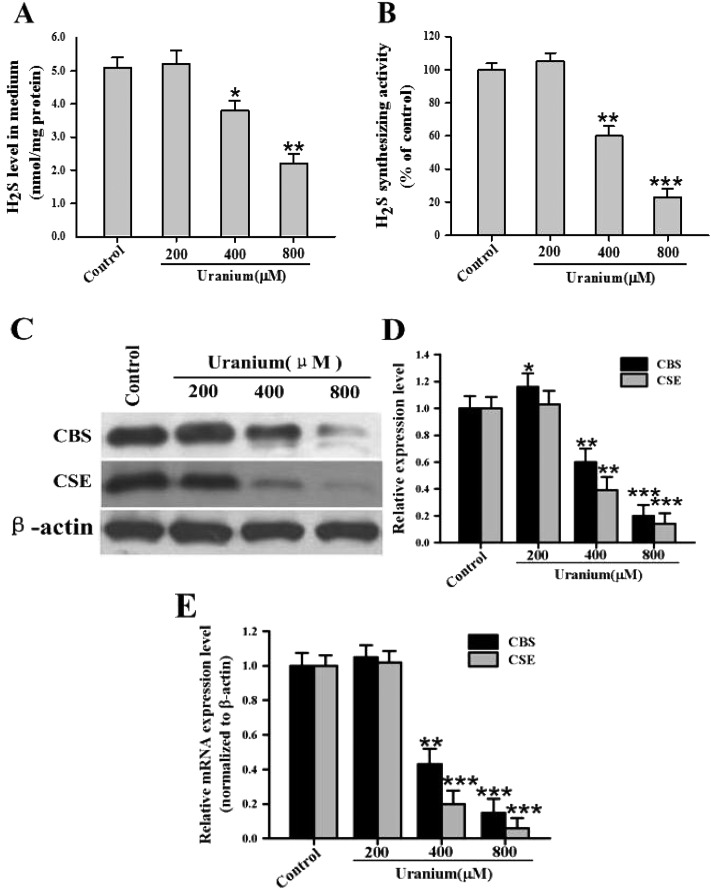
To investigate the effect of uranium on endogenous H2S production in the kidney cells, the NRK cells were treated with various concentrations of uranium (200, 400 or 800 μM) for 24 h. As depicted in Fig. 2A, endogenous H2S generation was not significantly different in 200 μM uranium-treated kidney cells when compared to the control group. However, there was a significant decrease in H2S concentration in 400 or 800 μM uranium-administered kidney cells when compared with the control cells. This indicated that uranium intoxication in the kidney cells decreased endogenous H2S formation. To explore whether the inhibition by uranium of H2S generation in the kidney cells could be involved in the down-regulation of H2S synthesizing activity, the effect of uranium on H2S formation activity was examined in the NRK cells. As illustrated in Fig. 2B, the H2S formation ability was significantly reduced in the cells treated with 400 or 800 μM uranium for 24 h, suggesting that the down-regulation of H2S synthesizing activity by uranium intoxication in the kidney cells contributed to the inhibitory effect on endogenous H2S production. After 24 h exposure to 400 or 800 μM uranium, the mRNA and protein expression of CBS and CSE in the cells were significantly down-regulated (Fig. 2C, D and E). These data imply that uranium intoxication in the kidney cells diminished the mRNA and protein levels of CBS and CSE responsible for endogenous H2S biosynthesis.
Fig. 2. Effects of uranyl acetate on endogenous H2S generation, H2S synthesizing activity, and mRNA and protein expression of CBS and CSE in normal rat kidney proximal cells (NRK-52E). After the kidney cells were incubated with different concentrations of uranyl acetate (200, 400 or 800 μM) for 24 h, the H2S content in the cell culture supernatant (A) and the H2S synthesizing activity in the kidney cells (B) were tested as described in the “Materials and methods” section. Representative western blots (C) and group data (D) showed CBS and CSE protein abundance in the kidney cells. β-actin was used as the loading control. The CBS and CSE mRNA expression in the kidney cells was determined by real-time PCR (E), and crossing threshold values were normalized to β-actin mRNA expression. Values are expressed as the mean ± SE (n = 5). An asterisk represents a significant difference between uranium-treated and untreated cells (one-way ANOVA, *P < 0.05, **P < 0.01, ***P < 0.001).
3.4. Uranium contamination in kidney cells affected Nrf2 protein expression and nuclear translocation
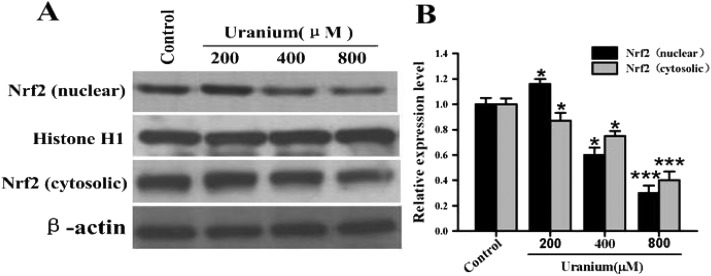
To examine the effect of uranium on Nrf2 protein expression in the kidney cells, the NRK cells were treated with various concentrations of uranium (200, 400 or 800 μM) for 24 h. As indicated in Fig. 3, this led to a significant increase in nuclear and cytosolic Nrf2 protein levels in cells treated with 200 μM uranium compared with the corresponding control groups. However, treatment with 400 or 800 μM uranium in the kidney cells significantly decreased the nuclear Nrf2 protein level when compared to that in the control cells. Compared with the control group, a significant decrease was also observed in the cytosolic Nrf2 protein level in the kidney cells intoxicated with 400 or 800 μM uranium. These results suggest that uranium intoxication in the kidney cells significantly decreased Nrf2 protein expression, nuclear translocation and accumulation.
Fig. 3. Representative western blots (A) and group data (B) depicting Nrf2 protein abundance in normal rat kidney proximal cells (NRK-52E). After the kidney cells were incubated with different concentrations of uranyl acetate (200, 400 or 800 μM) for 24 h, Nrf2 was examined in the nuclear and cytosolic fractions. Histone H1 and β-actin were used as the nuclear and cytosolic loading controls, respectively. Values are expressed as the mean ± SE (n = 5). An asterisk represents a significant difference between uranium-treated and untreated cells (one-way ANOVA, *P < 0.05, **P < 0.01, ***P < 0.001).
3.5. Direct inhibition of Nrf2 protein expression by RNA interference reproduced the effects of uranium exposure in kidney cells
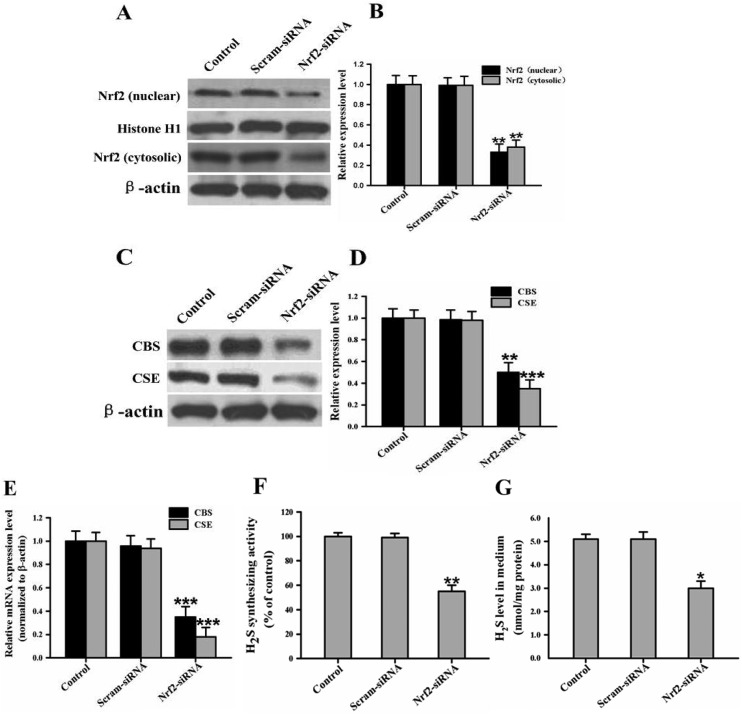
To test the selectivity of Nrf2 siRNA, we determined Nrf2 protein levels in NRK cells after the 24 hours after transfection with Nrf2 siRNA (5 μM). When Nrf2 expression was knocked down by Nrf2 siRNA, the basal Nrf2 protein level in the siRNA-transfected cells was approximately 33% of that in the control cells (Fig. 4A and B). To further confirm whether the knockdown of Nrf2 expression could in fact cause a decrease in the expression of H2S-producing enzymes, H2S synthesizing activity, and endogenous H2S generation in the kidney cells, the NRK cells were transfected with Nrf2 siRNA (5 μM) or silencer negative control siRNA (5 μM) in the absence of uranium. Our results show that the cells transfected with Nrf2 siRNA displayed a significant decrease in the mRNA and protein levels of CBS and CSE compared to the control cells (Fig. 4C, D and E). Also, the knockdown of Nrf2 expression caused a significant decrease in H2S synthesizing activity, and Nrf2 siRNA significantly decreased endogenous H2S generation compared to the control group (Fig. 4F and G). Furthermore, the silencer negative control siRNA did not affect H2S-producing enzyme expression, H2S synthesizing activity, or endogenous H2S production, eliminating the possibility that the inhibitory effects of Nrf2 siRNA might have been due to non-specific toxicity. These data imply that direct inhibition of Nrf2 protein expression by siRNA, in the absence of uranium, mirrored the effects of uranium exposure in the kidney cells.
Fig. 4. RNA interference (RNAi) with Nrf2 reproduces the effects of uranyl acetate exposure in normal rat kidney proximal cells (NRK-52E). In the absence of uranium, the kidney cells were treated with short interfering RNA (siRNA; 5 μM) against Nrf2 or with a negative control siRNA at the same concentration. Representative western blots and group data show the protein abundance of Nrf2 (A and B), and CBS and CSE (C and D) in the kidney cells. The Nrf2 protein was examined in the nuclear and cytosolic fractions. Histone H1 and β-actin were used as the nuclear and cytosolic loading controls, respectively. The CBS and CSE mRNA expression in the kidney cells was determined by real-time PCR assays (E), and crossing threshold values were normalized to β-actin mRNA expression. H2S synthesizing activity in the kidney cells (F) and endogenous H2S levels in the cell culture supernatant (G) were measured as described in the “Materials and methods” section. Values are expressed as the mean ± SE (n = 5). An asterisk represents a significant difference between siRNA-treated and untreated cells (One-way ANOVA, *P < 0.05, **P < 0.01, ***P < 0.001).
3.6. SFN administration in uranium-intoxicated kidney cells restored expression of Nrf2 protein, H2S-producing enzymes and endogenous H2S level
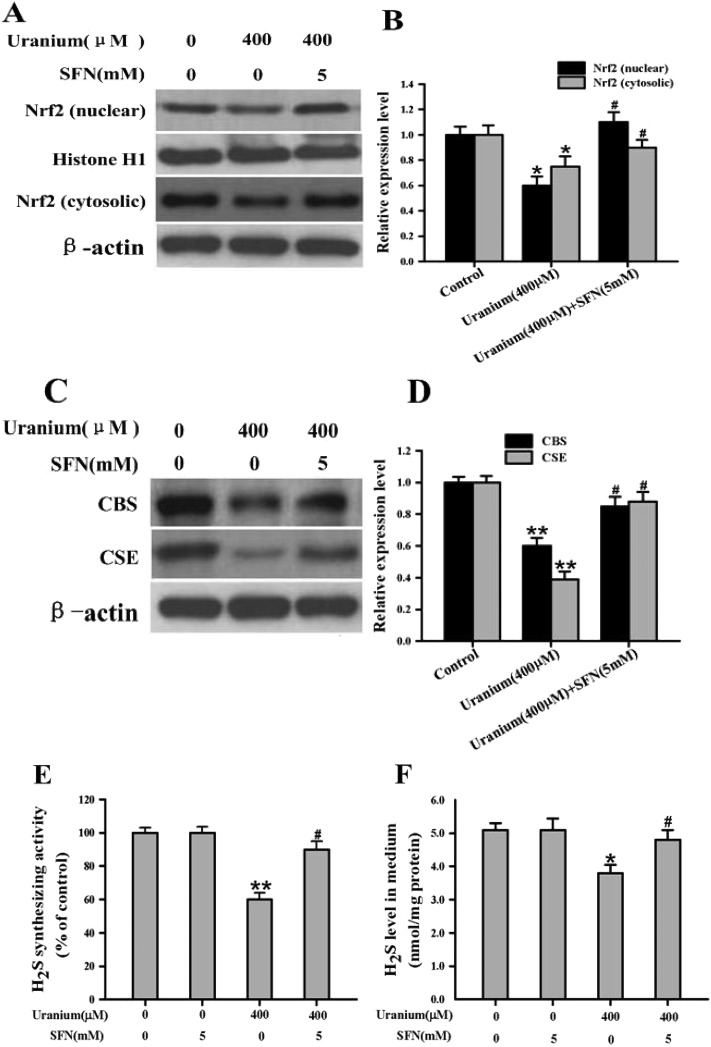
Sulforaphane (SFN) is a naturally occurring compound from cruciferous vegetables which can increase Nrf2 protein expression and nuclear translocation.21,22 Therefore, we treated 400 μM uranium-exposed kidney cells with SFN (5 mM) during the final 8 h of the 24 h uranium-intoxication period. As illustrated in Fig. 5A and B, SFN treatment significantly restored Nrf2 protein expression and increased Nrf2 nuclear translocation when compared with the uranium-administered group. Uranium exposure alone in the kidney cells significantly decreased CBS and CSE protein expression, H2S synthesizing activity, and endogenous H2S formation. In contrast, administration with SFN actually significantly increased these parameters when compared with cells treated with uranium alone (Fig. 5C–F). Taken together, the results suggest that SFN can reverse the inhibitory effects of uranium on Nrf2 protein expression and subsequent endogenous H2S generation in the kidney cells.
Fig. 5. Nrf2 activator (sulforaphane, SFN) reversed the inhibitory effects of uranium on the levels of Nrf2, CBS and CSE protein expression, H2S synthesizing activity, and endogenous H2S generation in the normal rat kidney proximal cells (NRK-52E). Uranium-exposed kidney cells were treated with SFN (5 mM) during the final 8 h of uranium (400 μM) intoxication for 24 h. Representative western blots and group data showed the protein abundance of Nrf2 (A and B), and CBS and CSE (C and D) expression in the kidney cells. Nrf2 was examined in the nuclear and cytosolic fractions. Histone H1 and β-actin were used as the nuclear and cytosolic loading controls, respectively. H2S synthesizing activity in the kidney cells (E) and endogenous H2S content in the cell culture supernatant (F) were measured as described in the “Materials and methods” section. Values are expressed as the mean ± SE (n = 5). An asterisk represents a significant difference between cells treated with uranium alone and untreated cells; a sharp sign represents a significant difference between cells treated with uranium alone and uranium pulsing SFN treated cells (two-way ANOVA, *P < 0.05, **P < 0.01, #P < 0.05).
3.7. Supplementary exogenous H2S decreased cytotoxicity in uranium-intoxicated kidney cells
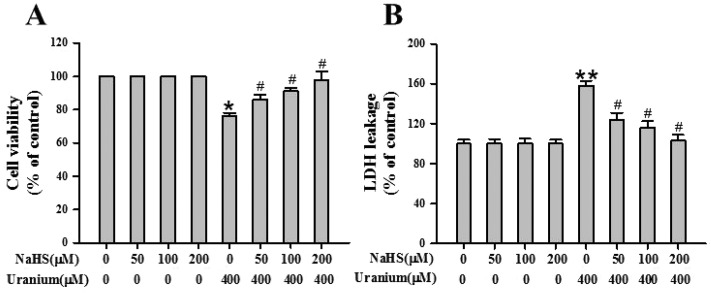
To evaluate the protective effects of H2S against uranium-induced kidney cell cytotoxicity, the NRK cells were treated with various concentrations of the H2S donor NaHS (50, 100 or 200 μM) for 30 min before intoxication with 400 μM uranium for 24 h. As shown in Fig. 6A, a significant elevation in cell survival was observed in the NaHS-pretreated group in comparison with the group subject only to uranium intoxication for 24 h. Exposure of kidney cells to NaHS alone for 30 min did not alter cell viability. The kidney cells incubated with both NaHS and uranium showed minimum LDH leakage (Fig. 6B), indicating less cell membrane damage. NaHS administration alone in the kidney cells showed practically no effect on LDH leakage. These results suggest that H2S plays a role in protecting against the kidney cell cytotoxicity induced by uranium.
Fig. 6. Effects of sodium hydrosulphide (NaHS, an H2S donor) on cell viability and LDH release in normal rat kidney proximal cells (NRK-52E) intoxicated by uranium. After the kidney cells were pretreated with different concentrations of NaHS (50, 100 or 200 μM) for 30 min and then intoxicated with uranyl acetate (400 μM) for 24 h, cell viability (A) was determined by MTT assay, and LDH leakage (B) was tested by a modification of a routine colorimetric laboratory method as described in the “Materials and methods” section. Values are expressed as the mean ± SE (n = 5). An asterisk represents a significant difference between cells treated with uranium alone and untreated cells; a sharp sign represents a significant difference between cells treated with uranium alone and uranium pulsing NaHS treated cells (Two-way ANOVA, *P < 0.05, **P < 0.01, #P < 0.05).
3.8. Addition of exogenous H2S in uranium-treated kidney cells alleviated oxidative stress
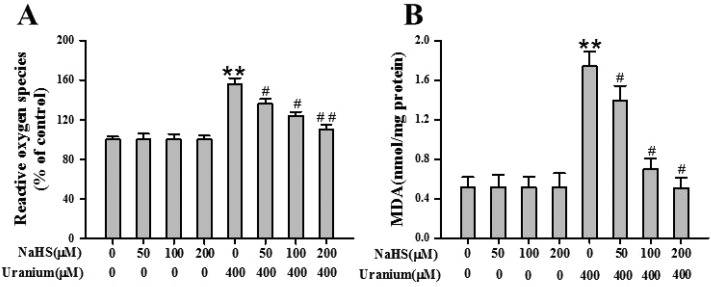
Considering that uranium-induced kidney cell cytotoxicity is known to be mainly mediated by oxidative stress, we investigated whether supplementary H2S in the kidney cells affects intracellular ROS formation and lipid peroxidation induced by uranium. The levels of ROS and MDA were measured after the NRK cells were administered with various concentrations of NaHS (50, 100 or 200 μM) for 30 min before intoxicating with 400 μM uranium for 24 h. As indicated in Fig. 7A, an increase in intracellular ROS levels was found in uranium-exposed kidney cells. Simultaneous cell incubation with NaHS and uranium prevented this increase in intracellular ROS levels compared to kidney cells exposed to uranium alone. It is observed that uranium contamination in the kidney cells induced a marked increase in MDA levels. However, NaHS pretreatment in uranium-intoxicated kidney cells attenuated the MDA level to a considerable extent (Fig. 7B). The results indicate that H2S protects against uranium-induced oxidative stress in the kidney cells.
Fig. 7. Effects of sodium hydrosulphide (NaHS, an H2S donor) on the generation of intracellular reactive oxygen species (ROS) and levels of lipid peroxidation (MDA) in normal rat kidney proximal cells (NRK-52E) contaminated by uranium. The kidney cells were pretreated with different concentrations of NaHS (50, 100 or 200 μM) for 30 min and then intoxicated with uranyl acetate (400 μM) for 24 h. Intracellular ROS (A) were then determined by fluorescent analysis using a 2,7- dichlorofluorescein diacetate (DCF-DA) probe, and MDA content (B) was measured by the standard commercial kit as described in the “Materials and methods” section. Values are expressed as the mean ± SE (n = 5). An asterisk represents a significant difference between cells treated with uranium alone and untreated cells; a sharp sign represents a significant difference between cells treated with uranium alone and uranium pulsing NaHS treated cells (two-way ANOVA, **P < 0.01, #P < 0.05, ##P < 0.01).
4. Discussion
The precise molecular mechanism of uranium cytotoxicity is rather complex, and has not been completely elucidated. As described previously, uranium-induced cytotoxicity is mediated either by its chemical or radioactive properties or both. Generally, uranium may produce chemotoxicity effects at a certain dosage whatever the uranium isotopic composition, and the radiotoxicity effects can depend on the 235U enrichment in the uranium isotopes even if there may well be overlapping effects between these two types of uranium-induced toxicities.32,33 Intracellular reduction of uranium(vi) to (iv) can cause interactions with molecular oxygen and induce the overproduction of intracellular ROS through Fenton reactions, which is an important characteristic of uranium(vi)-induced cytotoxicity.34 Uranium radiotoxicant properties also can promote the induction of free radicals and recombination leading to intracellular ROS formation.35 Many reports indicate that ROS are involved in the initiation of lipid peroxidation and oxidative stress in human and rat renal cells following uranium contamination in vitro.6,36 In this work, the lipid peroxidation end product, MDA, was significantly elevated in uranium-treated kidney cells compared to the control group, suggesting that the cell membrane permeability could be affected by this process. Uranium intoxication in the kidney cells significantly reduced GSH levels, indicating that the glutathione redox status was greatly impaired in the kidney cells. It has been shown that the decrease in GSH level upon uranium exposure might impair the degradation of lipid peroxides.6 Depletion of the cellular GSH level finally results in the accumulation of intracellular ROS and further accelerates cell damage. Uranium treatment in the kidney cells also caused a reduction in SOD and CAT enzymes activities, which became insufficient to eliminate excess ROS. Finally, administration with 400 or 800 μM uranium produced a typical pattern of kidney cell cytotoxicity as characterized by decreased cell viability and increased LDH release, in agreement with previous reports.4,5,37 Therefore, oxidative stress may be one of the reasons responsible for uranium-induced kidney cell damage. GSH depletion and impairment of endogenous antioxidant defense enzymes may alter the intracellular redox status that eventually leads to uranium-induced kidney cell cytotoxicity.
Nrf2 is a key regulator of redox homoeostasis that allows cells to adapt to oxidative stress.38 Nrf2 stability is regulated by both redox regulation through Keap1, and kinase regulation though the GSK-3/β-TrCP axis. Both are intimately connected, because electrophiles alter the balance between kinase and phosphatase activities. Nrf2 activity is maintained at low levels under normal homoeostatic conditions but increases rapidly in response to redox and electrophilic stressors as well as through stimulation by endogenous signaling pathways or xenobiotics.15,16 The nuclear translocation and accumulation of free Nrf2 is an essential signaling step for its function as a transcription factor promoting the induction of antioxidant and phase II detoxifying enzymes.38 In this study, a significant increase of nuclear Nrf2 was found in 200 μM uranium-treated kidney cells, and there was no cytotoxicity in these kidney cells. This indicates that Nrf2 could play a protective role against oxidative stress at this uranium dose level. This effect of Nrf2 may affect cellular GSH because Nrf2 controls both the basal level and rate of GSH biosynthesis.39 Decreased GSH levels may be due to its consumption by scavenging uranium-induced residual free radicals which escaped decomposition by the cellular antioxidant enzymes like CAT and SOD. However, we observed a paradoxical decline in the nuclear Nrf2 level in 400 or 800 μM uranium-administered kidney cells. Several factors may be responsible for the observed decline in the Nrf2 level. First, an intermediate or high oxidative stress from uranium exposure could cause potential alterations in the redox-sensing capacity of Keap1.40 It is also likely that xenobiotic uranium activates endogenous signaling pathways which are relevant to the GSK-3/β-TrCP axis in the regulation of Nrf2 protein stability. Second, the intermediate or high levels of oxidative stress could decrease or inhibit Nrf2 protein nuclear translocation and accumulation because the nuclear influx of Nrf2 protein may be determined by the intensity of oxidative stress.41 In addition, Nrf2 expression is itself controlled by ARE.42 The ARE sequence is present in the promoter region of the Nrf2 gene, and a decreased nuclear Nrf2 level would lead to lower transcription and protein expression of further Nrf2 in an auto-regulatory loop. Dysregulation which alters ARE-mediated gene transcription could detrimentally repress Nrf2 transcription.43 Nrf2 activity impairment has been demonstrated to accompany metal-induced toxicities such as those of chromium44 and arsenic.45
The naturally occurring signaling gasotransmitter, H2S, plays important roles in normal physiology and pathophysiology in various tissues including the kidneys.7,20 A reduction of endogenous H2S generation was observed in the rat renal ischemia reperfusion (I/R) model.46 However, an increased endogenous H2S level is reported to be involved in the kidney injuries of cisplatin- and gentamicin-contaminated rats.47,48 These results further indicate that H2S participates in the normal control of renal functions. As mentioned previously, the kidney is one of the major targets of uranium-induced toxicity, and uranium-induced nephrotoxicity is mainly involved in the renal proximal tubular epithelium cells.3,37 It is reported that uranium intoxication in SD rats decreased endogenous H2S production in the kidney homogenates.19 In this study, the endogenous H2S level was decreased in kidney cells that were subjected to 400 or 800 μM uranium administration, and this was accompanied by a marked reduction of H2S-synthesizing activity, and CBS and CSE gene expression. Upon an intermediate or high concentration of uranium intoxication in the kidney cells, the cell deterioration was evident as indicated by a reduction of cell viability, an increase of LDH release, and severe oxidative stress. The addition of exogenous H2S in uranium-intoxicated kidney cells decreased cell damage and ameliorated oxidative stress. Taken together, our results suggest that decreased biosynthesis of endogenous H2S and diminished H2S-producing enzymes in the kidney cells may reflect the system nature of H2S deficiency in uranium-induced kidney cell cytotoxicity.
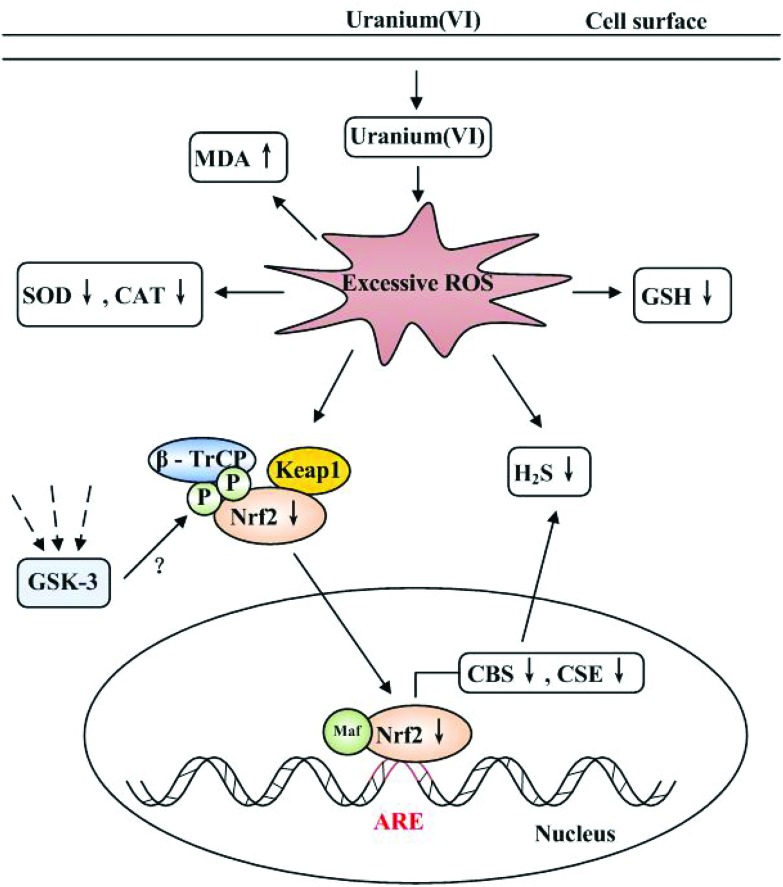
Recent studies show that H2S can regulate Nrf2 expression, nuclear translocation and accumulation to up-regulate the transcription of cytoprotective genes which contain ARE.49–52 CBS and CSE belong to the ARE gene group, since CBS and CSE contain the regulatory cis-acting elements 5′-GTGATCTAGCA-3′ and 5′-ATGAGGCAGCT-3′, respectively, in their promoter regions. These regulatory cis-acting elements are likely to function as an ARE to which Nrf2 can bind. In vitro studies indicate that Nrf2 can regulate CBS and CSE expression which are involved in the metabolism of H2S, and which mediate the cytoprotective effects of H2S.7,17,53 In this work, the severity of oxidative stress resulted in impaired antioxidant responses and cell deterioration in 400 or 800 μM uranium-intoxicated kidney cells. Under these circumstances, Nrf2 should have conferred protection against cell injury by orchestrating antioxidant responses to oxidative stress.38 However, Nrf2 activity (nuclear translocation and accumulation) in 400 or 800 μM uranium-treated kidney cells was reduced due to an intermediate or high oxidative stress. The direct inhibition of Nrf2 gene expression by siRNA in the kidney cells which were not intoxicated by uranium, reproduced the effects of uranium exposure. In addition, administration of an Nrf2 activator (sulforaphane) to 400 μM uranium-intoxicated kidney cells restored the expression of Nrf2 and H2S-producing enzymes, and the endogenous H2S level. Based on these considerations, we propose that a decreased Nrf2 level could cause the down-regulation of H2S-producing enzymes, resulting in the reduction of the endogenous H2S level, as depicted in Fig. 8. This observation clearly illustrates the failure of the endogenous antioxidant defense system against the prevailing oxidative stress in uranium-treated kidney cells. Our findings are similar to those in previous reports by Aminzadeh and Vaziri54 and Kim and Vaziri.55 They confirmed that impaired Nrf2 activation decreased the endogenous H2S concentration, and down-regulation of H2S-generating enzymes in the kidney homogenates contributed to the severity of oxidative stress and the progression of renal tissue damage in the rat chronic kidney disease (CKD) model.
Fig. 8. Proposed mechanism of kidney cell cytotoxicity induced by uranium(vi) (uranyl acetate). When uranium enters into the kidney cells, excessive intracellular reactive oxygen species (ROS) are generated either by uranium radioactivity or chemical properties or both,34 which can alter the cellular redox state. This increases MDA content, depletes GSH levels, and impairs SOD and CAT activities. Excessive intracellular ROS decrease Nrf2 protein expression, nuclear translocation and accumulation. Reduced nuclear Nrf2 levels could mediate in the down-regulation of CBS and CSE gene expression, resulting in a reduction of endogenous H2S formation, which could be involved in uranium-induced kidney cell cytotoxicity. Likewise, excessive intracellular ROS directly decrease the level of ROS-scavenging endogenous H2S. Dotted lines represent endogenous signaling pathways that participate in the regulation of the GSK-3/β-TrCP axis.15,16 Whether these signaling pathways could be activated by uranium intoxication needs to be explored further.
In summary, we have demonstrated that decreased endogenous H2S production resulting from the down-regulation of H2S-producing enzymes mediated by a reduced Nrf2 level are involved in uranium-induced kidney cell cytotoxicity. The adverse effects on uranium-exposed kidney cells can be ameliorated by supplementary H2S generation and/or Nrf2 activation. These will afford potential preventive valve and effective treatment strategies to alleviate uranium poisoning at early stages of exposure.
Conflict of interest statement
The authors declare that there is no conflict of interest.
Acknowledgments
This research is supported by the Natural Science Foundation of Hunan Province (No. 14JJ2087), the National Natural Science Foundation of China (No. 81071005), the Natural Science Innovation Foundation for Postgraduate Students in the University of South China (No. CX2013B394), the Defense Industrial Technology Development Program (B3720132001) and Zhengxiang Scholar Program of the University of South China (2014-004).
References
- Brugge D., Buchner V. Rev. Environ. Health. 2011;26:231–249. doi: 10.1515/reveh.2011.032. [DOI] [PubMed] [Google Scholar]
- Vicente-Vicente L., Quiros Y., Pérez-Barriocanal F., López-Novoa J. M., López- Hernández F. J., Morales A. I. Toxicol. Sci. 2010;118:324–347. doi: 10.1093/toxsci/kfq178. [DOI] [PubMed] [Google Scholar]
- Leggett R. W. Health Phys. 1989;57:365–383. doi: 10.1097/00004032-198909000-00001. [DOI] [PubMed] [Google Scholar]
- Zamora M. L., Tracy B. L., Zielinski J. M., Meyerhof D. P., Moss M. A. Toxicol. Sci. 1998;43:68–77. doi: 10.1006/toxs.1998.2426. [DOI] [PubMed] [Google Scholar]
- Carriére M., Avoscan L., Collins R., Carrot F., Khodja H., Ansoborlo E., Gouget B. Chem. Res. Toxicol. 2004;17:446–452. doi: 10.1021/tx034224h. [DOI] [PubMed] [Google Scholar]
- Thiébault C., Carrière M., Milgram S., Simon A., Avoscan L., Gouget B. Toxicol. Sci. 2007;98:479–487. doi: 10.1093/toxsci/kfm130. [DOI] [PubMed] [Google Scholar]
- Kimura H., Shibuya N., Kimura Y. Antioxid. Redox Signaling. 2012;17:45–57. doi: 10.1089/ars.2011.4345. [DOI] [PMC free article] [PubMed] [Google Scholar]
- Kimura H. Amino Acids. 2011;41:113–121. doi: 10.1007/s00726-010-0510-x. [DOI] [PubMed] [Google Scholar]
- Whiteman M., Cheung N., Zhu Y., Chu S., Siau J., Wong B., Armstrong J., Moore P. Biochem. Biophys. Res. Commun. 2005;326:794–798. doi: 10.1016/j.bbrc.2004.11.110. [DOI] [PubMed] [Google Scholar]
- Yan S. K., Chang T., Wang H., Wu L., Wang R., Meng Q. H. Biochem. Biophys. Res. Commun. 2006;351:485–491. doi: 10.1016/j.bbrc.2006.10.058. [DOI] [PubMed] [Google Scholar]
- Lu M., Hu L. F., Hu G., Bian J. S. Free Radical Biol. Med. 2008;45:1705–1713. doi: 10.1016/j.freeradbiomed.2008.09.014. [DOI] [PubMed] [Google Scholar]
- Han W., Dong Z., Dimitropoulou C., Su Y. Antioxid. Redox Signaling. 2011;15:2121–2134. doi: 10.1089/ars.2010.3821. [DOI] [PMC free article] [PubMed] [Google Scholar]
- Kimura Y., Goto Y., Kimura H. Antioxid. Redox Signaling. 2010;12:1–13. doi: 10.1089/ars.2008.2282. [DOI] [PubMed] [Google Scholar]
- Peake B. F., Nicholson C. K., Lambert J. P., Hood R. L., Amin H., Amin S., Calvert J. W. Am. J. Physiol.: Heart Circ. Physiol. 2013;304:1215–1224. doi: 10.1152/ajpheart.00796.2012. [DOI] [PMC free article] [PubMed] [Google Scholar]
- Hayes J. D., Chowdhry S., Dinkova-Kostova A. T., Sutherland C. Biochem. Soc. Trans. 2015;43:611–620. doi: 10.1042/BST20150011. [DOI] [PubMed] [Google Scholar]
- Cuadrado A. Free Radicals Biol. Med. 2015;88:147–157. doi: 10.1016/j.freeradbiomed.2015.04.029. [DOI] [PubMed] [Google Scholar]
- Hourihan J. M., Kenna J. G., Hayes J. D. Antioxid. Redox Signaling. 2013;19:465–481. doi: 10.1089/ars.2012.4944. [DOI] [PubMed] [Google Scholar]
- Xia M., Chen L., Muh R. W., Li P. L., Li N. J. Pharmacol. Exp. Ther. 2009;329:1056–1062. doi: 10.1124/jpet.108.149963. [DOI] [PMC free article] [PubMed] [Google Scholar]
- Zheng J. F., Zhao T. T., Yuan Y., Hu N., Tang X. Q. Chem. – Biol. Interact. 2015;242:353–362. doi: 10.1016/j.cbi.2015.10.021. [DOI] [PubMed] [Google Scholar]
- Calvert J. W., Coetzee W. A., Lefer D. J. Antioxid. Redox Signaling. 2010;12:1203–1217. doi: 10.1089/ars.2009.2882. [DOI] [PMC free article] [PubMed] [Google Scholar]
- Li Y., Paonessa J. D., Zhang Y. PLoS One. 2012;7:1–7. [Google Scholar]
- Jensen J. S., Fan X., Guidot D. M. Am. J. Respir. Cell Mol. Biol. 2013;48:511–517. doi: 10.1165/rcmb.2012-0334OC. [DOI] [PMC free article] [PubMed] [Google Scholar]
- Kimura Y., Dargusch R., Schubert D., Kimura H. Antioxid. Redox. Signaling. 2006;8:661–670. doi: 10.1089/ars.2006.8.661. [DOI] [PubMed] [Google Scholar]
- Mitsuhashi H., Yamashita S., Ikeuchi H., Kuroiwa T., Kaneko Y., Hiromura K., Ueki K., Nojima Y. Shock. 2005;24:529–534. doi: 10.1097/01.shk.0000183393.83272.de. [DOI] [PubMed] [Google Scholar]
- Tyagi N., Moshal K. S., Sen U., Vacek T. P., Kumar M., Hughes Jr. W. M., Kundu S., Tyagi S. C. Antioxid. Redox. Signaling. 2009;11:25–33. doi: 10.1089/ars.2008.2073. [DOI] [PMC free article] [PubMed] [Google Scholar]
- LeBel C. P., Ischiropoulos H., Bondy S. C. Chem. Res. Toxicol. 1992;5:227–231. doi: 10.1021/tx00026a012. [DOI] [PubMed] [Google Scholar]
- Mossman T. J. Immunol. Methods. 1983;65:55–63. [Google Scholar]
- Taffs R. and Sitkovsky M., In vitro assays for mouse B and T lymphocyte function, in Current Protocols in Immunology, ed. J. E. Coligan, A. M. Kruisbeek, D. H. Margulies, E. M. Shevach and W. Strober, Greene Publishing, Wiley Interscience, New York, 1991, pp. 1–8. [Google Scholar]
- Papapetropoulos A., Pyriochou A., Altaany Z., Yang G., Marazioti A., Zhou Z., Jeschke M. G., Branski L. K., Herndon D. N., Wang R., Szabo C. Proc. Natl. Acad. Sci. U. S. A. 2009;106:21972–21977. doi: 10.1073/pnas.0908047106. [DOI] [PMC free article] [PubMed] [Google Scholar]
- Stipanuk M. H., Beck P. W. Bio. J. 1982;206:267–277. doi: 10.1042/bj2060267. [DOI] [PMC free article] [PubMed] [Google Scholar]
- Kabil O., Banerjee R. J. Biol. Chem. 2010;285:21903–21907. doi: 10.1074/jbc.R110.128363. [DOI] [PMC free article] [PubMed] [Google Scholar]
- Al kaddissi S., Frelon S., Eila A. C., Legeavy A., Gonzalez P., Coppin F., Orjollet D., Camilleri V., Beaugelin-Seiller K., Gibin R., Simon O. Ecotoxicol. Environ. Saf. 2012;80:266–272. doi: 10.1016/j.ecoenv.2012.03.010. [DOI] [PubMed] [Google Scholar]
- Kathren R. L., Burklin R. K. Health Phys. 2008;94:170–179. doi: 10.1097/01.HP.0000288043.94908.1f. [DOI] [PubMed] [Google Scholar]
- Pourahmad J., Ghashang M., Ettehadi H. I., Ghalandari R. Environ. Toxicol. 2006;21:349–354. doi: 10.1002/tox.20196. [DOI] [PubMed] [Google Scholar]
- Arzuaga X., Rieth S. H., Bathija A., Cooper G. S. J. Toxicol. Environ. Health. B. Crit. Rev. 2010;13:527–545. doi: 10.1080/10937404.2010.509015. [DOI] [PubMed] [Google Scholar]
- Prat O., Berenguer F., Malard V., Tavan E., Sage N., Steinmetz G., Quemeneur E. Proteomics. 2005;5:297–306. doi: 10.1002/pmic.200400896. [DOI] [PubMed] [Google Scholar]
- Mirto H., Barrouillet M. P., Henge-Napoli M. H., Ansoborlo E., Fournier M., Cambar J. Hum. Exp. Toxicol. 1999;18:180–187. doi: 10.1177/096032719901800308. [DOI] [PubMed] [Google Scholar]
- Kensler T. W., Wakabayashi N., Biswal S. Annu. Rev. Pharmacol. Toxicol. 2007;47:89–116. doi: 10.1146/annurev.pharmtox.46.120604.141046. [DOI] [PubMed] [Google Scholar]
- Higgins L. G., Kelleher M. O., Eggleston I. M., Itoh K., Yamamoto M., Hayes J. D. Toxicol. Appl. Pharmacol. 2009;237:267–280. doi: 10.1016/j.taap.2009.03.005. [DOI] [PubMed] [Google Scholar]
- Dinkova-Kostova A. T., Holtzclaw W. D., Cole R. N., Itoh K., Wakabayashi N., Katoh Y., Yamamoto M., Talalay P. Proc. Natl. Acad. Sci. U. S. A. 2002;99:11908–11913. doi: 10.1073/pnas.172398899. [DOI] [PMC free article] [PubMed] [Google Scholar]
- Bellezza I., Mierla A. S., Minelli A. Cancers. 2010;2:483–497. doi: 10.3390/cancers2020483. [DOI] [PMC free article] [PubMed] [Google Scholar]
- Kwak M. K., Itoh K., Yamamoto M., Kensler T. W. Mol. Cell Biol. 2002;22:2883–2892. doi: 10.1128/MCB.22.9.2883-2892.2002. [DOI] [PMC free article] [PubMed] [Google Scholar]
- Lee O. H., Jain A. K., Papusha V., Jaiswal A. K. J. Biol. Chem. 2007;282:36412–36420. doi: 10.1074/jbc.M706517200. [DOI] [PubMed] [Google Scholar]
- O'Hara K. A., Nemec A. A., Alam J., Klei L. R., Mossman B. T., Barchowsky A. J. Cell Physiol. 2006;209:113–121. doi: 10.1002/jcp.20710. [DOI] [PMC free article] [PubMed] [Google Scholar]
- Pi J., Diwan B. A., Sun Y., Liu J., Qu W., He Y., Styblo M., Waalkes M. P. Free Radicals Biol. Med. 2008;45:651–658. doi: 10.1016/j.freeradbiomed.2008.05.020. [DOI] [PMC free article] [PubMed] [Google Scholar]
- Xu Z., Prathapasinghe G., Wu N., Hwang S. Y., Siow Y. L., Omura K. Am. J. Physiol. Renal Physiol. 2009;297:27–35. doi: 10.1152/ajprenal.00096.2009. [DOI] [PubMed] [Google Scholar]
- Della C. F. H., Cunha F. Q., Costa R. S., Barbosa J. F., Boim M. A., Arnoni C. P., da Silva C. G., Coimbra T. M. Nephrol., Dial., Transplant. 2011;26:479–488. doi: 10.1093/ndt/gfq447. [DOI] [PubMed] [Google Scholar]
- Francescato H. D., Chierice J. R., Marin E. C., Cunha F. Q., Costa R. S., Silva C. G., Coimbra T. M. Braz. J. Med. Biol. Res. 2012;45:244–249. doi: 10.1590/S0100-879X2012007500016. [DOI] [PMC free article] [PubMed] [Google Scholar]
- Calvert J. W., Jha S., Gundewar S., Elrod J. W., Ramachandran A., Pattillo C. B., Kevil C. G., Lefer D. J. Circ. Res. 2009;105:365–374. doi: 10.1161/CIRCRESAHA.109.199919. [DOI] [PMC free article] [PubMed] [Google Scholar]
- Koike S., Ogasawara Y., Shibuya N., Kimura H., Ishii K. FEBS Lett. 2013;587:3548–3555. doi: 10.1016/j.febslet.2013.09.013. [DOI] [PubMed] [Google Scholar]
- Sykiotis G. P., Bohmann D. Dev. Cell. 2008;14:76–85. doi: 10.1016/j.devcel.2007.12.002. [DOI] [PMC free article] [PubMed] [Google Scholar]
- Yang G., Zhao K., Ju Y., Mani S., Cao Q., Puukila S., Khaper N., Wu L., Wang R. Antioxid. Redox Signaling. 2013;18:1906–1919. doi: 10.1089/ars.2012.4645. [DOI] [PubMed] [Google Scholar]
- Li L., Rose P., Moore P. K. Annu. Rev. Pharmacol. Toxicol. 2011;51:169–187. doi: 10.1146/annurev-pharmtox-010510-100505. [DOI] [PubMed] [Google Scholar]
- Aminzadeh M. A., Vaziri N. D. Nephrol., Dial., Transplant. 2012;27:498–504. doi: 10.1093/ndt/gfr560. [DOI] [PubMed] [Google Scholar]
- Kim H. J., Vaziri N. D. Am. J. Physiol. Renal Physiol. 2010;298:662–671. doi: 10.1152/ajprenal.00421.2009. [DOI] [PubMed] [Google Scholar]


