 Zinc oxide (ZnO) nanoparticles (NPs) have potential applications in cosmetics, food packaging and biomedicine but concerns regarding their safety need to be addressed.
Abstract
Zinc oxide (ZnO) nanoparticles (NPs) have potential applications in cosmetics, food packaging and biomedicine but concerns regarding their safety need to be addressed. In the present study, the immunotoxic potential of ZnO NPs was evaluated in different ages of BALB/c mice after sub-acute exposure. The cytokine release, immunophenotyping, distribution of ZnO NPs and ultrastructural changes were assessed. A significant (p < 0.05) change in the CD4- and CD8-cells, levels of IL-6, IFN-γ and TNF-α and reactive oxygen species were observed in aged mice. In juvenile mice, increase in reactive oxygen species and IL-6 and TNF-α levels was observed with no significant changes in adult mice. A significant (p < 0.05) increase in the expression levels of mitogen activated protein kinase (MAPK) cascade proteins such as phospho-ERK1/2, phospho-JNK and phospho-p38 were also induced in aged mice. Collectively, our results indicate that the aged mice are more susceptible to ZnO NP induced immunotoxicity.
Introduction
The unique physicochemical properties of nanoparticles (NPs) accounts for their increased applications in drug delivery, imaging, cosmetics, paints, food industry, etc.1 However when particles are reduced to the nano range, the reactivity increases due to increase in the surface area.2 The increase in reactivity can lead to an increase in toxicity thereby raising concerns on the usage of NPs.3
Zinc oxide (ZnO) NPs are one of the most widely used NPs in consumer products including cosmetics, pharmaceutical and paint industries. ZnO NPs provide protection from ultraviolet A and B radiation due to their high absorption and reflective properties, hence they are used in sunscreens and paints.4 ZnO NPs are also used as an anticancer therapeutic agent due to their photodynamic effect.5
Several studies of ZnO NPs in vitro have determined their cytotoxicity, cell membrane damage, increase in the levels of intracellular calcium, lipid peroxidation, oxidative DNA damage, expression of genes that are involved in apoptosis and oxidative stress responses.6–8 However, in vitro models alone are insufficient to predict possible hazards to humans due to limited cell–cell communication and unavailability of the cell matrix which is otherwise possible in a co-culture experimental setup.9–11 The in vivo evaluation of NP toxicity provides for a short-term or a long-term exposure with different routes of administration of NPs in organisms.12 Hence, in vivo studies are necessary to elucidate the effect, mechanisms, pathways and entry routes of NPs in a complex multicellular organism. Previous in vivo studies in mice have shown that on exposure, NPs get deposited in organs of the immune system such as spleen and lymph nodes.13,14 The adverse effects of NPs on the immune system could lead to inflammation, hypersensitivity, immunosuppression, immunostimulation, and autoimmunity. Therefore the interaction between ZnO NPs and immune cells is an important area of research. In addition there are only limited in vivo studies, and most of them are focused on the respiratory tract and oral exposure of ZnO NPs.8,15,16 The release of inflammatory cytokines and imbalance of Th-1/Th-2 cells17 are induced by ZnO NPs.18–21 Any change in the cell populations of the immune system (lymphocytes, T-cells, B-cells) is known to cause age-related immune dysfunctions. The studies on inbred laboratory animals have identified age related changes in immunity.22,23 It is therefore prudent to understand the risk associated with age on treatment with ZnO NPs.
The present study was undertaken to investigate the intraperitoneal toxicity of ZnO NPs. The immunomodulatory effect of ZnO NPs was investigated and their distribution in different tissues was determined. To understand the mechanism of inflammatory response, reactive oxygen species (ROS) was measured by using DCFDA dye in thymocytes. The pathological changes induced by ZnO NPs and their possible mechanism of action were also examined.
Experimental
Chemicals
Zinc oxide nanopowder (purity > 99%) used was from Sigma Chemical Co. Ltd (St Louis, MO, USA). A cytometric bead array Kit for TH1/TH2/TH17 cytokines and antibodies (anti-CD3-APC-Cy7, anti-CD4-FITC and anti-CD8a-PE) for immunophenotyping was purchased from BD Biosciences (San Diego, CA, USA). All other chemicals were procured locally and belonged to analytical reagent grade.
Particle characterization
The suspension of ZnO NPs in 0.9% saline was sonicated (Sonics Vibra cell, Sonics & Material Inc., New Town, USA) for 10 min. The average size of ZnO NPs (100 μg mL–1) in Milli-Q water was determined by transmission electron microscopy (TEM; Tecnai™ G2 Spirit, FEI, The Netherlands). The hydrodynamic diameter and zeta potential of ZnO NPs were determined using a Zetasizer Nano-ZS (Malvern instruments Ltd, Malvern, UK). Scanning electron microscopy (SEM; Quanta FEG 450, FEI Company, The Netherlands) was used to observe the particle morphology.
Animals and treatment
Inbred strains of male BALB/c mice [1 month (juvenile), 4 months (adult) and 18 months (aged)] were taken from the animal breeding house of the CSIR, Indian Institute of Toxicology Research (Lucknow, India). Experiments were planned and animals were cared for according to standard guidelines and were approved by the Institutional Animal Ethics Committee. The approval for the experimentation was also taken from the Institutional Animal Ethics Committee. The animals were kept in cages, in animal house and were maintained at a temperature of 23 ± 2 °C, and a humidity of 55 ± 5% under standard laboratory conditions of light and dark cycles (12–12 h). The animals were divided into 9 groups containing 6 mice each (Table 1). Animals were treated with ZnO NPs for 14 consecutive days.
Table 1. Experimental set up.
| Groups | Exposure |
| Juvenile mice | |
| Group 1 | Vehicle control (0.9% saline) |
| Group 2 | ZnO NPs (5 mg per kg b. wt.) |
| Group 3 | ZnO NPs (50 mg per kg b. wt.) |
| Adult mice | |
| Group 4 | Vehicle control (0.9% saline) |
| Group 5 | ZnO NPs (5 mg per kg b. wt.) |
| Group 6 | ZnO NPs (50 mg per kg b. wt.) |
| Aged mice | |
| Group 7 | Vehicle control (0.9% saline) |
| Group 8 | ZnO NPs (5 mg per kg b. wt.) |
| Group 9 | ZnO NPs (50 mg per kg b. wt.) |
All animals were weighed at the start and end of each treatment. After the treatment, the animals were sacrificed by cervical dislocation.
Coefficients of liver, spleen and thymus
The coefficients of liver, spleen and thymus were calculated as the ratio of wet weight of tissues to the body weight (b. wt.).
Serum isolation
Blood was collected in dry Eppendorf tubes and was kept at room temperature for 1 h. This led to clotting. Serum was separated by centrifugation at 3000g for 10 min and was stored at –80 °C.
Cytokine analysis
The serum samples from control and treated mice were estimated for cytokines using the BD™ cytometric bead array (CBA) mouse TH1/TH2/TH17 Cytokine Kit II according to the protocol described by BD Biosciences (San Jose, CA, USA). Samples were acquired in a flow cytometer (FACSCanto™ II, BD BioSciences, San Jose, CA, USA). The results were analyzed using FCAP Array™ software.24
Isolation of thymocytes
The thymus was removed from the BALB/c mice and kept in Roswell Park Memorial Institute (RPMI) 1640 medium. It was minced with tweezers by keeping it on ice to obtain the thymocytes. The isolated thymocytes were passed through a 100 μm nylon mesh filter to remove connective tissue and other lumps. The cells were then centrifuged at 376g for 10 min, and further washed twice in RPMI 1640 medium, and the pellet containing thymocytes was resuspended in 1× PBS.
Immunophenotyping
The isolated thymocytes (5 × 10⁶) were suspended in staining buffer (2% FBS in 1× PBS) and stained with APC-Cy7-conjugated anti-CD3, FITC-conjugated anti-CD4 and PE-conjugated anti-CD8 antibodies for 30 min at 4 °C. The stained cells were washed twice with wash buffer (0.2% FBS in 1× PBS). Centrifuged at 350g for 5 min and finally suspended in 500 μL ice cold wash buffer. The samples were kept on ice and analyzed within 1 h using a flow cytometer (FACS Canto™ II, BD BioSciences, San Jose, CA, USA). Analysis was done by gating the CD3+ population in a dot plot. The CD3+ population was further resolved into CD4 and CD8 subpopulations.
ROS measurement
ROS was measured as described by Shukla et al.25 The isolated thymocytes (2 × 10⁵) were washed with 1× PBS and suspended in 10 μM of DCFDA for 30 min at 37 °C. Cells were acquired using a flow cytometer (FACS Canto™ II, BD BioSciences, San Jose, CA, USA).24
Zn content analysis in different tissues
The Zn content was analysed in tissues of liver, spleen and thymus in all the age groups. The tissue was digested in concentrated nitric acid overnight, to which 5 mL of a mixture of concentrated nitric acid and perchloric acid (6 : 1) was added. The samples were heated at 80–90 °C until the solutions were colourless and clear. The volume of the concentrated solutions was made up to 5 mL with 1% nitric acid. The concentration of zinc in the digested samples was analyzed using an atomic absorption spectrophotometer (AAS; GBC Avanta, Sigma, Australia). The concentration of zinc was expressed as μg per g wet weight of the tissues. Before analysis, AAS was calibrated every time by running standard concentrations (0.25, 0.5 and 1 ppm) of zinc.8
Histopathological analysis
The liver, spleen and thymus of control and ZnO NP treated mice were fixed in 10% formalin in PBS for 24–48 h at room temperature. The tissue was dehydrated, cleaned in xylene and embedded in paraffin blocks. Thin sections of tissues (5–8 μm) were obtained and placed onto glass slides which were stained with hematoxylin–eosin and the images were captured using a light microscope (Leica microsystem, Germany).
Transmission electron microscopy
A part of the organ (liver, spleen and thymus) from the control and ZnO NP treated aged mice were cut into small pieces (1 mm) and fixed with 2.5% glutaraldehyde prepared in sodium cacodylate and kept overnight at 4 °C. Further steps were carried out as described in our previous study.24
Western blot
For western blot analysis, the liver of control and ZnO NP treated aged mice was taken and homogenized in CelLytic™ M Cell Lysis Reagent (Sigma Chemical Co. Ltd, St Louis, MO, USA) with Na-orthovanadate, Na-fluoride and protease inhibitor cocktail and further centrifuged at 21 000g for 30 min at 4 °C, and the supernatant was collected. The estimation of protein was done by the Bradford method.26 The protocol was performed as described.24 Proteins were resolved in SDS polyacrylamide gel electrophoresis and were transferred to polyvinylidene fluoride membranes. After blocking of the membrane, the blots were incubated with primary antibodies (1 : 1000) against c-fos, c-jun, nuclear factor kappa B (NF-κB), COX-2, nuclear factor erythroid 2-related factor 2 (Nrf2), phospho-ERK1/2, phospho-JNK, phospho-p38 and γ-tubulin (Abcam, UK) followed by incubation with a secondary anti-primary antibody bound to horseradish peroxidase for 1.5 h at room temperature (Abcam, UK). The protein bands were developed by using ImageQuantLAS 500 software (GE Healthcare Bio-Sciences AB, Sweden). γ-Tubulin served as the protein loading control. Image J software (NIH, USA) was used to quantify the western blot intensity.
Statistical analysis
For comparison between groups, Student's t-test and one-way analysis of variance (ANOVA) test were used (using Graph Pad Prism-3.0 Software). p < 0.05 and p < 0.01 were considered significant.
Results
Particle characterization
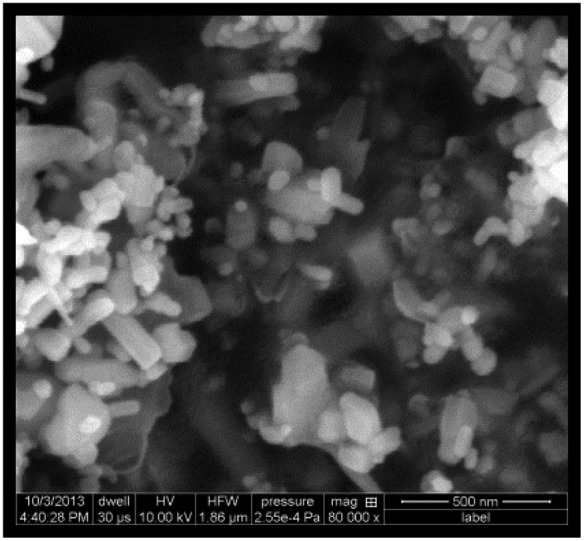
ZnO NPs were in the form of white solid nanopowder. The results are described in Table 2. The ZnO NPs were both rod shaped and spherical as observed in SEM. The specific surface area was 15–25 m2 g–1 (as mentioned by Sigma Chemical Co. Ltd, St Louis, MO, USA).24
Table 2. Characterization of ZnO NPs.
| Properties | ZnO NPs |
| Average diameter (TEM a ) | ∼20 nm |
| Hydrodynamic diameter (DLS b ) | 300.2 nm |
| Shape (SEM c ) |
|
| Purity | 99% |
| Surface area | 15–25 m2 g–1 |
| Zeta potential (DLS b ) | –25.3 mV |
aTransmission electron microscopy.
bDynamic light scattering.
cScanning electron microscopy.
Coefficients of liver, spleen and thymus
In juvenile and aged mice, significant differences (p < 0.05) were observed in the coefficients of thymus and liver respectively at the highest dose of ZnO NPs (50 mg per kg b. wt.). However, no significant changes in the b. wt. of mice of different age groups were observed after 14 days of ZnO NP exposure. Table 3.
Table 3. Effect of ZnO NPs on the mouse body weight and coefficients of liver, spleen and thymus after 14 days of exposure.
| Groups | Body weight |
Liver (mg wet weight per g b. wt.) | Spleen (mg wet weight per g b. wt.) | Thymus (mg wet weight per g b. wt.) | |
| Before (g b. wt.) | After (g b. wt.) | ||||
| Juvenile | |||||
| Vehicle control | 21.33 ± 0.67 | 24.67 ± 0.33 | 58.11 ± 1.29 | 6.58 ± 0.21 | 3.58 ± 0.09 |
| ZnO NPs (5 mg per kg b. wt.) | 20.67 ± 0.67 | 23.67 ± 0.88 | 59.38 ± 1.50 | 6.95 ± 0.10 | 3.80 ± 0.07 |
| ZnO NPs (50 mg per kg b. wt.) | 20.67 ± 0.67 | 22.67 ± 0.67 | 61.79 ± 1.67 | 7.09 ± 0.04 | 3.92 ± 0.03* |
| Adult | |||||
| Vehicle control | 30.67 ± 0.67 | 34.67 ± 0.33 | 54.46 ± 1.34 | 5.62 ± 0.39 | 2.32 ± 0.14 |
| ZnO NPs (5 mg per kg b. wt.) | 30.33 ± 0.33 | 33.33 ± 0.88 | 58.84 ± 0.87 | 5.89 ± 0.30 | 2.55 ± 0.04 |
| ZnO NPs (50 mg per kg b. wt.) | 30.67 ± 0.67 | 32.67 ± 0.67 | 58.89 ± 1.48 | 5.96 ± 0.21 | 2.62 ± 0.07 |
| Aged | |||||
| Vehicle control | 44.67 ± 0.33 | 48.67 ± 0.67 | 45.97 ± 1.78 | 4.10 ± 0.22 | 1.52 ± 0.05 |
| ZnO NPs (5 mg per kg b. wt.) | 44.00 ± 0.58 | 46.00 ± 0.58 | 48.02 ± 1.37 | 4.66 ± 0.06 | 1.62 ± 0.10 |
| ZnO NPs (50 mg per kg b. wt.) | 44.67 ± 0.33 | 45.67 ± 0.33 | 53.32 ± 1.39* | 4.68 ± 0.26 | 1.64 ± 0.07 |
Cytokine analysis
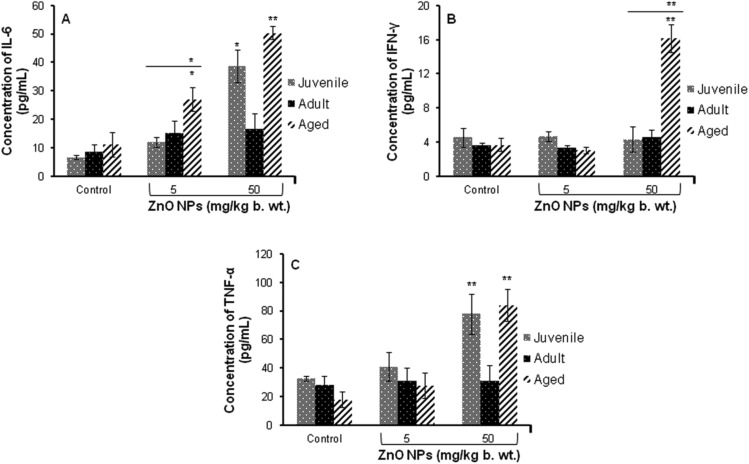
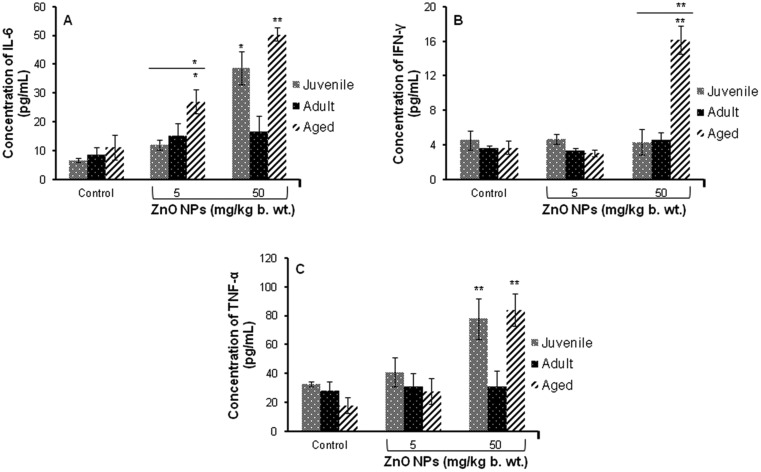
A significant (p < 0.05, p < 0.01) increase in the levels of inflammatory cytokine (IL-6, IFN-γ and TNF-α) in juvenile and aged mice was observed when exposed to ZnO NPs (50 mg per kg b. wt.). When compared between the age groups of mice, a significant change was observed in aged mice (Fig. 1). Moreover, a significant increase (p < 0.05, p < 0.01) in the levels of IL-6 and TNF-α was observed in aged mice when compared to juvenile and adult mice as shown in Fig. 1A–C.
Fig. 1. ZnO NP induced release of cytokines in serum of BALB/c mice (A) IL-6, (B) IFN-γ, (C) TNF-α. Data represents the mean ± S.E.M. of six animals in each group. *p < 0.05, **p < 0.01 when compared to the control. The horizontal line above indicates a comparison between the different age groups of mice.
Immunophenotyping
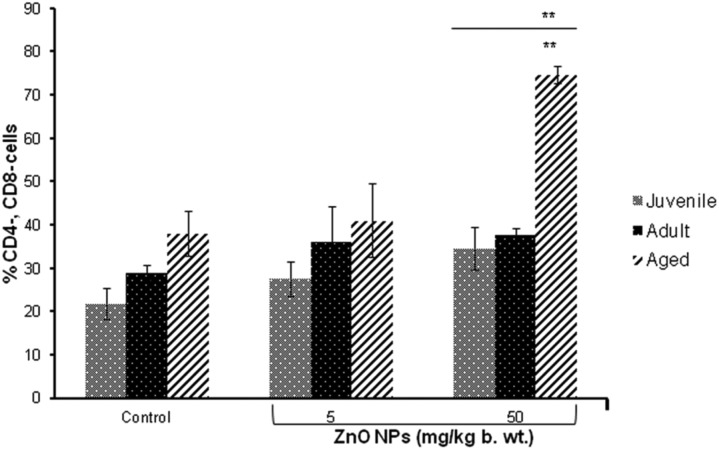
No significant change in the percentage of CD3+ cells was observed. However, significant (p < 0.01) increase in the number of both CD4- and CD8-cells was observed in aged mice treated with ZnO NPs (50 mg per kg b. wt.) when compared to the control. Additionally, a significant increase (p < 0.01) in both CD4- and CD8- was observed in aged mice when compared to juvenile and adult mice (Fig. 2).
Fig. 2. The bar graph shows the distribution of T cells (CD4- and CD8-) after intraperitoneal exposure of ZnO NPs for 14 days. Data represents mean ± S.E.M. of six animals in each group. **p < 0.01 when compared to the control. The horizontal line above indicates a comparison between the different age groups of mice.
ROS determination
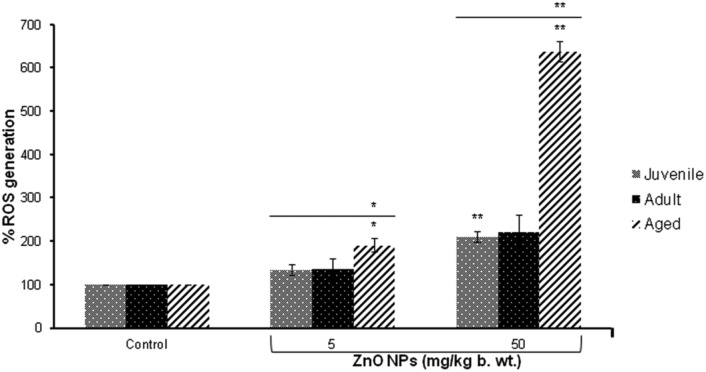
A significant (p < 0.01) induction in the release of ROS was observed at the highest dose (50 mg per kg b. wt.) in the thymocytes of juvenile and aged mice compared to the control group. When compared between the three different age groups of mice, a significant (p < 0.05, p < 0.01) increase in ROS was observed in ZnO NP (5 and 50 mg per kg b. wt.) exposed aged mice (Fig. 3).
Fig. 3. Release of reactive oxygen species in thymocytes following the intraperitoneal exposure of ZnO NPs for 14 days in BALB/c. Data represents mean ± S.E.M. of six animals in each group. *p < 0.05, **p < 0.01 when compared to the control. The horizontal line above indicates a comparison between the different age groups of mice.
Zn content analysis
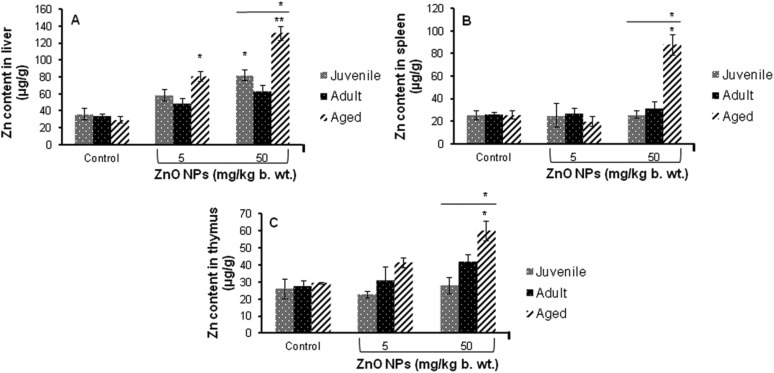
A significant (p < 0.05) increase in the levels of Zn was found in the liver, spleen and thymus of aged mice treated with 50 mg per kg b. wt. ZnO NPs for 14 days when compared to the control. No increase in the Zn content was found in these organs in adult mice while a significant (p < 0.05) increase in the Zn content was found only in the liver of juvenile mice (Fig. 4).
Fig. 4. Zinc content in different tissues of the BALB/c mice after intraperitoneal exposure of ZnO NPs for 14 days, (A) liver, (B) spleen and (C) thymus. Data represents the mean ± S.E.M. *p < 0.05, **p < 0.01 when compared to the control. The horizontal line above indicates a comparison between the different age groups of mice.
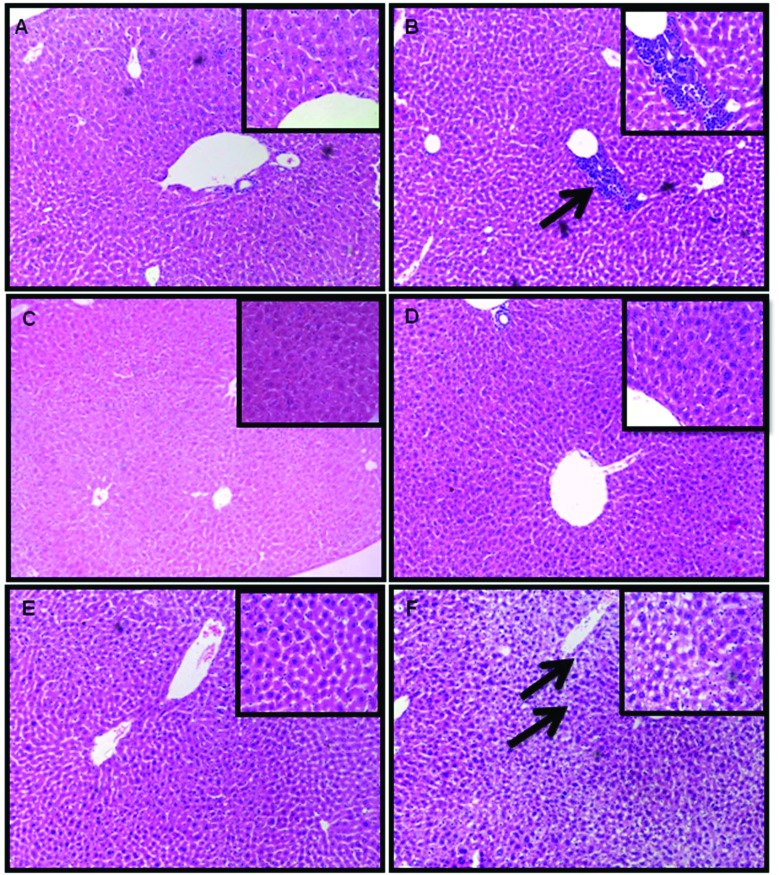
Histopathological changes
The liver of juvenile and aged mice exposed to ZnO NPs (50 mg per kg b. wt.) for 14 consecutive days showed pathological lesions (Fig. 5). No changes were observed in the spleen and thymus (data not shown). The infiltration of inflammatory cells like lymphocytes, neutrophils and macrophages was observed in the liver of ZnO NP treated juvenile mice (Fig. 5B) while the liver of ZnO NP treated aged mice revealed vacuole formation and increase in sinusoidal spaces (Fig. 5F). However no pathological alterations were observed in the liver of ZnO NP treated adult mice (Fig. 5D).
Fig. 5. Histopathological changes in the liver tissue of BALB/c mice after 14 days of intraperitoneal administration of ZnO NPs. (A) Control juvenile group, (B) ZnO NP (50 mg per kg b. wt.) juvenile group, (C) control adult group, (D) ZnO NP (50 mg per kg b. wt.) adult group, (E) control aged group and (F) ZnO NP (50 mg per kg b. wt.) aged group. Sections were stained with hematoxylin and eosin and observed under a light microscope at a magnification of ×100 and ×400 (inset). Pathological alterations are indicated by black arrows.
Distribution of ZnO NPs and ultrastructural alterations determined by TEM
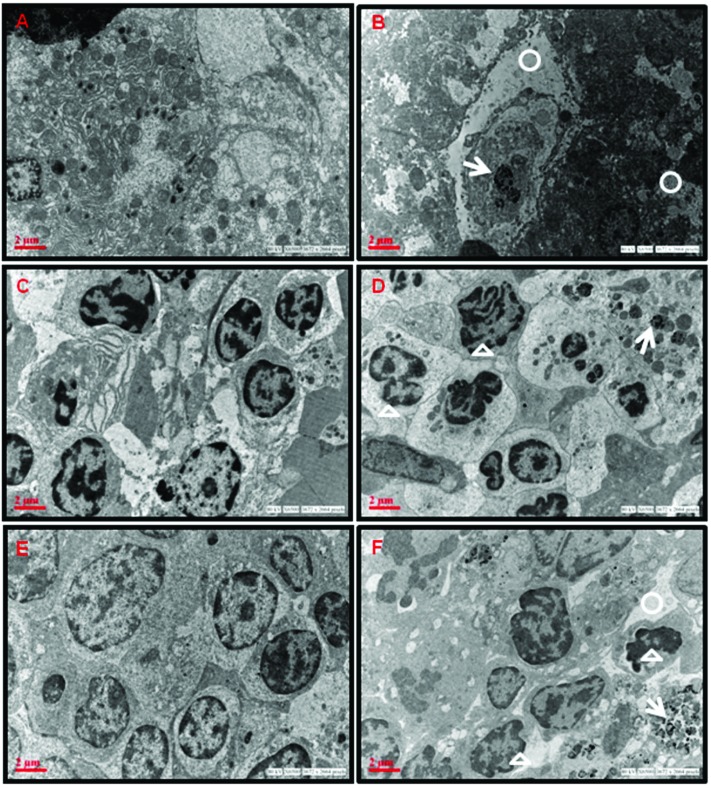
The accumulation of ZnO NPs and ultrastructural alterations were observed in the cells of liver, spleen and thymus of aged mice exposed to ZnO NPs (50 mg per kg b. wt.) as evident from the electron photomicrographs (Fig. 6). Accumulation of ZnO NPs was seen in the cytoplasm of treated aged mice. ZnO NPs were visible in the hepatocytes as black electron-dense spots along with increase in vacant spaces in the cytoplasm (Fig. 6B).
Fig. 6. TEM photomicrographs showing ZnO NP accumulation and ultrastructural changes in aged BALB/c mice administered with ZnO NPs for 14 days. (A) Control liver, (B) ZnO NP (50 mg per kg b. wt.) administered liver, (C) control spleen, (D) ZnO NP (50 mg per kg b. wt.) administered spleen, (E) control thymus and (F) ZnO NP (50 mg per kg b. wt.) administered thymus. White circles indicate increase in vacant spaces in the cytoplasm, white arrows indicate the presence of ZnO NPs and white triangles indicate nuclear fragmentation.
The splenocytes from untreated control mice show normal cellular features while the splenocytes of ZnO NP administered aged mice show nuclear fragmentation (Fig. 6C and D).
In the thymus of control mice, the thymocytes were closely packed with large nuclei while the ZnO NP administered thymocytes show condensed chromatin, with a deformed nucleus. It also showed irregular cell outlines (Fig. 6E and F).
Western blot analysis
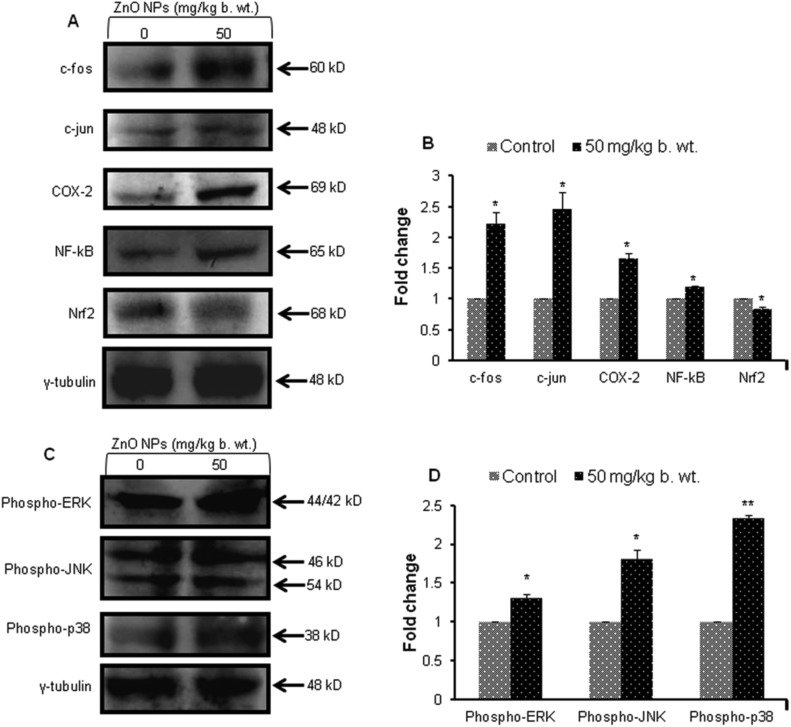
A significant (p < 0.05, p < 0.01) increase in the levels (1.2–2.5) of inflammatory marker proteins (COX-2) and transcription factor (NF-κB and AP-1 (c-fos and c-jun)) was observed in the liver of aged mice exposed to ZnO NPs (50 mg per kg b. wt.). The expression of the Nrf2 protein was significantly (p < 0.05) decreased by ZnO NPs, thereby modulating the antioxidant defence mechanism in the liver (Fig. 7A and B).
Fig. 7. Western blot analysis of liver proteins from aged mice administered with ZnO NPs (50 mg per kg b. wt.). (A) c-fos, c-jun, COX-2, NF-κB, Nrf2 (C) MAPK signalling proteins (phospho-ERK1/2, phospho-JNK and phospho-p38) and their corresponding bar graphs showing their densitometric analysis (B and D). γ-Tubulin was used as internal control. Data represents the mean ± S.E.M. of three animals in each group. *p < 0.05 when compared to the control aged mice.
A 1.3, 1.8 and 2.4 fold increase in phosphorylated extracellular signal-regulating kinase (ERK1/2), phosphorylated c-Jun N-terminal kinase (JNK) and phosphorylated p38 was observed in ZnO NP treated aged mice (Fig. 7C and D). The expression profile of γ-tubulin was used as an internal control in all the samples.
Discussion
ZnO NPs are known to be cytotoxic and genotoxic in vitro and in vivo.8,24,27,28 However, there is a lack of information where the immunomodulatory effects of ZnO NPs are concerned. In vivo tests are preferred for the toxicological evaluation as an in vitro system cannot mimic the complexity of cell–cell interactions. In the present study, BALB/c mice were chosen as the in vivo model due to their immune-competence and similarity with human metabolic, biochemical and physiological pathways.29
Understanding the physical and chemical properties of NPs is essential to study the biological effects of the NPs.30 The mean hydrodynamic diameter of ZnO NPs was 300.2 nm as measured by DLS and the average size calculated by TEM was ∼20 nm. This difference in sizes is due to the different principles involved in the two measurement techniques.8,31
No mortality was observed in either the control or ZnO NP treated BALB/c mice. Moreover no statistically significant difference in b. wt. was observed between the control and treated groups. This suggests that the exposure did not lead to any major visible changes in the health condition of animals.
The immunotoxic potential of ZnO NPs in vivo was evaluated by studying the changes in the relative distribution of CD4 and CD8 T cells and cytokine release in the serum. The levels and types of cytokines released determine their role in the regulation of immune responses. The present study showed an increase in IL-6, IFN-γ and TNF-α suggesting the increase in inflammatory cytokines in aged and juvenile mice. The increase of IL-6 and TNF-α indicates the possibility of age-related chronic diseases.32 IL-6 is an important pro-inflammatory cytokine which mediates T-cell activation.33 TNF-α plays a role in regulation of immune cells. Hence, its increase denotes a threat to immune functioning in vivo. The imbalance between the Th1/Th2 cellular responses leads to the occurrence of many diseases.16 In the present study, a difference in sensitivity between the Th1 and Th2 responses to ZnO NPs was observed, where the Th1 immunity is observed to be slightly more sensitive. Our data showed that there were no significant changes in the level of IL-2, IL-4 and IL-17 in ZnO NP exposed BALB/c mice of different ages when compared with the control group (data not shown).
The cytokine profile of CD4 cells modulates the functions of the innate and adaptive immune system while CD8 cells cause cytotoxicity and monitor all the cells of the body.34 Therefore the ratio of CD4/CD8 reflects the immune status of the biological system. Immunophenotyping studies illustrated that ZnO NPs altered the relative proportions of the CD4- and CD8-T cells with respect to untreated control cells in aged mice. Lymphocyte phenotyping is suggested to be one of the most common indicators of immune cell dysfunction.35
Increase in ROS generation was observed in thymocytes of aged mice which indicated that oxidative stress is a key factor in ZnO NP induced toxicity.36,37 The Nrf2 protein regulates the cellular resistance to oxidants. Our western blot data shows that there is a decrease in the expression of the transcription factor, Nrf2, which clearly indicates that there is an increase in oxidative stress in aged liver tissue on administration of ZnO NPs.38
When ZnO NPs find their way into the body, they distribute themselves and get accumulated in different organs due to their small size. The ZnO NPs were found to have a maximum accumulation in the liver of aged mice after a 14 day exposure as observed by AAS data. This was further supported by TEM images where ZnO NPs were observed in the cytoplasm of the hepatocytes of aged mice. The deposited ZnO NPs are responsible for their induced toxicity in aged mice. The ultrastructural changes in the cells from the organs of ZnO NP treated aged mice show deleterious effects of NPs.
Furthermore, the histopathological investigations in the liver of the ZnO NP treated juvenile mice showed the infiltration of inflammatory cells while aged mice revealed vacuole formation and increase in sinusoidal spaces. Due to the intraperitoneal mode of exposure, the ZnO NPs enter the blood and then directly enter the liver. Hence, liver has been observed as one of the primary targets of ZnO NP exposure in both juvenile and aged mice showing pathological changes.8,39
Since maximum damage was observed in aged liver tissue compared to the spleen and thymus, the western blot studies were performed for the liver proteins. Our results show an increase in the levels of the COX-2 protein which indicates its induction due to a pro-inflammatory stimulus.40,41
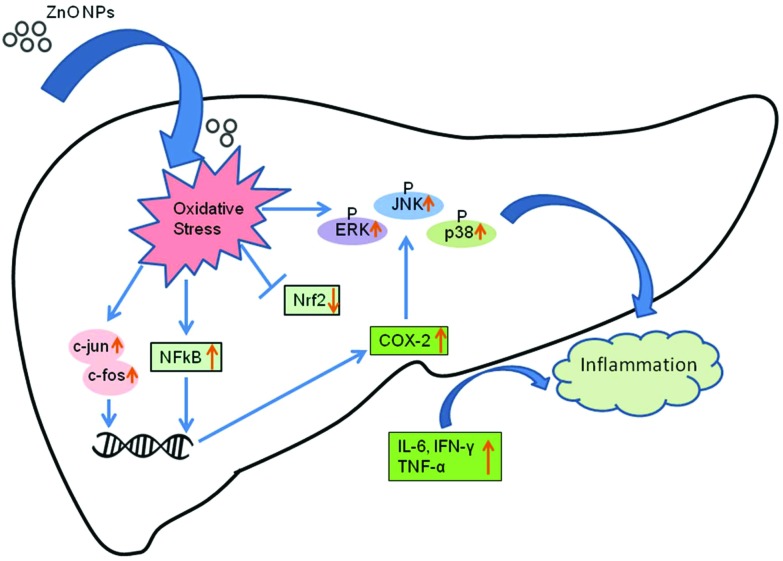
The activation of the MAPK signaling pathways was also observed along with the increase in expression of the transcription factor NF-кB.42,43 Extracellular signal-regulated protein kinases (ERK1/2), c-Jun N-terminal kinase (JNK1/2) and p38 kinases constitute the MAPK proteins. Our results showed that ZnO NP exposure increased the expression of phospho-ERK1/2, phospho-JNK and phospho-p38 in the aged treated mice. Oxidative stress modulates the expression of transcription factors NF-кB and AP-1 (c-fos and c-jun), which further explains the enhanced expression of inflammatory cytokines.
The inflammatory cytokines induce the increased expression of JNK, a major subgroup of MAPK. JNK is activated by MKK4 and MKK7 through phosphorylation on threonine-183 and tyrosine-185 residues.44 The ERK1/2 is induced by growth factors and mitogens through phosphorylation within a conserved threonine–glutamine–tyrosine motif. The protein p38 is also activated by inflammatory cytokines leading to its phosphorylation by MKK3 on threonine-180 and tyrosine-182 which regulate inflammation.45 Moreover the MAPK signaling cascades also regulate the release of inflammatory proteins such as COX-2. A possible pathway for ZnO NP induced inflammation in mouse liver is shown in Fig. 8.
Fig. 8. A schematic showing the possible mechanism of ZnO NP induced inflammatory response in mouse liver cells.
Conclusions
To our knowledge, this is the first study to report the age dependent immunotoxic effects of ZnO NPs through intraperitoneal administration. The findings of this study demonstrate that, compared to the juvenile and adult mice, the aged mice are more susceptible to ZnO NP induced immunotoxicity. This raises concerns particularly regarding the immunomodulatory effects of NPs in elderly and susceptible populations.
Conflict of interest
The authors do not have any conflicts of interest.
Acknowledgments
Violet A. Senapati is grateful to the Council of Scientific and Industrial Research (CSIR), New Delhi for Junior and Senior Research Fellowship. Funds received from the CSIR, New Delhi, projects NWP35 and NanoSHE (BSC0112), and the EU Framework Programme (FP7/2007-2013; NanoValid-Development of reference methods for hazard identification, risk assessment and LCA of engineered nanomaterials), grant number 263147, is greatly acknowledged. We also acknowledge the Gujarat Institute of Chemical Technology, India (project CENTRA), grant number (ILS/GICT/2013/003) for providing funds.
References
- Langer R. Acc. Chem. Res. 2000;33:94–101. doi: 10.1021/ar9800993. [DOI] [PubMed] [Google Scholar]
- Monteiller C., Tran L., MacNee W., Faux S., Jones A., Miller B., Donaldson K. J. Occup. Environ. Med. 2007;64:609–615. doi: 10.1136/oem.2005.024802. [DOI] [PMC free article] [PubMed] [Google Scholar]
- Nel A., Xia T., Madler L., Li N. Science. 2006;311:622–627. doi: 10.1126/science.1114397. [DOI] [PubMed] [Google Scholar]
- Steele A., Bayer I., Loth E. Nano Lett. 2009;9:501–505. doi: 10.1021/nl8037272. [DOI] [PubMed] [Google Scholar]
- Zhang H. J., Chen B. A., Jiang H., Wang C. L., Wang H. P., Wang X. M. Biomaterials. 2011;32:1906–1914. doi: 10.1016/j.biomaterials.2010.11.027. [DOI] [PubMed] [Google Scholar]
- Osman I. F., Baumgartner A., Cemeli E., Fletcher J. N., Anderson D. Nanomedicine. 2010;5:1193–1203. doi: 10.2217/nnm.10.52. [DOI] [PubMed] [Google Scholar]
- Sharma V., Anderson D., Dhawan A. Apoptosis. 2012;17:852–870. doi: 10.1007/s10495-012-0705-6. [DOI] [PubMed] [Google Scholar]
- Sharma V., Singh P., Pandey A. K., Dhawan A. Mutat. Res. 2012;745:84–91. doi: 10.1016/j.mrgentox.2011.12.009. [DOI] [PubMed] [Google Scholar]
- Rivera P. G., Oberdorster G., Elder A., Puntes V., Parak W. J. ACS Nano. 2010;4:5527–5531. doi: 10.1021/nn1025687. [DOI] [PubMed] [Google Scholar]
- Alfaro-Moreno E., Nawrot T. S., Vanaudenaerde B. M., Hoylaerts M. F., Vanoirbeek J. A., Nemery B., Hoet P. H. Eur. Respir. J. 2008;32:1184–1194. doi: 10.1183/09031936.00044008. [DOI] [PubMed] [Google Scholar]
- Rothen-Rutishauser B. M., Kiama S. G., Gehr P. Am. J. Respir. Cell Mol. Biol. 2005;32:281–289. doi: 10.1165/rcmb.2004-0187OC. [DOI] [PubMed] [Google Scholar]
- Simona C., Adriana F. Nanomaterials. 2015:93–121. [Google Scholar]
- Schipper M. L., Cheng Z., Lee S. W., Bentolila L. A., Iyer G., Rao J., Chen X., Wu A. M., Weiss S., Gambhir S. S. J. Nucl. Med. 2007;48:1511–1518. doi: 10.2967/jnumed.107.040071. [DOI] [PMC free article] [PubMed] [Google Scholar]
- Mohammad A. K., Amayreh L. K., Mazzara J. M., Reineke J. J. Pharm. Res. 2013;30:424–434. doi: 10.1007/s11095-012-0884-4. [DOI] [PubMed] [Google Scholar]
- Wang B., Feng W., Wang M., Wang T., Gu T., Zhu M., Ouyang H., Shi J., Zhang F., Zhao Y., Chai Z., Wang H., Wang J. J. Nanopart. Res. 2008;10:263–276. [Google Scholar]
- Wang J., Chen B., Jin N., Xia G., Chen Y., Zhou Y., Cai X., Ding J., Li X., Wang X. Int. J. Nanomed. 2011;6:605–610. doi: 10.2147/IJN.S16176. [DOI] [PMC free article] [PubMed] [Google Scholar]
- Liu Y., Jiao F., Qiu Y., Li W., Lao F., Zhou G., Sun B., Xing G., Dong J., Zhao Y., Chai Z., Chen C. Biomaterials. 2009;30:3934–3945. doi: 10.1016/j.biomaterials.2009.04.001. [DOI] [PubMed] [Google Scholar]
- Cho W. S., Duffin R., Poland C. A., Duschl A., Oostingh G. J., Macnee W., Bradley M., Megson I. L., Donaldson K. Nanotoxicology. 2012;6:22–35. doi: 10.3109/17435390.2011.552810. [DOI] [PubMed] [Google Scholar]
- Giovanni M., Yue J., Zhang L., Xie J., Ong C. N., Leong D. T. J. Hazard. Mater. 2015;297:146–152. doi: 10.1016/j.jhazmat.2015.04.081. [DOI] [PubMed] [Google Scholar]
- Heng B. C., Zhao X., Tan E. C., Khamis N., Assodani A., Xiong S., Ruedl C., Ng K. W., Loo J. S. Arch. Toxicol. 2011;85:1517–1528. doi: 10.1007/s00204-011-0722-1. [DOI] [PubMed] [Google Scholar]
- Roy R., Tripathi A., Das M., Dwivedi P. D. J. Biomed. Nanotechnol. 2011;7:110–111. doi: 10.1166/jbn.2011.1226. [DOI] [PubMed] [Google Scholar]
- Castle S. C. Clin. Infect. Dis. 2000;31:578–585. doi: 10.1086/313947. [DOI] [PubMed] [Google Scholar]
- Wang Y., Chen Z., Ba T., Pu J., Chen T., Song Y., Gu Y., Qian Q., Xu Y., Xiang K., Wang H., Jia G. Small. 2013;9:1742–1752. doi: 10.1002/smll.201201185. [DOI] [PubMed] [Google Scholar]
- Senapati V. A., Kumar A., Gupta G. S., Pandey A. K., Dhawan A. Food Chem. Toxicol. 2015;85:61–70. doi: 10.1016/j.fct.2015.06.018. [DOI] [PubMed] [Google Scholar]
- Shukla R. K., Kumar A., Vallabani N. V., Pandey A. K., Dhawan A. Nanomedicine. 2014;9:1423–1434. doi: 10.2217/nnm.13.100. [DOI] [PubMed] [Google Scholar]
- Bradford M. M. Anal. Biochem. 1976;72:248–254. doi: 10.1006/abio.1976.9999. [DOI] [PubMed] [Google Scholar]
- Kumar A., Najafzadeh M., Jacob B. K., Dhawan A., Anderson D. Mutagenesis. 2014;30:237–245. doi: 10.1093/mutage/geu064. [DOI] [PubMed] [Google Scholar]
- Sharma V., Shukla R. K., Saxena N., Parmar D., Das M., Dhawan A. Toxicol. Lett. 2009;185:211–218. doi: 10.1016/j.toxlet.2009.01.008. [DOI] [PubMed] [Google Scholar]
- Argmann C. A., Chambon P., Auwerx J. Cell Metab. 2005;2:349–360. doi: 10.1016/j.cmet.2005.11.002. [DOI] [PubMed] [Google Scholar]
- Powers K. W., Brown S. C., Krishna V. B., Wasdo S. C., Moudgil B. M., Roberts S. M. Toxicol. Sci. 2006;90:296–303. doi: 10.1093/toxsci/kfj099. [DOI] [PubMed] [Google Scholar]
- Dhawan A., Sharma V. Anal. Bioanal. Chem. 2010;398:589–605. doi: 10.1007/s00216-010-3996-x. [DOI] [PubMed] [Google Scholar]
- Singh T., Newman A. B. Ageing Res. Rev. 2011;10:319–329. doi: 10.1016/j.arr.2010.11.002. [DOI] [PMC free article] [PubMed] [Google Scholar]
- Sehgal P. B. J. Invest. Dermatol. 1990;94:2S–6S. doi: 10.1111/1523-1747.ep12874963. [DOI] [PubMed] [Google Scholar]
- Luckheeram R. V., Zhou R., Verma A. D., Xia B. Clin. Dev. Immunol. 2012;2012:925135. doi: 10.1155/2012/925135. [DOI] [PMC free article] [PubMed] [Google Scholar]
- Schwulst S. J., Muenzer J. T., Chang K. C., Brahmbhatt T. S., Coopersmith C. M., Hotchkiss R. S. J. Am. Coll. Surg. 2008;206:335–342. doi: 10.1016/j.jamcollsurg.2007.07.038. [DOI] [PubMed] [Google Scholar]
- Pati R., Mehta R. K., Mohanty S., Padhi A., Sengupta M., Vaseeharan B., Goswami C., Sonawane A. Nanomedicine. 2014;10:1195–1208. doi: 10.1016/j.nano.2014.02.012. [DOI] [PubMed] [Google Scholar]
- Saliani M., Jalal R., Goharshadi E. K. Nanomed. J. 2016;3:1–68. [Google Scholar]
- Ma Q. Annu. Rev. Pharmacol. Toxicol. 2013;53:401–426. doi: 10.1146/annurev-pharmtox-011112-140320. [DOI] [PMC free article] [PubMed] [Google Scholar]
- Cho W. S., Kang B. C., Lee J. K., Jeong J., Che J. H., Seok S. H. Part. Fibre Toxicol. 2013;10:9. doi: 10.1186/1743-8977-10-9. [DOI] [PMC free article] [PubMed] [Google Scholar]
- Park E. J., Roh J., Kim Y., Park K. Toxicol. Res. 2010;26:267–273. doi: 10.5487/TR.2010.26.4.267. [DOI] [PMC free article] [PubMed] [Google Scholar]
- Tsatsanis C., Androulidaki A., Venihaki M., Margioris A. N. Int. J. Biochem. Cell Biol. 2006;38:1654–1661. doi: 10.1016/j.biocel.2006.03.021. [DOI] [PubMed] [Google Scholar]
- Lu Y., Wahl L. M. J. Immunol. 2005;175:5423–5429. doi: 10.4049/jimmunol.175.8.5423. [DOI] [PubMed] [Google Scholar]
- Wang J., Deng X., Zhang F., Chen D., Ding W. Nanoscale Res. Lett. 2014;9:117. doi: 10.1186/1556-276X-9-117. [DOI] [PMC free article] [PubMed] [Google Scholar]
- Fleming Y., Armstrong C. G., Morrice N., Paterson A., Goedert M., Cohen P. Biochem. J. 2000;352:145–154. [PMC free article] [PubMed] [Google Scholar]
- Morrison D. K. Cold Spring Harbor Perspect. Biol. 2012;4:a011254. doi: 10.1101/cshperspect.a011254. [DOI] [PMC free article] [PubMed] [Google Scholar]


