 Mitochondrial impairment mediated apoptosis induced by graphene oxide in Saccharomyces cerevisiae.
Abstract
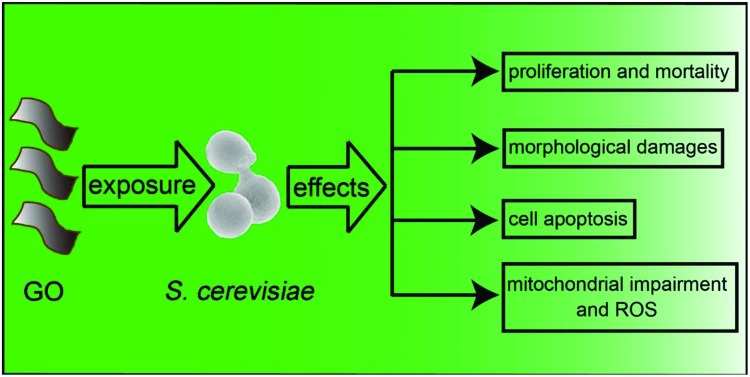
Using Saccharomyces cerevisiae as an experimental model, the potential toxicity of graphene oxide (GO) was evaluated following exposure to 0–600 mg L–1 for 24 h. The results showed that cell proliferation was observably inhibited and the IC50 value was 352.704 mg L–1. Mortality showed a concentration-dependent increase, and was 19.3% at 600 mg L–1. A small number of cells were deformed and shrunken after exposure. The percentage of late apoptosis/necrosis showed a significant increase (p < 0.01) at 600 mg L–1 (19.16%) compared with the control (1.14%). The mitochondrial transmembrane potential was significantly decreased (p < 0.01) at 50–600 mg L–1, indicating that the apoptosis was related to mitochondrial impairment. Moreover, ROS was observably increased (p < 0.01) at 200, 400 and 600 mg L–1. The expressions of apoptosis-related genes (SOD, Yca1, Nma111 and Nuc1) were significantly changed. The results presented so far indicate that GO has the potential to cause adverse effects on organisms when released into the environment.
1. Introduction
Graphene-based nanomaterials are promising candidates for many areas, and have been used in diverse commercial applications, such as electrochemical, optical, medical and biological applications.1,2 A market survey stated that the global graphene market was worth $12.2 million in 2014 and was expected to reach $159.2 million by 2023 (; http://www.transparencymarketresearch.com/graphene-market.html). As one of the first commercial and the most popular graphene-based nanomaterials, graphene oxide (GO) attracts tremendous research attention owing to its excellent properties.2–4 GO has been widely used in many fields, including nanocarriers,2 thin-films,4 sensors5 and catalysts.6 Moreover, advances in synthesis and modification make it suitable for more applications.1,3,7 Nevertheless, although GO possesses great potential for use in diverse applications, it is still younger in development compared with other nanomaterials.8 GO has the potential to affect the environment and human health due to its nano-sizes and special properties. Therefore, prior to the wide use of GO, it is imperative to investigate the potential hazards posed by GO. Such knowledge will be useful in the design of GO and its applications, and in managing risk in the future.
In recent years, several studies have evaluated the potential toxicity of GO to cells,9,10 bacteria11,12 and mice.13 However, the existing results are controversial and under much debate. For example, Chang et al. (2011) demonstrated that GO has no obvious toxicity to A549 cells,9 but Liu et al. (2011) reported that GO showed a high antibacterial activity.11 These disagreements may be caused by many factors, such as the size, shape and chemical modification of GO; especially, different organisms or cell types were used in the toxicity tests.8,12,14 Therefore, in order to obtain a better understanding of GO toxicity, representative organisms are essential.
As one of the most studied unicellular eukaryotic model organisms, Saccharomyces cerevisiae (S. cerevisiae) has been intensively used in molecular and cell biology due to its cellular structure and its functional organization has many similarities with other cells of higher-level organisms.15 The genome of S. cerevisiae was sequenced in 1996, and lots of genes are available for mechanistic studies.16 Importantly, S. cerevisiae shares major metabolic pathways with other eukaryotes and 30% of the known genes related to human diseases have yeast orthologues.17,18 Therefore, toxicity studies with S. cerevisiae will contribute to understanding toxicity in higher organisms, particularly in humans. Moreover, the inherent characteristics of S. cerevisiae make it an ideal model for toxicological assessment, for example, a short generation time and easy culture conditions. As it is a representative model for the study of oxidative stress, research studies on reactive oxygen species (ROS) mediated toxicity of nanomaterials on S. cerevisiae would provide new scientific knowledge on nanotoxicology that could be transferable to other higher-level organisms.19 For the past few years, a growing number of studies have investigated the effects of some nanomaterials on S. cerevisiae, such as ZnO, CuO, Al2O3 and CeO2.19–22 Furthermore, the potential toxicological effects of oxidized multi-walled carbon nanotubes (O-MWCNTs) on S. cerevisiae were investigated in our previous study. It can be verified that S. cerevisiae was undergoing apoptosis by a mitochondrial impairment pathway following exposure to O-MWCNTs.23 Nevertheless, the related information about toxicity effects of GO on S. cerevisiae is currently limited compared with other nanomaterials.
In this study, S. cerevisiae was used as an experimental model to elucidate the potential toxicity of GO. Based on previous data, it was hypothesized that: (i) cell viability and proliferation would be significantly changed; (ii) cells would undergo apoptosis; (iii) the apoptosis would be related to the mitochondrial impairment and the generation of ROS. The present study contributes to a better understanding of GO toxicity, and lays the foundation for the exploitation and application of GO in the future.
2. Materials and methods
2.1. Preparation and characterization of GO
GO was purchased from Chengdu Organic Chemicals Co., Ltd, Chinese Academy of Sciences (Chengdu, China) and the structural parameters are listed in Table 1. Characterization of GO was performed as described previously.24 Briefly, GO was characterized by scanning electron microscopy (SEM; Hitachi S-4800) and transmission electron microscopy (TEM; JEM-1200EX) with accelerating voltages of 18–20 and 100 kV, respectively. A Fourier transform infrared spectrometer (FTIR; Bruker Vetex70, Germany) was used to analyze the surface characteristics using the KBr pellet technique.25 To estimate the size distribution of GO in YPD medium, dynamic light scattering (DLS; Brookhaven BI-200SM, USA) was used.
Table 1. The structural parameters for GO.
| Parameter | Unit | GO |
| Thickness | nm | 0.55–1.2 |
| Purity | wt% | ≥99 |
| Layers | — | <3 |
| Diameter | μm | 0.5–3 |
2.2. Cultivation of S. cerevisiae
S. cerevisiae (JMY1) used throughout this work was maintained in our laboratory and cultivated in rich YPD medium (1% yeast extract, 2% peptone and 2% glucose) at 30 °C with constant shaking at 160 rpm.
2.3. Cell viability and proliferation assay
S. cerevisiae cells were cultivated in YPD medium with GO suspensions (0, 25, 50, 100, 200, 400 and 600 mg L–1) for 24 h. The initial culture concentration was 1–2 × 10⁵ cells per mL. In order to evaluate the influence of GO on cell viability, cells were collected and immediately stained with 1 mg mL–1 Trypan Blue (Sigma, USA) for 5 min. The number of stained cells and total cells was determined using an optical microscope (Olympus Optical Co., Ltd, Tokyo, Japan). Each treatment was repeated three times, and at least 500 cells were checked in each repetition. The mortality rate was calculated as the ratio between stained cells and total cells. In order to evaluate the effect of GO on cell proliferation, the number of cells was counted using a Neubauer hemocytometer under the optical microscope at 0, 3, 6, 9, 12, 15, 18, 21 and 24 h. Inhibition of growth was calculated as the ratio between the cell numbers of treatments and that of the control.
2.4. Scanning electron microscopy analysis
SEM was used to observe the attachment of GO and the potential damage to S. cerevisiae cells. In brief, cells were collected and washed with phosphate buffer solution (PBS; pH = 7.1) following exposure for 24 h at 600 mg L–1. The cells were adhered onto a piece of glass using polylysine and fixed with 2.5% glutaraldehyde in PBS at 4 °C for 12 h, and then thoroughly washed with PBS. Afterwards, cells were dehydrated through a graded ethanol series (30–90%, 2 × 100%; 15–20 min each) and replaced using isoamyl acetate. The sample was dried overnight and coated with a thin layer of gold, and observed using a Hitachi S-4800 SEM.26
2.5. Apoptosis assay
In order to differentiate and quantitate the early apoptosis and late apoptosis/necrosis, Annexin V/PI (Beyotime Biotech, Nantong, China) staining was performed according to previous studies.23,27 Briefly, after exposure to GO suspensions (0, 25, 50, 100, 200, 400 and 600 mg L–1) for 24 h, cells were separated from GO using density gradient centrifugation23 and approximately 1 × 10⁵ cells were collected. The staining and measurements were performed following the manufacturer's instructions. All samples were analyzed using flow cytometry (Beckman Coulter Inc., the United States). Forward light scatter (FSC), orthogonal light scatter (SSC), FITC fluorescence (FL1) and PI fluorescence (FL2) of each cell were quantitated with the Cell Quest Pro® software (BD, Germany).
2.6. Measurement of mitochondrial transmembrane potential
After exposure to GO suspensions (0, 25, 50, 100, 200, 400 and 600 mg L–1) for 24 h, cells were collected using density gradient centrifugation and washed with PBS. Mitochondrial transmembrane potential (MTP) was assessed using JC-1 (Beyotime Biotech, Nantong, China) according to a previous study.23 The detection was performed on a fluorescence stereomicroscope (Leica MZFL III, Germany) and a microplate reader (Multiskan MK3, Thermo Labsystems Co., Beverly, MA).
2.7. Measurement of ROS
The generation of ROS in cells following exposure to GO suspensions (0, 25, 50, 100, 200, 400 and 600 mg L–1) for 24 h was measured using the fluorogenic probe dichlorofluorescein-diacetate (DCFH-DA; Beyotime Biotech, Nantong, China). Briefly, after incubation, S. cerevisiae cells were separated from GO using density gradient centrifugation. For the fluorescence stereomicroscopy (Leica MZFL III, Germany) analysis, approximately 1 × 10⁵ cells were incubated with 1 mL DCFH-DA stock solution (10 μM) at 30 °C in the dark, and washed three times with cold PBS after 30 min. The fluorescence was immediately observed at an excitation wavelength of 480 nm and an emission wavelength of 530 nm. For the microplate reader (Multiskan MK3, Thermo Labsystems Co., Beverly, MA) analysis, approximately 1 × 10⁷ cells were collected. An equal volume of glass beads (0.3–0.4 mm) was mixed with the cells, and then cells were ruptured by vigorous vortexing. After rupture, the homogenates were centrifuged at 12 000 rpm at 4 °C for 10 min, and then the supernatant was collected for ROS measurements. The fluorescence was detected using the microplate reader with excitation and emission at 485 and 530 nm, respectively.
2.8. Expression of apoptosis-related genes
To evaluate the expressions of apoptosis-related genes (SOD, Yca1, Nma111 and Nuc1), real-time PCR using ribosomal 18S RNA (18S rRNA) as the internal standard was performed according to a previous study.23 In brief, after exposure, cells were separated from GO using density gradient centrifugation and approximately 1 × 10⁶ cells were collected. Trizol Reagent (Invitrogen, Carlsbad, CA) was used to extract total RNA according to the manufacturer's instructions. RNA integrity and concentration were measured using a NanoDrop spectrophotometer (ND-1000, NanoDrop Technologies Inc., Wilmington, DE). A SYBR Premix Ex Taq II kit (Takara, Dalian, China) and a CFX96 Real-Time PCR Detection System (Bio-Rad, Hercules, CA) were utilized for real-time PCR. The following cycling conditions were run: initial denaturation at 95 °C for 5 min, 40 cycles of 95 °C denaturation for 20 s, 57 °C annealing for 20 s and 72 °C elongation for 20 s. Melting curves were analyzed for all the reactions. Relative expression was obtained by using the 2–ΔΔCt method28 and normalized to the expression of the internal standard gene 18S rRNA in the same sample.
2.9. Statistical analysis
All of the treatments were carried out at least three times, and the data were expressed as the mean ± standard deviation (SD). The IC50 value and related 95% confidence limit were calculated using the Probit method. To perform statistical analysis, the SPSS Version 11.0 software package (SPSS Inc., Chicago, IL) was used. Data were analyzed for differences between the controls and treatments using one-way ANOVA followed by a Tukey's test, where p < 0.05 was considered statistically significant.
3. Results and discussion
3.1. GO characterization
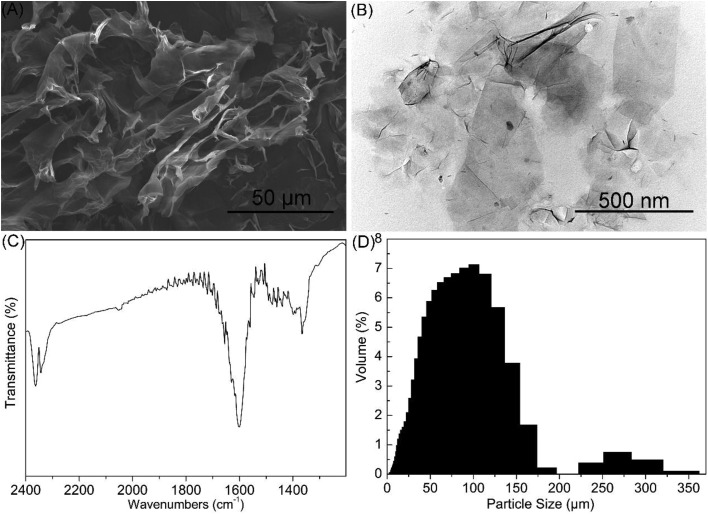
The physicochemical properties of GO, such as size, particulate state and surface functional groups, have been verified to have profound impacts on its toxicity.8,12 For example, Liu et al. (2012)12 evaluated the influence of lateral sizes of GO on its antibacterial activity. They demonstrated that larger GO sheets possessed a stronger antibacterial activity than smaller GO sheets. In this study, the physicochemical properties of GO were analyzed using SEM, TEM, FTIR and DLS. As shown in Fig. 1A and B, GO was composed of monolayers with irregular-shaped pieces. The monolayers were smooth with small wrinkles at the edges. As shown in Fig. 1C, the FTIR spectrum showed that GO exhibited the peaks of C–O (VC–O, around 2360 cm–1) and C–OH (VC–OH, around 1365 cm–1), indicating that GO contained hydroxyl and carboxyl groups.29–31 Moreover, the skeletal vibrations from unoxidized graphitic domains can be identified from the spectrum (around 1600 cm–1), indicating that some unoxidized graphene was residual in GO. DLS data (Fig. 1D) showed that the diameter of GO in YPD medium ranged from 0.3 to 375 μm with an average diameter of 76.42 μm. The result indicated that GO was rapidly aggregated into micrometre-size particles in YPD medium. Nevertheless, the DLS data cannot reveal the real size due to the anisotropic morphology and the monolayer structure of GO.10,32
Fig. 1. Characterization of GO. SEM image (A), TEM image (B) and FTIR spectrum (C) of GO. (D) Size distributions of GO in YPD medium detected by DLS.
3.2. Cell viability and proliferation
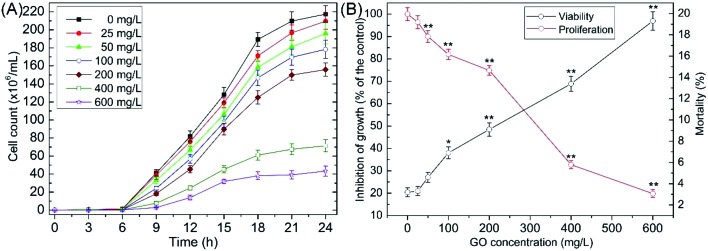
As shown in Fig. 2A, a dose-dependent decrease in cell numbers relative to the control was caused by GO. Cell proliferation was observably inhibited (p < 0.01) at 50–600 mg L–1 after exposure for 24 h (Fig. 2B). The IC50 value (concentration of GO required to inhibit the growth rate by 50%) was 352.704 (325.854–382.807) mg L–1. Mortality showed a concentration-dependent increase and notably increased (p < 0.01) at 200, 400 and 600 mg L–1 (Fig. 2B). In our previous study, we evaluated the toxicological effects of O-MWCNTs on S. cerevisiae and demonstrated that cell viability and proliferation were significantly changed after exposure to O-MWCNTs.23 After O-MWCNTs exposure for 24 h, the mortality was 16.6% at 600 mg L–1, which was slightly lower than the mortality (19.3%) following treatment with GO at 600 mg L–1. The result indicated that GO and O-MWCNTs showed analogous toxicity profiles.
Fig. 2. (A) Growth curves of S. cerevisiae exposed to 0–600 mg L–1 GO suspensions. (B) Effects of GO on cell proliferation and viability. Values are presented as the mean ± SD. Values that are significantly different from the control are indicated by asterisks (one-way ANOVA, *p < 0.05; **p < 0.01).
3.3. SEM analysis
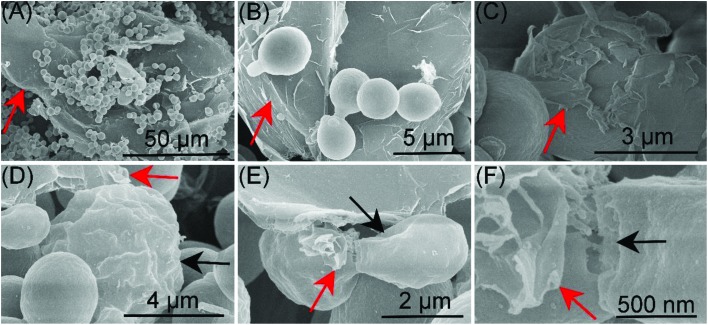
The antibacterial activity of GO has been reported by some studies, and disruption of the bacterial cell membrane has been proposed to be involved in the toxicity.11,12 In order to determine whether the antifungal effect is similar to that shown in previous studies, we checked the GO effect on the surfaces of S. cerevisiae using SEM. As shown in Fig. 3A and B, cells attached on the GO sheets. Moreover, some GO sheets wrapped around the cell surfaces (Fig. 3C). The surfaces of some cells were deformed and shrunken (Fig. 3D and E) after exposure. Besides, the gemmation was disturbed by GO (Fig. 3F). However, only a small number of the cells were damaged and the relative frequency of morphological response was about 6–8% at 600 mg L–1. Liu et al., (2011)11 demonstrated that the membrane of Escherichia coli was seriously flattened and lost its integrity after exposure to GO. The disagreement may be due to the fact that S. cerevisiae has a rigid cell wall, and the cell wall can protect S. cerevisiae from GO exposure.
Fig. 3. GO (red arrows) effect on the surfaces of S. cerevisiae. (A and B) S. cerevisiae cells attached on the GO sheets. (C) GO sheets wrapped around the cell surfaces. Cells were deformed and shrunken (black arrow; D, E), and the gemmation was disturbed (black arrow; F) after exposure to GO.
3.4. Apoptosis of cells
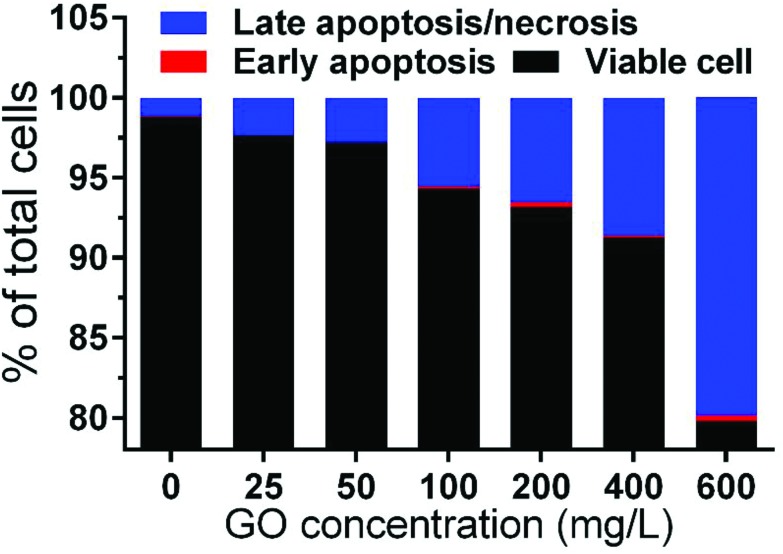
Apoptosis is a highly regulated form of programmed cell death crucial for metazoan development. In contrast, necrosis is a form of cell death that results from overwhelming cellular injury, cells lyse and release cytoplasmic material.33 To examine whether GO can induce cellular apoptosis/necrosis, Annexin V/PI staining was performed and analyzed by flow cytometry (Fig. 4). Only a few cells had undergone early apoptosis even at 600 mg L–1 (0.37%). Nevertheless, for late apoptosis/necrosis, it showed a significant increase (p < 0.01) at 600 mg L–1 (19.16%) compared with the control (1.14%). The result indicated that the increase of mortality was related to the late apoptosis/necrosis, which is in accordance with previous studies.23,34
Fig. 4. The percentage of viable, early apoptosis and late apoptosis/necrosis cells after exposure to 0–600 mg L–1 GO suspensions for 24 h.
3.5. MTP measurement
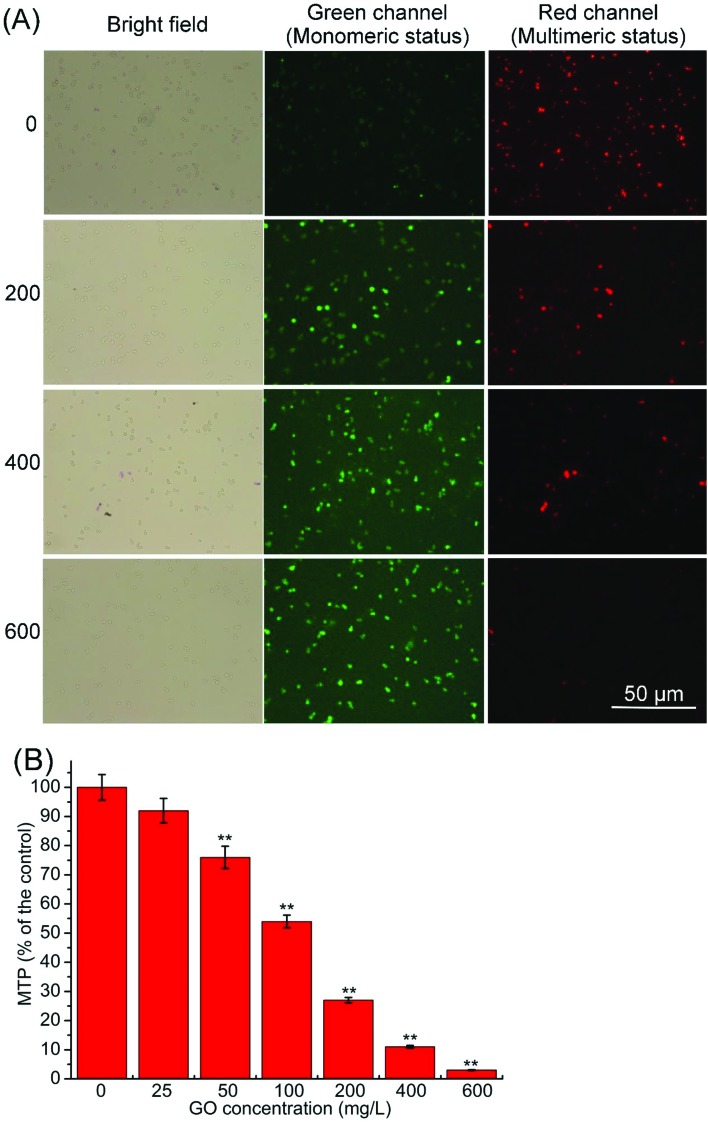
Mitochondria play a crucial role in the process of apoptosis and the reduction in MTP is an early step in the apoptotic process.35,36 In a previous study, we showed that MTP was strikingly decreased after exposure to O-MWCNTs. Moreover, O-MWCNTs induced S. cerevisiae apoptosis via a mitochondrial impairment pathway.23 In this study, as shown in Fig. 5A, MTP was strikingly decreased as indicated by the weaker red fluorescence and stronger green fluorescence with the GO concentration increased. Fig. 5B illustrates the percentage decrease of MTP compared with the control. MTP showed a dose-dependent decrease, and was significantly decreased (p < 0.01) at 50–600 mg L–1. This result indicated that the apoptosis induced by GO was related to mitochondrial impairment.
Fig. 5. Mitochondrial transmembrane potential (MTP) of S. cerevisiae cells was evaluated using JC-1 and measured using the fluorescence stereomicroscope (A) and the microplate reader (B). Values are presented as the mean ± SD. Values that are significantly different from the control are indicated by asterisks (one-way ANOVA, **p < 0.01).
3.6. ROS measurement
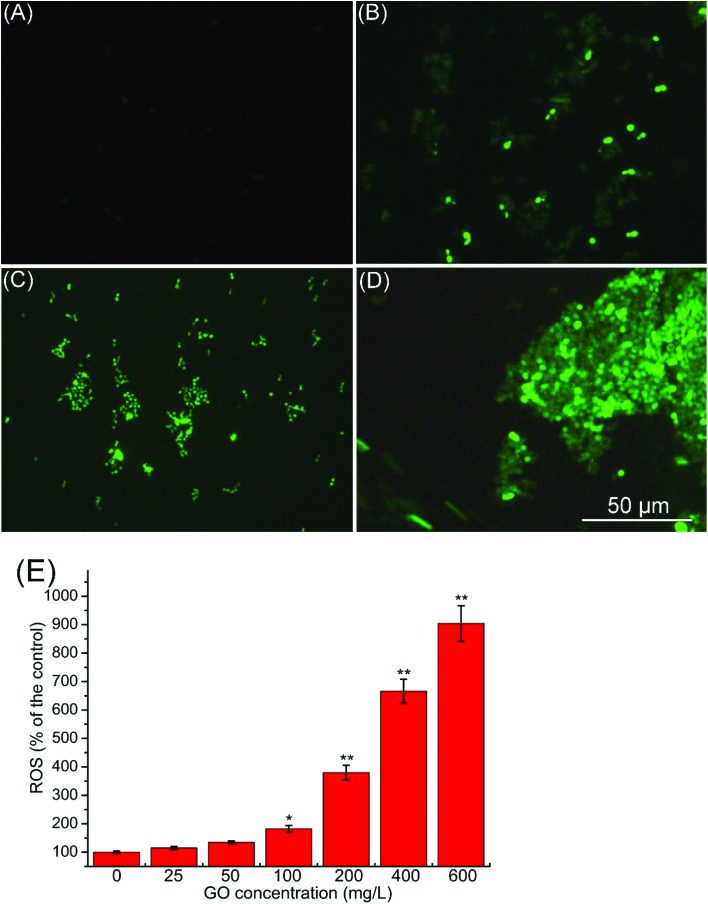
Currently, the best-developed paradigm of nanotoxicity for eukaryotes is ROS mediated oxidative stress.19 ROS is a biomarker of oxidative stress, and its production is a key cellular event of apoptosis in yeast.35,37,38 Fröhlich and Madeo (2000)37 demonstrated that apoptosis in unicellular organisms is an altruistic response to oxidative damage, and production of ROS is a regulator of apoptosis. Besides, there is a close relationship between ROS production and mitochondrial impairment. Disruption of ROS balance can result in mitochondrial injury. In addition, damage to the mitochondria can lead to an increase of ROS production.39,40 As shown in Fig. 6A–D, ROS was observably increased as indicated by stronger green fluorescence with the increase of the GO concentration. Fig. 6E shows the percentage increase of ROS compared with the control. ROS was significantly increased (p < 0.01) at 200, 400 and 600 mg L–1. This result indicated that the apoptosis and mitochondrial impairment induced by GO were related to oxidative stress.
Fig. 6. Production of ROS after exposure to 0 (A), 200 (B), 400 (C) and 600 mg L–1 (D) GO suspensions was measured using the fluorescence stereomicroscope. (E) Production of ROS after exposure to 0–600 mg L–1 GO suspensions was measured using the microplate reader. Values are presented as the mean ± SD. Values that are significantly different from the control are indicated by asterisks (one-way ANOVA, *p < 0.05, **p < 0.01).
3.7. Apoptosis-related mRNA expression
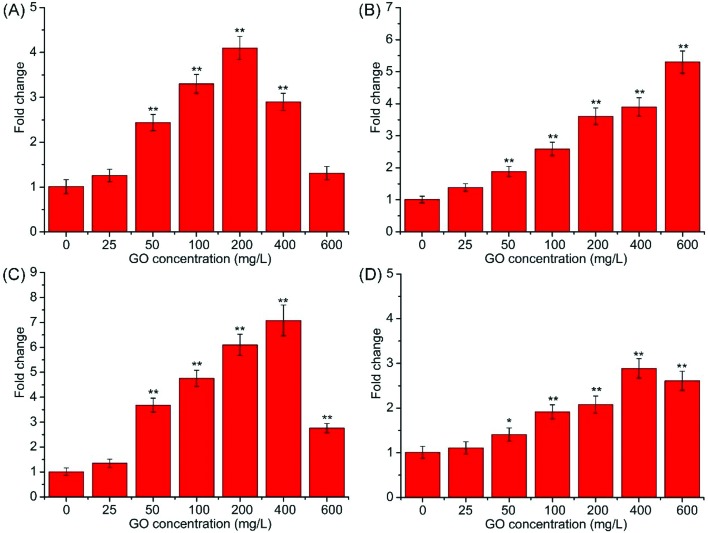
SOD encodes superoxide dismutase and functions in the redox reaction, which is important for the antioxidative response.22,41 Moreover, Sturtz et al. (2001)41 demonstrated that SOD helps protect mitochondria from oxidative damage. Yca1 belongs to the family of metacaspases that is found in yeast, and regulates apoptosis in yeast.42 Nma111p belongs to the HtrA family of serine proteases, and overexpression of Nma111 enhances apoptotic cell death.43 Nuc1p is a major mitochondrial nuclease, and plays key roles in mitochondrial recombination and apoptosis.44,45 As shown in Fig. 7A, the mRNA level of SOD was significantly increased (p < 0.01) followed by a gradual decrease. The increase was due to a response to the superoxide, and overexpression of SOD can efficiently degrade the superoxide. The decrease in mRNA level may be due to the gene expression inhibited by the elevated ROS level.46 The expression of Yca1 was significantly elevated (p < 0.01) at 50–600 mg L–1 compared with the control (Fig. 7B). mRNA levels of Nma111(Fig. 7C) and Nuc1 (Fig. 7D) showed similar trends to SOD. The decreases in mRNA levels of Nma111 and Nuc1 may also be due to the gene expression inhibited by the elevated ROS level. In some ways, the mRNA levels of SOD, Yca1, Nma111 and Nuc1 were roughly elevated, indicating that S. cerevisiae cells were undergoing apoptosis after exposure to GO. Overexpression of SOD and Nuc1 indicated that mitochondria were impaired following GO treatment.
Fig. 7. Relative mRNA expression of SOD (A), Yca1 (B), Nma111 (C) and Nuc1 (D) in S. cerevisiae cells exposed to 0–600 mg L–1 GO suspensions for 24 h.
4. Conclusion
In summary, the results presented so far show that the acute exposure of S. cerevisiae to GO leads to significant effects on cell viability and proliferation. The effects were related to mitochondria-mediated apoptosis. Furthermore, apoptosis and mitochondrial impairment were associated with oxidative stress. It can also be concluded that S. cerevisiae is a suitable model to study nanotoxicity and the underlying mechanism. This study will contribute to the risk assessment, exploitation and application of GO in the future.
Conflict of interest
There are no conflicts of interest to declare.
Acknowledgments
This work was supported by the Postdoctoral Science Foundation of Shaanxi Province (Program No. 2016BSHEDZZ114), China Postdoctoral Science Foundation (Program No. 2015 M580888) and Special Funds for Talents in Northwest A&F University (awarded to B. Zhu; Program No. Z111021510).
References
- Wang Y., Li Z., Wang J., Li J., Lin Y. Trends Biotechnol. 2011;29:205–212. doi: 10.1016/j.tibtech.2011.01.008. [DOI] [PMC free article] [PubMed] [Google Scholar]
- Zhang L., Xia J., Zhao Q., Liu L., Zhang Z. Small. 2010;6:537–544. doi: 10.1002/smll.200901680. [DOI] [PubMed] [Google Scholar]
- Chen D., Feng H., Li J. Chem. Rev. 2012;112:6027–6053. doi: 10.1021/cr300115g. [DOI] [PubMed] [Google Scholar]
- Eda G., Chhowalla M. Adv. Mater. 2010;22:2392–2415. doi: 10.1002/adma.200903689. [DOI] [PubMed] [Google Scholar]
- Robinson J. T., Perkins F. K., Snow E. S., Wei Z., Sheehan P. E. Nano Lett. 2008;8:3137. doi: 10.1021/nl8013007. [DOI] [PubMed] [Google Scholar]
- Song Y., Qu K., Zhao C., Ren J., Qu X. Adv. Mater. 2010;22:2206–2210. doi: 10.1002/adma.200903783. [DOI] [PubMed] [Google Scholar]
- Zhu Y., Murali S., Cai W., Li X., Suk J. W., Potts J. R., Ruoff R. S. Adv. Mater. 2010;22:3906–3924. doi: 10.1002/adma.201001068. [DOI] [PubMed] [Google Scholar]
- Seabra A. B., Paula A. J., De L. R., Alves O. L., Durán N. Chem. Res. Toxicol. 2014;27:159–168. doi: 10.1021/tx400385x. [DOI] [PubMed] [Google Scholar]
- Chang Y., Yang S. T., Liu J. H., Dong E., Wang Y., Cao A., Liu Y., Wang H. Toxicol. Lett. 2011;200:201–210. doi: 10.1016/j.toxlet.2010.11.016. [DOI] [PubMed] [Google Scholar]
- Liao K. H., Lin Y. S., Macosko C. W., Haynes C. L. ACS Appl. Mater. Interfaces. 2011;3:2607–2615. doi: 10.1021/am200428v. [DOI] [PubMed] [Google Scholar]
- Liu S., Zeng T. H., Hofmann M., Burcombe E., Wei J., Jiang R., Kong J., Chen Y. ACS Nano. 2011;5:6971–6980. doi: 10.1021/nn202451x. [DOI] [PubMed] [Google Scholar]
- Liu S., Hu M., Zeng T. H., Wu R., Jiang R., Wei J., Wang L., Kong J., Chen Y. Langmuir. 2012;28:12364–12372. doi: 10.1021/la3023908. [DOI] [PubMed] [Google Scholar]
- Wang K., Jing R., Song H., Zhang J., Yan W., Guo S. Nanoscale Res. Lett. 2011;6:1–8. doi: 10.1007/s11671-010-9751-6. [DOI] [PMC free article] [PubMed] [Google Scholar]
- Lan J., Gou N., Gao C., He M., Gu A. Z. Environ. Sci. Technol. 2014;48:12937–12945. doi: 10.1021/es503065q. [DOI] [PMC free article] [PubMed] [Google Scholar]
- Gromozova E. N. and Voychuk S. I., Influence of Radiofrequency Emf on the Yeast Sacharomyces Cerevisiae as Model Eukaryotic System, Springer, US, 2007. [Google Scholar]
- Goffeau A. FEBS Lett. 2000;480:37–41. doi: 10.1016/s0014-5793(00)01775-0. [DOI] [PubMed] [Google Scholar]
- Grossetête S., Labedan B., Lespinet O. BMC Genomics. 2010;11:81. doi: 10.1186/1471-2164-11-81. [DOI] [PMC free article] [PubMed] [Google Scholar]
- Mager W. H., Winderickx J. Trends Pharmacol. Sci. 2005;26:265. doi: 10.1016/j.tips.2005.03.004. [DOI] [PubMed] [Google Scholar]
- Kasemets K., Ivask A., Dubourguier H. C., Kahru A. Toxicol. in Vitro. 2009;23:1116. doi: 10.1016/j.tiv.2009.05.015. [DOI] [PubMed] [Google Scholar]
- Garcíasaucedo C., Field J. A., Oterogonzalez L., Sierraálvarez R. J. Hazard. Mater. 2011;192:1572–1579. [Google Scholar]
- Bayat N., Rajapakse K., Marinseklogar R., Drobne D., Cristobal S. Nanotoxicology. 2014;8:363–373. doi: 10.3109/17435390.2013.788748. [DOI] [PubMed] [Google Scholar]
- Kwolek-Mirek M., Zadrąg-Tęcza R., Bednarska S., Bartosz G. Cell Biochem. Biophys. 2015;71:1–12. doi: 10.1007/s12013-014-0376-8. [DOI] [PMC free article] [PubMed] [Google Scholar]
- Zhu S., Zhu B., Huang A., Hu Y., Wang G., Ling F. J. Hazard. Mater. 2016;318:650–662. doi: 10.1016/j.jhazmat.2016.07.049. [DOI] [PubMed] [Google Scholar]
- Zhu S., Luo F., Chen W., Zhu B., Wang G. Sci. Total Environ. 2017;595:101–109. doi: 10.1016/j.scitotenv.2017.03.224. [DOI] [PubMed] [Google Scholar]
- Wang Y., Muramatsu A., Sugimoto T. Colloids Surf., A. 1998;134:281–297. [Google Scholar]
- Bennis S., Chami F., Chami N., Bouchikhi T., Remmal A. Lett. Appl. Microbiol. 2004;38:454–458. doi: 10.1111/j.1472-765X.2004.01511.x. [DOI] [PubMed] [Google Scholar]
- Vermes I., Haanen C., Steffensnakken H., Reutelingsperger C. J. Immunol. Methods. 1995;184:39–51. doi: 10.1016/0022-1759(95)00072-i. [DOI] [PubMed] [Google Scholar]
- Schmittgen T. D., Livak K. J. Nat. Protoc. 2008;3:1101–1108. doi: 10.1038/nprot.2008.73. [DOI] [PubMed] [Google Scholar]
- Misra A., Tyagi P. K., Singh M. K., Misra D. S. Diamond Relat. Mater. 2006;15:385–388. [Google Scholar]
- Paredes J. I., Villarrodil S., Martínezalonso A., Tascón J. M. Langmuir. 2008;24:10560–10564. doi: 10.1021/la801744a. [DOI] [PubMed] [Google Scholar]
- Zhang Y., Pan C. J. Mater. Sci. 2011;46:2622–2626. [Google Scholar]
- Mesarič T., Gambardella C., Milivojević T., Faimali M., Drobne D., Falugi C., Makovec D., Jemec A., Sepčić K. Aquat. Toxicol. 2015;163:121–129. doi: 10.1016/j.aquatox.2015.03.014. [DOI] [PubMed] [Google Scholar]
- Fröhlich K. U., Madeo F. Exp. Gerontol. 2001;37:27–31. doi: 10.1016/s0531-5565(01)00177-2. [DOI] [PubMed] [Google Scholar]
- Ding L., Stilwell J., Zhang T., Elboudwarej O., Jiang H., Selegue J. P., Cooke P. A., Gray J. W., Chen F. F. Nano Lett. 2005;5:2448–2464. doi: 10.1021/nl051748o. [DOI] [PMC free article] [PubMed] [Google Scholar]
- Madeo F., Herker E., Wissing S., Jungwirth H., Eisenberg T., Fröhlich K. U. Curr. Opin. Microbiol. 2004;7:655–660. doi: 10.1016/j.mib.2004.10.012. [DOI] [PubMed] [Google Scholar]
- Zamzami N., Marchetti P., Castedo M., Zanin C., Vayssiere J.-L., Petit P. X., Kroemer G. J. Exp. Med. 1995;181:1661–1672. doi: 10.1084/jem.181.5.1661. [DOI] [PMC free article] [PubMed] [Google Scholar]
- Fröhlich K. U., Madeo F. FEBS Lett. 2000;473:6–9. doi: 10.1016/s0014-5793(00)01474-5. [DOI] [PubMed] [Google Scholar]
- Madeo F., Fröhlich E., Ligr M., Grey M., Sigrist S. J., Wolf D. H., Fröhlich K.-U. J. Cell Biol. 1999;145:757–767. doi: 10.1083/jcb.145.4.757. [DOI] [PMC free article] [PubMed] [Google Scholar]
- Yu K. N., Yoon T. J., Minaitehrani A., Kim J. E., Park S. J., Jeong M. S., Ha S. W., Lee J. K., Kim J. S., Cho M. H. Toxicol. in Vitro. 2013;27:1187–1195. doi: 10.1016/j.tiv.2013.02.010. [DOI] [PubMed] [Google Scholar]
- Li J., Liu X., Zhang Y., Tian F., Zhao G., Yu Q., Jiang F., Liu Y. Toxicol. Res. 2012;1:137–144. [Google Scholar]
- Sturtz L. A., Diekert K., Jensen L. T., Lill R., Culotta V. C. J. Biol. Chem. 2001;276:38084–38089. doi: 10.1074/jbc.M105296200. [DOI] [PubMed] [Google Scholar]
- Madeo F., Herker E., Maldener C., Wissing S., Lächelt S., Herlan M., Fehr M., Lauber K., Sigrist S. J., Wesselborg S. Mol. Cell. 2002;9:911–917. doi: 10.1016/s1097-2765(02)00501-4. [DOI] [PubMed] [Google Scholar]
- Fahrenkrog B., Sauder U., Aebi U. J. Cell Sci. 2004;117:115–126. doi: 10.1242/jcs.00848. [DOI] [PubMed] [Google Scholar]
- Büttner S., Carmona-Gutierrez D., Vitale I., Castedo M., Ruli D., Eisenberg T., Kroemer G., Madeo F. Cell Cycle. 2007;6:1072–1076. doi: 10.4161/cc.6.9.4218. [DOI] [PubMed] [Google Scholar]
- Büttner S., Eisenberg T., Carmonagutierrez D., Ruli D., Knauer H., Ruckenstuhl C., Sigrist C., Wissing S., Kollroser M., Fröhlich K. U. Mol. Cell. 2007;25:233. doi: 10.1016/j.molcel.2006.12.021. [DOI] [PubMed] [Google Scholar]
- Valério E., Vilares A., Campos A., Pereira P., Vasconcelos V. Toxicon. 2014;90:191–198. doi: 10.1016/j.toxicon.2014.08.059. [DOI] [PubMed] [Google Scholar]


