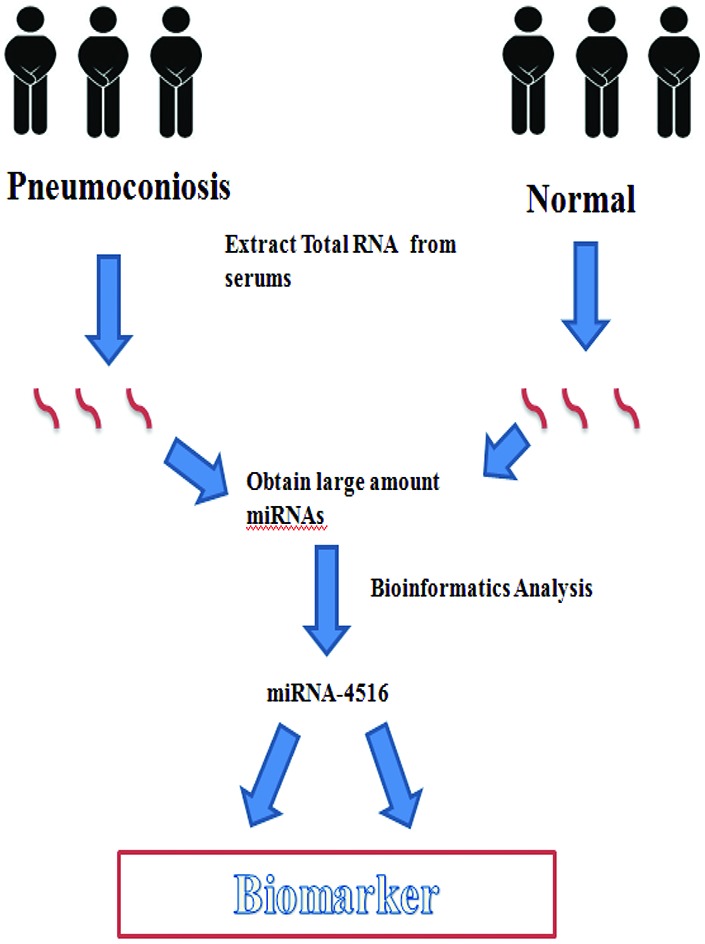
 The major innovative feature in our study is to propose miR-4516 as a novel biomarker for early diagnosis of PF among patients with pneumoconiosis.
Abstract
Background: Pulmonary fibrosis (PF) is a representative pathological change in patients with pneumoconiosis; however, due to the absence of reliable and early biomarkers, microRNAs have recently emerged as potential candidates for identification. Objectives: The aim of our study was to discover the potential of PF-specific circulating microRNAs as early biomarkers among patients with pneumoconiosis. Methods: Four dust-exposed patients with PF and four matched healthy individuals (not exposed to dust) were recruited for the study. microRNA profiling was identified by micro-array and bioinformatics methods. Gene Ontology (GO) analysis was used to identify the potential biological or molecular processes modulated by these miRNAs. Kyoto Encyclopedia of Genes and Genomes pathway (KEGG) analysis was used to identify the potentially involved signaling pathways. miRNA-mRNA-binding network analysis was employed to identify genes potentially targeted by the miRNAs. Results: 1079 miRNAs were discovered, of which 406 were up-regulated and 117 were down-regulated in PF patients. 32 miRNAs were up-regulated by >4-fold and 17 miRNAs were down-regulated by >0.5 fold. GO analysis identified the biological processes affected by anatomical structure development, hemophilic cell adhesion and cell–cell adhesion via plasma membrane proteins. Target prediction software showed that serum has-miR-4516 targeted genes encoding basonuclin2, inhibitors of growth family member 4, the potassium voltage-gated channel, and “sha-1-related subfamily member 1” proteins. qRT-PCR revealed that has-miR-4516 was a potential biomarker of PF progression in patients with pneumoconiosis. Conclusions: Our findings suggest that the level of serum miR-4516 may be a potential biomarker for early diagnosis of PF in patients with pneumoconiosis. This is a pilot work that paves the way for a further functional study of the underlying regulatory mechanisms.
Introduction
Pulmonary fibrosis (PF), characterized by fibroblast proliferation and aggregation of large amounts of extracellular matrix components in the interstitium, is a progressive, chronic, fatal lung disease characterized by inflammatory tissue damage and respiratory function failure.1–6 Nalysnyk et al. found that PF is common worldwide. In Europe, the PF prevalence ranged from 1.25 to 23.4 cases per 100 000 subjects and in the USA, the annual incidence was 6.8 to 8.8 cases per 100 000 subjects.2 PF is associated with occupational and environmental exposure to dust, particularly in pneumoconiosis patients. Cohen et al. reported that miners in the USA exposed to excessive levels of coal dust developed massive fibrosis and rapidly progressive pneumoconiosis.7 Okamoto et al. reported on a dental technician who had been exposed to indium and was diagnosed with pneumoconiosis. X-ray analysis revealed lung peribronchiolar fibrosis with pigmented macrophages and cholesterol clefts.8 Dust-induced pneumoconiosis accompanied by PF has become an increasing concern in recent years. Graber et al. indicated that, after dust control regulations were introduced in 1970, pneumoconiosis is still evident in young miners. Data from the Black Lung Benefits Program (BLBP) from 2001 to 2013 were analyzed; 8.5% of 24 686 claimants had advanced pneumoconiosis with progressive, massive lung fibrosis, and the disease prevalence in younger miners (<56 years of age) was higher (10.8%) than that in older miners (8.4% in those aged >70 years). China has the most pneumoconiosis cases worldwide (over 660 000); approximately 90% have developed in internal migrant workers over the past three decades and the number has gradually risen every year.9 Pneumoconiosis accompanied by PF is irreversible and can trigger both tuberculosis and emphysema.10 No effective treatment is available, emphasizing the need for a comprehensive understanding of the underlying mechanism, the discovery of prospective biomarkers, and the development of interventions to slow down progression, reduce clinical symptoms, and improve treatment.
Over the past few decades, miRNAs have been shown to be potentially useful for both diagnosing PF and predicting the disease outcome. miRNAs are short, single-stranded noncoding RNAs that play critical roles in the post-transcriptional regulation of protein expression, and are involved in many cellular processes including apoptosis, proliferation, and differentiation.11 Berschneider et al. showed that miR-92a plays a regulatory role in PF development by targeting the WNT1-inducible signaling pathway protein 1.12 Snyder-Talkington et al. exposed mice to inhalation of multi-walled carbon nanotubes and then screened serum miRNA levels.17 The miR-206-3p expression pattern changed when lung fibrosis developed.13 Cushing et al. reported that miR-29 was a major regulator of PF-associated genes, miR-29 silenced fibrosis-associated genes, including those encoding laminins and integrins, independent of the transforming growth factor (TGF)-beta-1 upregulation status.14 Das et al. showed that miR-326 was involved in TGF-beta signaling and fibrosis-related pathways, and the downregulation of certain genes that promoted PF development, including those encoding Ets1, Smad3, and matrix metalloproteinase 9. Also, miR-326 upregulated certain genes that played anti-PF roles, including that encoding Smad7.15 Li et al. determined the serum miRNA profiles of patients with idiopathic PF. The levels of certain miRNAs, including miR-21, miR-155, and miR-101-3p, were altered in such patients.16 Faxuan et al. used a microarray method to show that the levels of 39 miRNAs were altered in rats with experimental silicosis that were progressing to PF. However, the cited studies were either epidemiological in nature, animal studies, or focused on idiopathic PF without analysis of risk factors. Few studies have screened miRNA profiles in pneumoconiosis patients with developing PF. We hypothesized that such patients might exhibit miRNA profiles different from those of the normal population. Therefore, we compared the miRNA profiles of pneumoconiosis patients with developing PF and normal subjects. We sought to understand the molecular mechanism of PF, to identify better biomarkers of disease progression, and to facilitate more effective targeted medical interventions.
Materials and methods
Characteristics of the study population
The dust-exposed PF group consisted of four cases with PF, among which two had silicosis and two had coal miner pneumoconiosis. The latter were miners exposed to coal dust. All patients were diagnosed with reference to the Chinese Pneumoconiosis Diagnosis Standards (GBZ70-2013). We excluded patients with cancer, tuberculosis, and all other infectious diseases. The control group consisted of four healthy subjects who worked for the same mining company but were not exposed to coal dust. The mean age of the PF group was 52 ± 8.9 years and that of the control group was 49 ± 10.4 years. The pneumoconiosis's phase of the enrolled patients was the first phase. The dust concentrations in the air breathed by the dust-exposed group and the control group were 5.6 ± 1.44 mg m–3 and 0.03 mg m–3, respectively. Peripheral blood samples (at least 5 mL) were collected and centrifuged for 5 min at low speed, and the sera were separated and stored at –70 °C. All participants gave written informed consent and the study was approved by the Xiangya School of Public Health IRB (approval no. XYGW-2017-45). The test group and controls were matched by age and lifestyle factors. The serum samples were subjected to microarray analysis provided by Aksomics Inc, Shanghai, China.
Serum RNA gene expression profiling
RNA was extracted from all serum samples using miRNA easy mini kits (Qiagen, Germantown, MD, USA) following the manufacturer's instructions. RNA purity and concentration were determined using a NanoDrop ND-1000 spectrophotometer (NanoDrop, Wilmington, DE, USA). Total RNA of each sample was used to prepare the miRNA sequencing library, which included the following steps: (1) 3′-adaptor ligation; (2) 5′-adaptor ligation; (3) cDNA synthesis; (4) PCR amplification; (5) size selection of ∼135–155 bp PCR amplified fragments (corresponding to ∼15–35 nt small RNAs). The libraries were denatured as single-stranded DNA molecules, captured on Illumina flow cells, amplified in situ as clusters and finally sequenced for 50 cycles on Illumina NextSeq as per the manufacturer's instructions. To generate clusters, all samples were titrated to a final concentration of 8 pM and we used the Illumina NextSeq 500 system and TruSeq Rapid SR Cluster KIT (catalog no. #GD-402-4001, Illumina) to generate clusters on an Illumina #GD-402-4001 platform. Sequences were obtained with the Illumina NextSeq 500 platform.
All data were background-corrected and normalized using the global LOWESS (locally weighted scatter plot smoothing) regression algorithm. The differences in miRNA expression levels were compared using student's two-tailed t-test. A p value <0.01 was considered significant after the false discovery rate correction for multiple testing was applied.
Functional analysis
The GO system uses a controlled vocabulary to describe the genes and gene products of any organism (http://www.geneontology.org). GO covers three domains: biological processes, cellular components, and molecular functions. Fisher's exact test is used to determine whether overlap between a differential expression list and the GO annotation list is greater than would be expected by chance. Pathway analysis is a form of functional analysis that maps genes to Kyoto Encyclopedia of Genes and Genomes (KEGG) pathways. The associated p-value is a measure of the significance of the GO term, and thus of the pathway that may be affected; the lower the p-value, the more significant the pathway and the GO term. The use of a p-value ≤0.05, which indicates the significance of the correlation, is recommended.
QRT-PCR validation
We subjected a random sample of five differentially expressed microRNAs (has-let-7d-5p, has-miR-451a-5p, has-miR-4516, has-miR-320a and has-miR-134-5p) to qRT-PCR to check the results of the microarray approach. The sequences of these selected miRNAs are listed as follows.
has-let-7d-5p: AGAGGUAGUAGGUUGCAUAGUU;
has-miR-451a-5p: AACUGUUUGCAGAGGAAACUGA;
has-miR-4516: GGGAGAAGGGUCGGGGC;
has-miR-320a: AAAAGCUGGGUUGAGAGGGCGA;
has-miR-134-5p: UGUGACUGGUUGACCAGAGGGG.
Statistics
All data are shown as means ± SD. A fold change ≥ 2.0 (P < 0.05) was considered to indicate that a miRNA was differentially expressed. Student's t-test and related analyses were performed using SPSS for Windows (ver. 22.0; SPSS Inc., Chicago, IL, USA). A p-value <0.05 was considered to reflect the statistical significance. R software (R Development Core Team, Vienna, Austria) was used to analyze the volcano plot of and KEGG pathways associated with differentially expressed miRNAs.
Results
Differentially expressed miRNAs
We performed a genome-wide analysis of miRNA expression to identify miRNAs that were differentially expressed between the dust-exposed PF group and the control group. We examined 1079 miRNAs, of which 406 were upregulated and 117 were downregulated. In total, 14 miRNAs were upregulated with fold changes >5 (P < 0.05), and 14 were downregulated with fold changes >0.5 (P < 0.05) (Table 1). The most prominently upregulated miRNA was has-miR-200b-3p (fold change = 9.55).
Table 1. The top 14 upregulated and top 14 downregulated miRNAs.
| Upregulated miRNAs | Fold change | P-Value | Downregulated miRNAs | Fold change | P-Value |
| Has-miR-200b-3p | 9.55 | 0.03 | Has-let-7a-3p | 2.28 | 0.00 |
| Has-miR-200c-3p | 9.02 | 0.04 | Has-miR-548o-3p | 2.04 | 0.00 |
| Has-miR-novel-chr2_52954 | 8.15 | 0.02 | Has-miR-654-5p | 1.8 | 0.04 |
| Has-miR-200a-5p | 7.38 | 0.04 | Has-miR-99a-5p | 1.56 | 0.04 |
| Has-miR-4516 | 6.71 | 0.04 | Has-miR-19a-3p | 1.44 | 0.03 |
| Has-miR-novel-chr8_87508 | 6.5 | 0.01 | Has-miR-25-3p | 1.4 | 0.02 |
| Has-miR-320a | 6.28 | 0.02 | Has-miR-22-5p | 1.4 | 0.03 |
| Has-miR-320c | 6.09 | 0.03 | Has-miR-15b-5p | 1.16 | 0.03 |
| Has-miR-378f | 6.08 | 0.02 | Has-miR-140-5p | 0.96 | 0.01 |
| Has-miR-320b | 6.05 | 0.02 | Has-let-7d-5p | 0.96 | 0.02 |
| Has-miR-372-3p | 5.92 | 0.00 | Has-miR-451a | 0.92 | 0.02 |
| Has-miR-novel-chr13_14242 | 5.89 | 0.00 | Has-miR-340-5p | 0.8 | 0.03 |
| Has-miR-novel-chr20_45664 | 5.77 | 0.00 | Has-miR-16-5p | 0.64 | 0.01 |
| Has-miR-novel-chrX_97562 | 5.39 | 0.03 | Has-miR-16-2-3p | 0.52 | 0.03 |
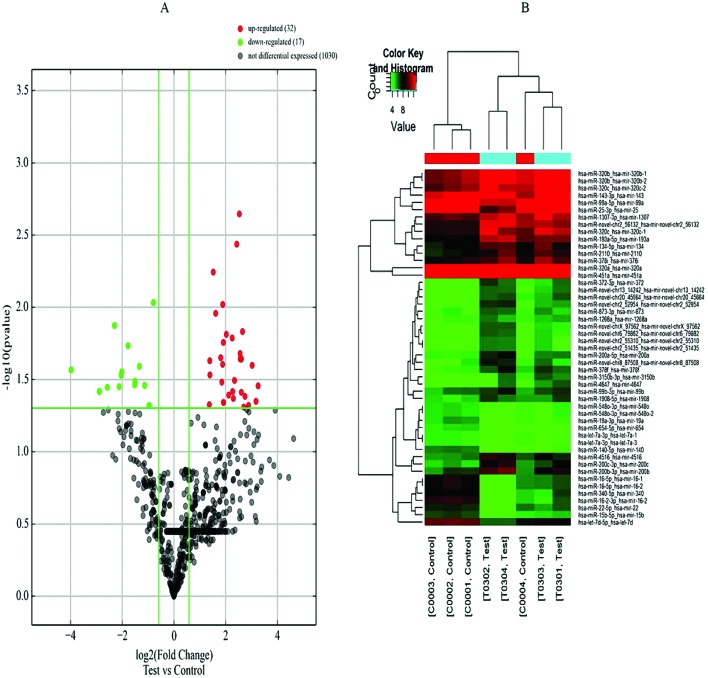
A volcano plot of the differentially expressed miRNAs is shown in Fig. 1A. The vertical lines correspond to the log2 values of the fold changes of upregulated miRNAs (red spots) and downregulated miRNAs (green spots). The horizontal line represents a p value of 0.05. Fig. 1B shows the hierarchical clustering analysis of the miRNAs. The red part means high expression of miRNAs and green represents the low expression of miRNAs. The columns refer to different samples and the rows refer to different miRNAs.
Fig. 1. A: Volcano plot of differentially expressed miRNAs. B: Hierarchical clustering analysis of the miRNAs. Red: high expression; green: low expression. The columns refer to different samples and the rows refer to different miRNAs.
Functional analysis of differentially expressed genes
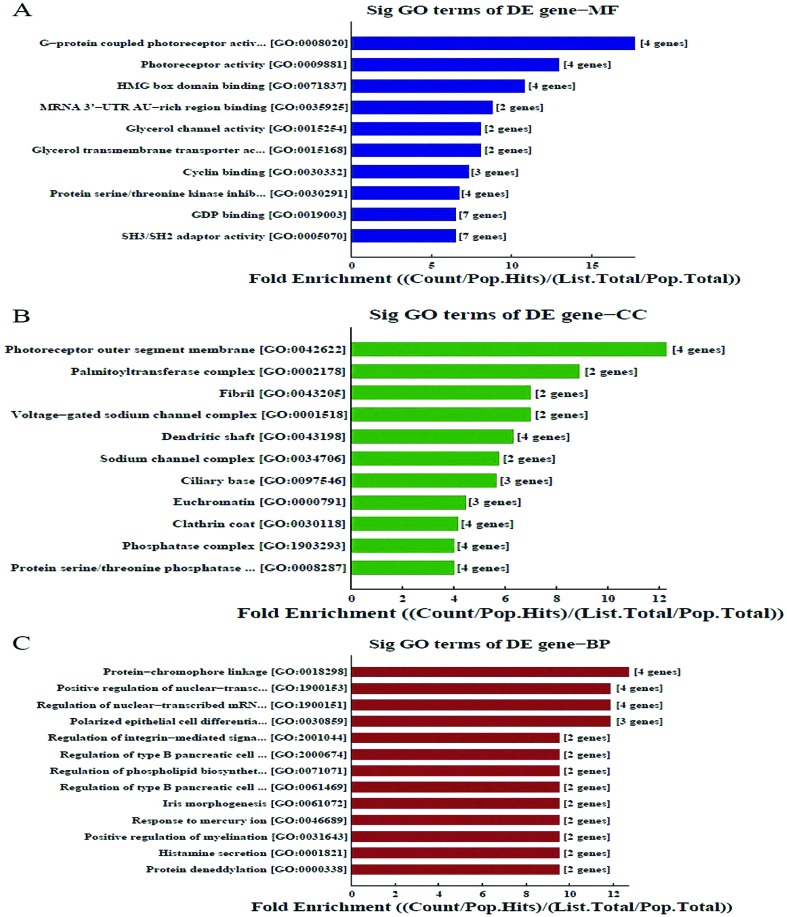
The GO system was used to explore possibly relevant genes (Fig. 2). The GO molecular function classification is shown in Fig. 2A. We found the enriched GOs associated with molecular function were C-protein coupled photoreceptor activity, HMG box domain binding, and miRNA 3′-UTRAU-rich region binding (Fig. 2A); Fig. 2b shows that the most enriched CC were the photoreceptor outer segment membrane, palmitoyltransferase complex and fibrils; Fig. 2C shows that the most enriched biological processes were protein–chromophore linkage, positive regulation of nuclear-transaction and regulation of nuclear-transcribed mRNA.
Fig. 2. Function analysis of differentially expressed genes.
New miRNAs identified, target prediction and functional analysis
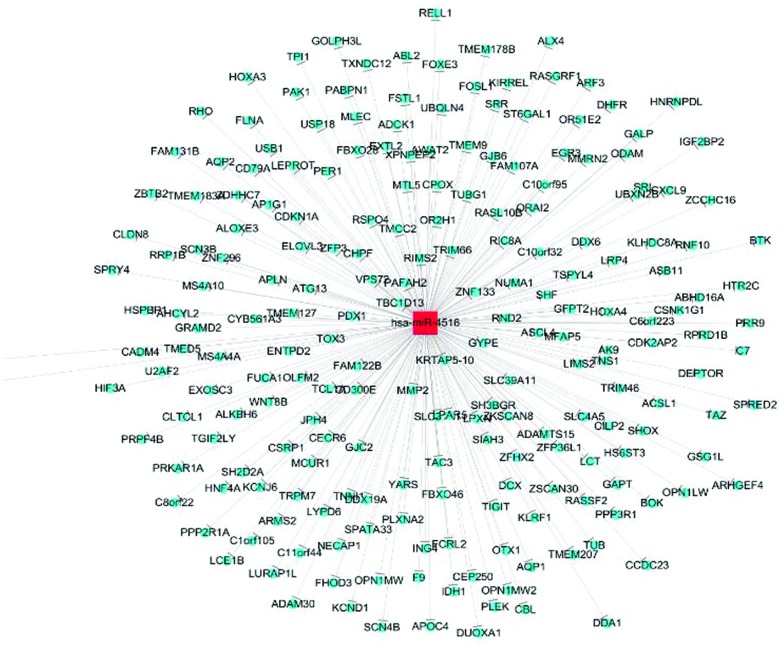
miRDeep2 software was used to find novel miRNAs. 1324 new miRNAs have been discovered, of which 1000 miRNAs are indicated to be significant changed fold p-value. For instance, the precursor sequence of chr7_82840, a novel miRNA, is aguugguccgaguguuguggguuauuguuaaguugauuuaacauugucuccccccacaaccgcgcuugacuagc with an miRDeep2 score of 40 355.1; for another new miRNA, chr17_28742, the precursor sequence is auugaugaucguucuucucuccguauuggggagugagagggagagaacgcggucugaguggu with an miRDeep2 score of 17 434. Table 2 shows the target prediction of 5 miRNAs by KEGG. It indicated that each miRNA might have different and various target genes to perform different functions in the process of PF. Fig. 3 shows the miRNA-mRNA network of has-miR-4516. The has-miR-4516 miRNA targeted basonuclin 2, the “inhibitor of growth family member 4” protein, the potassium voltage-gated channel, the “shal-related subfamily member 1” protein, ST6 beta-galactosamide-alpha-2,6-sialytranferase 1, the “adaptor-related protein complex 1 gamma 1 subunit” protein, and the “transmembrane and coiled-coil domain family 2” protein.
Table 2. Target prediction of 5 miRNAs.
| Term | Target genes |
| Has-miR-200a-5p | ZC3H12C, BTBD1, SHPRH, FZD1, UBR3, PPAP2B, SP3, ATAD2, ZNF367, SGK1, USP53, ARL13B, CRLF3, NR4A1, KLF6, HNRNPR, FOXD1, RAB1A, LMTK2, EPHA5 |
| Has-miR-200a-3p | TCEB1, TRIM33, LHFP, PTPN21, ARHGAP6, VASH2, HIPK3, NR5A2, NR5A2, ZEB1, RECK, SLIT2, AP1S2, ERRFI1, AFF3, CCNJ, MAP4 K5, SESN1, ELL2, ELMOD2, NFIA, CDK17, TMOD3 |
| Has-miR-200c-5p | TRIM33, PTPN21, LHFP, TCEB1, ZEB1, WASF3, ARHGAP6, VASH2, ZEB2, HIPK3, RECK, NR5A2, SESN1, TMOD3, ELL2, AFF3, ERRFI1, NFIA, MAP4 K5, SLIT2 |
| Has-miR-320a | GCG, LPPR1, PBX3, TGOLN2, ABHD13, SLC2A12, RAB18, YOD1, PPM1B, SEMA3A, CNKSR2, HELZ, AFF4, IDE, PBX1 |
| Hsa-miR-4516 | BNC2, ING4, KCND1, ST6GAL1, KLHDC8A, AHCYL2, AP1G1, TMCC2, TSPYL4, WDTC1, ZFP3, GALNT13, C15or rf52, RSPO4, WNT8B, FEXO28, LYPD6, ZMAT3, FAM78A, RNF144B, FBXW7, RCOR1, ABL2 |
Fig. 3. miRNA-mRNA network of has-miR-4516.
QRT-PCR validation
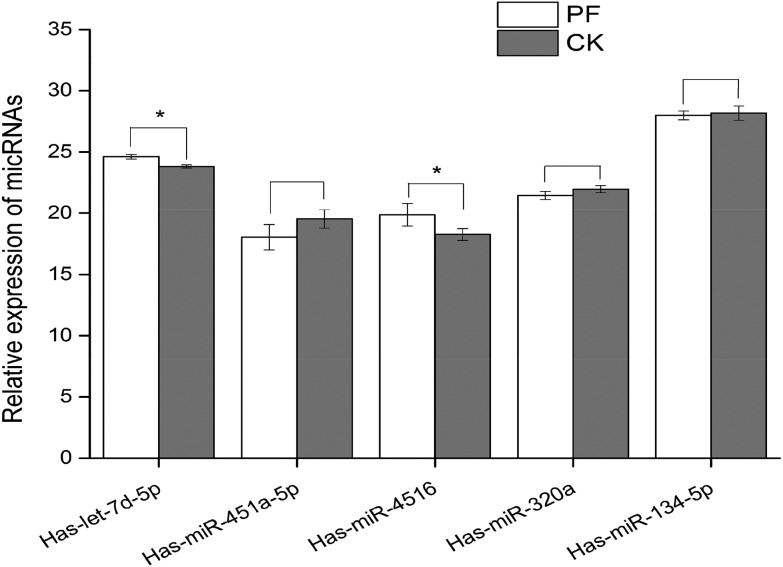
We measured the levels of five miRNAs by qRT-PCR: the downregulated has-let-7d-5p, and the upregulated has-miR-451a-5p, has-miR-320a, has-miR-134-5p, and has-miR-4516 (Fig. 4). The qRT-PCR results were similar to the microarray data; all five miRNAs were differentially expressed, as shown by the microarray, with statistical significance for has-let-7d-5p and has-miR-4516 (both P < 0.05) but not for the other three miRNAs (all P > 0.05).
Fig. 4. The qRT-PCR levels of five miRNAs (PF: pulmonary fibrosis; CK: control, and *p < 0.05 compared with control.).
Discussion
Dust constitutes solid particles suspended in air and is known to cause several forms of pulmonary injury including pneumoconiosis, which is dominated by PF. However, the molecular mechanism by which dust induces PF remains unclear. Here, we sought miRNAs that were differentially expressed in pneumoconiosis patients with PF compared with healthy participants in an effort to define the early biomarkers of PF caused by dust exposure, and to understand why hematotoxicity is evident in pneumoconiosis patients with PF. We used microarray analysis to this end, and explored the biological processes and molecular actions involved by mRNA-miRNA network analysis. This was a pilot study; we sought clues that might guide further research.
Differentially upregulated miRNAs in patients affected the mitogen-activated protein kinase (MAPK) signaling pathway, the ErbB signaling pathway, renin secretion, the phosphoinositide 3-kinase (PI3K)-Akt signaling pathway, and glycosaminoglycan biosynthesis. The differentially downregulated miRNAs affected cancer development pathways, signaling pathways involved in stem cell pluripotency and melanoma development, and the mTOR and PI3K-Akt signaling pathways, similar to what was reported by previous studies. Zhang et al. found that miRNAs overexpressed in nano-silica-stimulated macrophages were involved in cytokine-cytokine receptor interactions, transcriptional dysregulation, and the PI3K-Akt and MAPK signaling pathways.18 Guo et al. performed a genome-wide analysis of miRNAs expressed in coal miners with pneumoconiosis and found (via KEGG pathway analysis) that differentially expressed miRNAs principally affected lung cancer development, the cell cycle, focal adhesion, and junctional adherence, similar to our study.19 Honeyman et al. found that the miRNA profile of mice with bleomycin-induced PF was abnormal; the affected pathways included the hepatocyte growth factor (HGF) and insulin-like growth factor 1 (IGF-1) signaling pathways, in contrast to our results,20 suggesting that different forms of PF may vary in terms of their differentially expressed miRNA patterns, thus affecting different signaling pathways. Fan et al. analyzed the miRNAs of patients with idiopathic PF and found that the pathways affected were those involved in the cell cycle, cancer, TGF-beta signaling, junctional adherence, renal cell carcinoma, and prostate cancer. Some of these pathways are similar to those that we identified, whereas others are similar to the pathways reported to be affected. Thus, although the causes of PF may vary, the signaling pathways involved could be similar. PI3K-Akt, MAPK, ErbB, and mTOR signaling may all play essential roles in the development of dust-induced PF among pneumoconiosis patients. These genes may be useful biomarkers for exploring the mechanism of PF development and for early diagnosis of the condition, triggering preventative measures.
Both toxicogenomic and transcriptomic approaches are used to explore the mechanism of PF development and to identify the potential novel biomarkers of early disease and patient susceptibility.21–24 The molecular epidemiologies of diseases caused by occupational dust exposure (pneumoconiosis including silicosis, coal miner's pneumoconiosis) have been explored by analyzing peripheral blood mononuclear cells, serum, and leukocytes. Some potential PF miRNA biomarkers have been identified.25 Yang et al. indicated that miR-19a of peripheral blood leukocytes was a potential biomarker of PF.25 Huang et al. suggested that miR-125b-5p, miR-128, miR-30e, and miR-20b were potential biomarkers of smoking-induced PF.26 miRNA-29a plays a critical role in PF, by reducing the expression of “TGF-b1-induced Wnt1 inducible signaling pathway protein 1”.26,27 Fan et al. found that in patients with idiopathic PF, has-miR-205 and has-miR-34c-3p were upregulated and has-miR-532-5p and has-miR-652 were downregulated; all played important roles in PF. We identified miRNAs that were differentially expressed in patients with dust-induced PF; has-miR-4516 was upregulated and qRT-PCR showed that this miRNA played a critical role in the development of the disease.
miRNA-mRNA network analysis revealed that has-miR-4516 targeted many genes. Chowdhari et al. showed that has-miR-4516 was downregulated in psoriasis patients, and inhibited keratinocyte motility by targeting the “fibronectin/integrin alpha-9” protein expression. Another study showed that this miRNA downregulated the STATs/CDK6/UBE2N proteins and induced keratinocyte apoptosis.28,29 In our study, this miRNA was upregulated, and targeted other genes; has-miR-4516 may target different genes in different diseases. Has-miR-200b-3p (exhibiting a >9-fold change compared to the control in our present study) has been shown to participate in gene interactions in previous studies. Yu et al. found that has-miR-200b-3p regulated monocyte/macrophage differentiation by activating “MAPK interacting protein P38IP” protein production.30 He found that miR-200b-3p was downregulated when p73 was expressed at low levels in AIPC cells, triggering cell proliferation.31 Our work suggests that has-miR-200b-3p targets the genes encoding transcription elongation factor B (TCEB), the “tripartite motif containing 33” protein (TRIM33), the lipoma HMGIC fusion partner (LHFP), and “protein tyrosine phosphatase, non-receptor type 21” (PTPN21). Thus, in different diseases, has-miR-200b-3p may regulate the expression of different genes and pathways. Microarray analysis can be used to discover the biomarkers of early disease and the signaling pathways and genes involved. However, the association between differentially expressed miRNAs and PF pathogenicity remains unclear; further studies with larger patient numbers are required.
Our study had several limitations. First, our PF patients had been exposed to either silica or coal dust; our data may thus refer more to PF than specific dust-induced diseases. Second, we evaluated only eight subjects; this small sample could have contributed to study heterogeneity and larger numbers of patients are required in future studies. Third, our qRT-PCR validation was not extensive; further validation is required.
Conclusion
We evaluated 1079 miRNAs, of which 406 were upregulated and 117 were downregulated, as revealed by microarray analysis. Has-miR-4516 and has-miR-200b-3p are potential biomarkers of early PF, affecting various signaling pathways in such patients. However, more comprehensive analyses are required to validate this.
Conflicts of interest
There are no conflicts of interest to declare.
Acknowledgments
This study was supported by the National Natural Science Foundation of China (No. 81372966).
References
- English C., Churg A., Lam S., Bilawich A. M. Ann. Am. Thorac. Soc. 2014;11:1665–1666. doi: 10.1513/AnnalsATS.201410-474LE. [DOI] [PubMed] [Google Scholar]
- Nalysnyk L., Cid-Ruzafa J., Rotella P., Esser D. Eur. Respir. Rev. 2012;21:355–361. doi: 10.1183/09059180.00002512. [DOI] [PMC free article] [PubMed] [Google Scholar]
- Borchers A. T., Chang C., Keen C. L., Gershwin M. E. Clin. Rev. Allergy Immunol. 2011;40:117–134. doi: 10.1007/s12016-010-8211-5. [DOI] [PubMed] [Google Scholar]
- Kaunisto J., Salomaa E. R., Hodgson U., Kaarteenaho R., Myllarniemi M. BMC Pulm. Med. 2013;13:53. doi: 10.1186/1471-2466-13-53. [DOI] [PMC free article] [PubMed] [Google Scholar]
- Zhang L., Wang C., Yan Q., Zhang T., Han Z., Jiang G. Medicine. 2017;96:e6890. doi: 10.1097/MD.0000000000006890. [DOI] [PMC free article] [PubMed] [Google Scholar]
- Graber J. M., Harris G., Almberg K. S., Rose C. S., Petsonk E. L., Cohen R. A. J. Occup. Environ. Med. 2017;59:e105–e111. doi: 10.1097/JOM.0000000000001048. [DOI] [PubMed] [Google Scholar]
- Cohen R. A., Petsonk E. L., Rose C., Young B., Regier M., Najmuddin A., Abraham J. L., Churg A., Green F. H. Am. J. Respir. Crit. Care Med. 2016;193:673–680. doi: 10.1164/rccm.201505-1014OC. [DOI] [PMC free article] [PubMed] [Google Scholar]
- Okamoto M., Tominaga M., Shimizu S., Yano C., Masuda K., Nakamura M., Zaizen Y., Nouno T., Sakamoto S., Yokoyama M., Kawayama T., Hoshino T. Intern. Med. 2017;56:3323–3326. doi: 10.2169/internalmedicine.8860-17. [DOI] [PMC free article] [PubMed] [Google Scholar]
- Ning H., Zhou Y., Zhou Z., Cheng S., Huang R., Ning H., Huang R. Occup. Environ. Med. 2017;74:924–925. doi: 10.1136/oemed-2017-104656. [DOI] [PubMed] [Google Scholar]
- Ogawa S., Imai H., Ikeda M. Ind. Health. 2003;41:231–235. doi: 10.2486/indhealth.41.231. [DOI] [PubMed] [Google Scholar]
- Fan L., Yu X., Huang Z., Zheng S., Zhou Y., Lv H., Zeng Y., Xu J. F., Zhu X., Yi X. Mediators Inflammation. 2017;2017:1804240. doi: 10.1155/2017/1804240. [DOI] [PMC free article] [PubMed] [Google Scholar]
- Berschneider B., Ellwanger D. C., Baarsma H. A., Thiel C., Shimbori C., White E. S., Kolb M., Neth P., Konigshoff M. Int. J. Biochem. Cell Biol. 2014;53:432–441. doi: 10.1016/j.biocel.2014.06.011. [DOI] [PubMed] [Google Scholar]
- Snyder-Talkington B. N., Dong C., Sargent L. M., Porter D. W., Staska L. M., Hubbs A. F., Raese R., McKinney W., Chen B. T., Battelli L., Lowry D. T., Reynolds S. H., Castranova V., Qian Y., Guo N. L. J. Appl. Toxicol. 2016;36:161–174. doi: 10.1002/jat.3157. [DOI] [PMC free article] [PubMed] [Google Scholar]
- Cushing L., Kuang P. P., Qian J., Shao F., Wu J., Little F., Thannickal V. J., Cardoso W. V., Lu J. Am. J. Respir. Cell Mol. Biol. 2011;45:287–294. doi: 10.1165/rcmb.2010-0323OC. [DOI] [PMC free article] [PubMed] [Google Scholar]
- Das S., Kumar M., Negi V., Pattnaik B., Prakash Y. S., Agrawal A., Ghosh B. Am. J. Respir. Cell Mol. Biol. 2014;50:882–892. doi: 10.1165/rcmb.2013-0195OC. [DOI] [PMC free article] [PubMed] [Google Scholar]
- Li P., Li J., Chen T., Wang H., Chu H., Chang J., Zang W., Wang Y., Ma Y., Du Y., Zhao G., Zhang G. Int. J. Mol. Med. 2014;33:1554–1562. doi: 10.3892/ijmm.2014.1712. [DOI] [PubMed] [Google Scholar]
- Faxuan W., Qin Z., Dinglun Z., Tao Z., Xiaohui R., Liqiang Z., Yajia L. J. Toxicol. Sci. 2012;37:1207–1215. doi: 10.2131/jts.37.1207. [DOI] [PubMed] [Google Scholar]
- Zhang L., Hao C., Li J., Qu Y., Bao L., Li Y., Yue Z., Zhang M., Yu X., Chen H., Zhang J., Wang D., Yao W. Tumour Biol. 2017;39:1393380380. doi: 10.1177/1010428317709284. [DOI] [PubMed] [Google Scholar]
- Guo L., Ji X., Yang S., Hou Z., Luo C., Fan J., Ni C., Chen F. Mol. Biol. Rep. 2013;40:3739–3747. doi: 10.1007/s11033-012-2450-x. [DOI] [PubMed] [Google Scholar]
- Honeyman L., Bazett M., Tomko T. G., Haston C. K. Fibrog. Tissue Repair. 2013;6:16. doi: 10.1186/1755-1536-6-16. [DOI] [PMC free article] [PubMed] [Google Scholar]
- Chouri E., Servaas N. H., Bekker C. P. J., Affandi A. J., Cossu M., Angiolilli C., Mertens J. S., van den Hoogen L. L., Silva-Cardoso S., van der Kroef M., Vazirpanah N., Wichers C. G. K., Carvalheiro T., Blokland S. L. M., Giovannone B., Porretti L., Marut W., Vigone B., van Roon J. A. G., Beretta L., Rossato M., Radstake T. R. D. J., J. Autoimmun., 2018. , , pii: S0896-8411(17)30664-9 . [Google Scholar]
- Poulsen S. S., Saber A. T., Williams A., Andersen O., Kobler C., Atluri R., Pozzebon M. E., Mucelli S. P., Simion M., Rickerby D., Mortensen A., Jackson P., Kyjovska Z. O., Molhave K., Jacobsen N. R., Jensen K. A., Yauk C. L., Wallin H., Halappanavar S., Vogel U. Toxicol. Appl. Pharmacol. 2015;284:16–32. doi: 10.1016/j.taap.2014.12.011. [DOI] [PubMed] [Google Scholar]
- Shen L., Wang Q., Liu R., Chen Z., Zhang X., Zhou P., Wang Z. Nucleic Acids Res. 2018;46(2):717–729. doi: 10.1093/nar/gkx1224. [DOI] [PMC free article] [PubMed] [Google Scholar]
- Song N., Ma X., Li H., Zhang Y., Wang X., Zhou P., Zhang X. Urol. Oncol. 2015;33:201–205. doi: 10.1016/j.urolonc.2015.02.003. [DOI] [PubMed] [Google Scholar]
- Yang Z., Li Q., Yao S., Zhang G., Xue R., Li G., Wang Y., Wang S., Wu R., Gao H. Anat. Rec. 2016;299:1300–1307. doi: 10.1002/ar.23381. [DOI] [PubMed] [Google Scholar]
- Huang Y., Dai Y., Zhang J., Wang C., Li D., Cheng J., Lu Y., Ma K., Tan L., Xue F., Qin B. Biomarkers. 2012;17:435–440. doi: 10.3109/1354750X.2012.680611. [DOI] [PubMed] [Google Scholar]
- Berschneider B., Ellwanger D. C., Baarsma H. A., Thiel C., Shimbori C., White E. S., Kolb M., Neth P., Konigshoff M. Int. J. Biochem. Cell Biol. 2014;53:432–441. doi: 10.1016/j.biocel.2014.06.011. [DOI] [PubMed] [Google Scholar]
- Chowdhari S., Saini N. J. Cell. Physiol. 2014;229:1630–1638. doi: 10.1002/jcp.24608. [DOI] [PubMed] [Google Scholar]
- Chowdhari S., Sardana K., Saini N. Biochim. Biophys. Acta. 2017;1863:3142–3152. doi: 10.1016/j.bbadis.2017.08.014. [DOI] [PubMed] [Google Scholar]
- Yu X., Wang Q. L., Li Y. F., Wang X. D., Xu A., Li Y. Cell Discovery. 2016;2:15043. doi: 10.1038/celldisc.2015.43. [DOI] [PMC free article] [PubMed] [Google Scholar]
- He M., Liu Y., Deng X., Qi S., Sun X., Liu G., Liu Y., Liu Y., Zhao M. Prostate. 2013;73:1048–1056. doi: 10.1002/pros.22652. [DOI] [PubMed] [Google Scholar]


