 PPARα-transgenic mice could serve as a useful tool for preclinical safety evaluation of gemfibrozil.
Abstract
To explore the feasibility of peroxisome proliferator-activated receptor (PPAR)α transgenic mice applying in preclinical safety evaluation for peroxisome proliferators (PPs). Both PPARα transgenic mice and C57BL/6J mice were assigned as treated groups (PT and CT groups) and control groups (PC and CC groups). Gemfibrozil was administered into treated groups for 4 weeks. Body weight, blood biochemistry, enzyme activity and histological examinations were performed at scheduled time. The results showed that significant hypolipidaemic effects were induced in the treated groups after gemfibrozil treatment whereas the changes of non-esterified fatty acid and high density lipoproteincholesterol were different between the two treated groups. All the enzyme activities examined increased significantly in PT and CT groups except catalase which displayed no obvious change in the PT group. Pathology results showed a significant increase of the liver weight and the liver weight ratio in the CT group while no obvious changes were observed in the PT group. Hypertrophy of hepatocytes was discovered in CT and PT groups in histological examination, while the extent and incidence of hepatocyte hypertrophy in the CT group were higher than those in the PT group. The data suggest that PPARα transgenic mice could serve as a useful tool for preclinical safety assessment of PP drugs.
Introduction
PPARs are members of the steroid-thyroid hormone receptor superfamily which function as transcription factors regulating the expression of target genes.1 Three isoforms of PPARs(α,β/δ,γ) have been identified in different tissues until now and following studies discovered that they can be activated by peroxisome proliferators (PPs).2 PPs are a structurally diverse group of chemicals including fibrate hypolipidemic drugs, industrial plasticizers, solvents and herbicides, with a high likelihood of environmental and therapeutic exposure to humans.3
Human and mouse PPARα genes locate on chromosomes 22ql2-ql3 and 15E2 respectively, and both of them encode an amino acid with the molecular weight of 468. The protein of PPARα is composed of 4 domains including A/B domain, C domain, D domain, and D/E domain. Expression of PPARα is diverse between species, the organs and tissues with higher expression level are liver and skeletal muscle in human whereas liver in rodents. Different effects can be induced by PPs in humans and rodents. For rodents, short-term PP exposure can result in hepatomegaly, peroxisome proliferation, as well as increase of fatty acid oxidation in the liver, kidney, and heart; long-term PP exposure will increase the incidence of hepatocellular carcinomas.4,5 For humans, epidemiological studies reveal that PP drugs can decrease the elevated cholesterol and lipoproteinlipase (LPL) levels in plasma, while no peroxisome proliferation and carcinogenic effects were observed.6 The study with the PPARα-null mouse reveals that PPARα is responsible for PP-induced pleiotropic responses in mice,7 and following studies indicate that the difference of PPARα between humans and rodents is proposed to be the key factor for the species difference in response to PPs.8
Since humans and rodents respond differently to PPs, an appropriate animal model is crucial for assessing risks of PPs to humans correctly. In this research, human PPARα transgenic mice were built and fibrate hypolipidemic drug-gemfibrozil was administered into the PPARα transgenic mice and wild type mice, respectively, then the effects induced by gemfibrozil were examined and compared to explore whether it is possible to evaluate the preclinical safety of PP drugs with human PPARα transgenic mice.
Materials and methods
Generation of PPARα-transgenic mice
The PPARα gene was amplified from pcDNA3.1(+)-h-PPARα plasmid by the PCR. After verifying with DNA sequence analysis, the PPARα gene was inserted into the downstream of the CMV promoter to construct a PPARα transgenic vector. The PPARα transgenic vector was linearized with Pvul and microinjected into fertilized C57BL/6 mouse eggs to create transgenic mouse with human PPARα. The genotype of mice was analyzed by the PCR with tail blood of mice. The primers were: 5′TGTATGACAAGTGCGACCG3′ and 5′TCCAAGTTTGCGAAGCCT3′. After screening by using the human PPARα gene with the PCR, mice were further selected with western blotting analysis. Those with a higher expression level of PPARα protein in the liver and heart were selected as sensitive founder mice to breed with C57BL/6 mice. Mice used in this study were those with the positive human PPARα gene determined by tail blood DNA analysis. The PPARα transgenic mice were built by the genetic center of the Institute of Laboratory Animal Science, Chinese Academy of Medical Science. All procedures of generation and care of animals were approved by the Institutional Animal Care and Use Committee of the Chinese Academy of Medical Sciences. All procedures of animal experiments and housing were carried out in accordance with the laboratory animal administration rules of the Ministry of Science and Technology of the People's Republic of China.
Tissue distribution of the human PPARα gene
The expression of the human PPARα gene in the heart, liver, lung, kidney, stomach, intestine, and pancreas of PPARα transgenic mice was examined with the real time PCR. Total RNA of the samples was extracted, and DNA in the sample RNA was digested with DNase I. After quality detection by RNA electrophoresis, the RNA of the samples was reverse transcribed to cDNA, and then tested with the PCR. The primer information of the human PPARα gene is listed in Table 1. The following conditions were used for the PCR: 5 °C for 5 min for pre-degeneration, 95 °C for 15 s, 58 °C for 20 s, and 72 °C for 20 s in 40 cycles. Relative expression levels of mRNA were normalized to β-actin (Table 1).
Table 1. Primer information of the human PPARα gene.
| Primer | Sequence (5′ to 3′) | Base number | Product length |
| β-Actin 190/193 | F: GAAGTGTGACGTTGACATCCG | 21 | 282 bp |
| R: GCCTAGAAGCATTTGCGGTG | 20 | ||
| Homo PPARα F3/R1 | F: GCCTAAGGAAACCGTTCTGTG | 21 | 180 bp |
| R: GTACAATACCCTCCTGCATT | 20 |
Material and animal maintenance
Gemfibrozil was obtained from the Harbin Pharmaceutical Group, China. The C57BL/6J mice were bought from Beijing Huafukang Biotechnology Company Limited, license number: SCXK (Peking) 2009-0004. The mice were maintained under a standard 12 h light/12 h dark illumination cycle with water and chow provided ad libitum. The facility is licensed and accredited by the Association for Assessment and Accreditation of Laboratory Animal Care (AAALAC), and all procedures were approved by the Institutional Animal Care and Use Committee of the Chinese Academy of Medical Sciences.
Animal treatments
16 PPARα transgenic mice and 16 C57BL/6J mice were assigned into 2 groups respectively: PPARα control (PC) group, PPARα treatment (PT) group, and C57BL/6J control (CC) group, C57BL/6J treatment (CT) group. The PT group and the CT group were administered with 1.25 g per kg body weight gemfibrozil via gavage for 4 weeks, the dosage corresponding to 7 times the clinical dosage according to the body surface. The PC and CC groups were given ddH2O for 4 weeks (Table 2).
Table 2. Experiment design.
| Group | Species | Animal number | Treatment |
| PC | PPARα transgenic mice | 8 (4♀4♂) | ddH2O |
| PT | PPARα transgenic mice | 8(4♀4♂) | Gemfibrozil |
| CC | C57BL/6J mice | 8(4♀4♂) | ddH2O |
| CT | C57BL/6J mice | 8(4♀4♂) | Gemfibrozil |
General observation and body weight
Daily general clinical observations were conducted throughout the research. All animals were observed for changes of skin, fur, eyes, mucus membrane, occurrence of secretions, and excretions. The body weight of each animal was recorded every week in the study.
Blood biochemical examination
At the termination of the study, all mice were fasted overnight and blood was collected. The contents of glucose (GLU), cholesterol (CHO), triglyceride (TG), high density lipoproteincholesterol (HDL-C), low density lipoproteincholesterol (LDL-C), non-esterified fatty acid (NEFA), alanine transaminase (ALT), aspartate transaminase (AST), blood urea nitrogen (BUN), creatinine (CRE), and alkaline phosphatase (ALP) in serum were determined with an automatic biochemistry analyzer.
Enzyme activity analysis
After euthanized, the liver of mice was weighed and the left lobe of the liver was removed for enzyme activity analysis. The liver tissue was homogenized at 3000 rpm for 10 min in ice with extracted buffer (0.25 mol L–1 sucrose, 0.1% ethanol, 1 mmol L–1 EDTANa3, 10 mmol L–1 Tris-HCl pH 7.4, PMSF 0.5 mmol L–1 and 1 mmol L–1 benzamidine). The supernatant was collected and the extracted buffer was added to 10 times the volume of tissue weight. After centrifugation at 7000 rpm for 5 minutes, the supernatant was collected and centrifuged at 13500 rpm for 20 minutes. The deposition of crude extraction of peroxisome was suspended with the extracted buffer for enzyme activity analysis of catalase, acyl coenzyme A oxidase, and nonspecific carnitine acetyltransferase. Acyl coenzyme A oxidase activity was determined by the method of Walusimbi-Kisitu M,9 nonspecific carnitine acetyl-transferase activity was estimated by the method of Bieber LL,10 and peroxisomal catalase activity was tested by the method derived from that of Aebi H.11 Protein concentrations were measured according to the Bradford method with bovine serum albumin as the standard.12
Pathology examination
Mice were euthanized at the termination. The liver, brain, heart, spleen, lung, kidney, thymus, testis, epididymis, uterus, and ovary were excised and weighed, and the weight ratios of the organs were calculated. The remaining liver was fixed in 10% neutral buffered formalin, embedded in paraffin, and prepared into 4 μm sections. Sections stained with hematoxylin and eosin were evaluated by light microscopy.
Data analysis
All data are presented as the mean ± s. The differences between groups were assessed by the T-test. Differences were considered statistically significant at P < 0.05.
Results
Selection of PPARα positive mice
After screening by using the human PPARα gene with the PCR, mice were further selected with western blotting. Those with a higher expression level of the PPARα gene in the liver and heart were selected as sensitive founder mice to breed with C57BL/6 mice (Fig. 1).
Fig. 1. Results of western blotting in the heart and liver of wild type mice and PPARα transgenic sensitive founder mice. Note: WT: wild type mice (C57BL/6J mice), SF: PPARα transgenic sensitive founder mice.
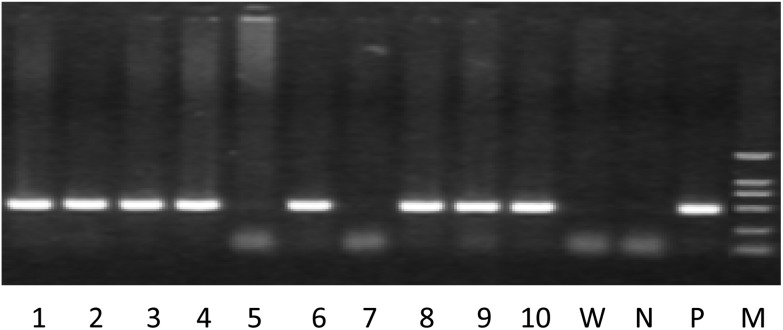
Mice with the positive human PPARα gene determined by tail blood DNA analysis were selected as PPARα transgenic mice (Fig. 2).
Fig. 2. The representative results for identification of the human PPARα gene by PCR with tail blood. Note. 1–10 is the animal number, W: wild type mouse, N: negative control, P: positive control, M: DL2000 marker, animals with positive expression of the human PPARα gene: 1–4, 6, 8–10.
Tissue distribution of the human PPARα gene
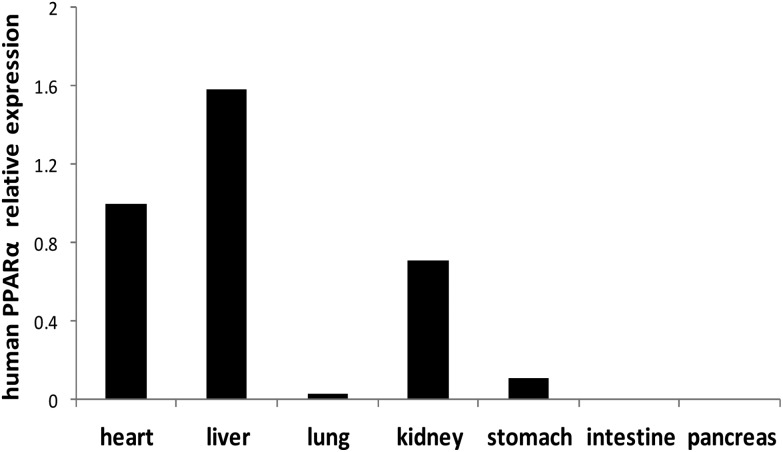
The human PPARα gene is expressed at a higher level in the heart, liver and kidney of PPARα transgenic mice, and expressed at a lower level in the lung, stomach, intestine and pancreas (Fig. 3).
Fig. 3. Expression of human PPARα mRNA in different organs of PPARα transgenic mice. Note: Values were quantified using the comparative CT methods normalized to β-actin.
General observation and the body weight
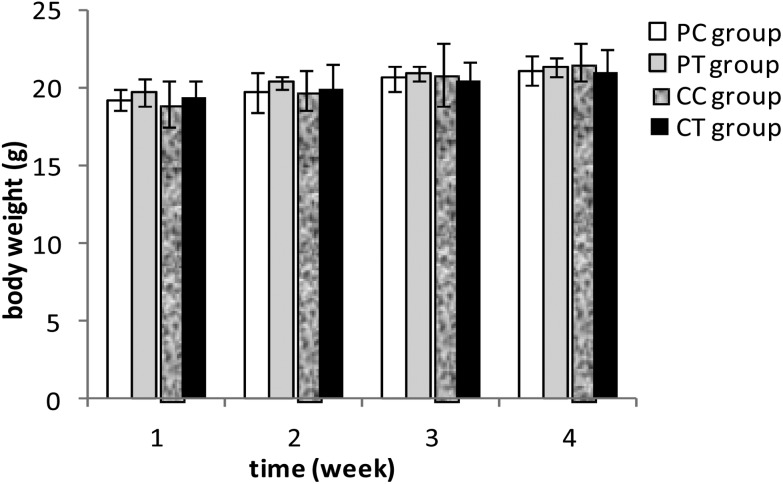
All mice survived to the end of the study and no abnormality was observed by their appearance and activities. No significant difference was found in the body weight between the treatment and the corresponding control groups after gemfibrozil treatment (P > 0.05) (Fig. 4).
Fig. 4. Body weight of mice after 4 weeks’ gemfibrozil treatment. Note: P > 0.05: compared with the PC group and the CC group.
Blood biochemical examination
Compared with the PC group, the content of GLU, CHO, TG, and LDL-C decreased significantly (P < 0.01) and the content of HDL-C increased significantly in the PT group (P < 0.01). In contrast with the CC group, the content of GLU, CHO, TG, and LDL-C decreased significantly (P < 0.05 or P < 0.01) and the content of NEFA increased significantly (P < 0.01) in the CT group (Table 3). No significant difference was discovered for the liver and kidney functional parameters between the treatment and the corresponding control groups.
Table 3. Results of blood biochemistry parameters of mice after 4 weeks’ gemfibrozil treatment.
| Parameters | CC group | CT group | PC group | PT group |
| GLU (mmol L–1) | 5.23 + 0.52 | 4.81 + 0.48Δ | 5.34 + 0.69 | 4.23 + 0.34** |
| CHO (mmol L–1) | 2.55 + 0.33 | 2.23 + 0.23Δ | 2.82 + 0.29 | 1.78 + 0.15** |
| TG (mmol L–1) | 0.94 + 0.12 | 0.69 + 0.11ΔΔ | 1.03 + 0.26 | 0.65 + 0.08** |
| HDL-C (mmol L–1) | 1.91 + 0.26 | 1.74 + 0.21 | 1.25 + 0.11 | 2.22 + 0.34** |
| LDL-C (mmol L–1) | 0.30 + 0.05 | 0.07 + 0.04ΔΔ | 0.23 + 0.04 | 0.07 + 0.01** |
| NEFA (mmol L–1) | 1.39 + 0.16 | 1.84 + 0.12Δ | 1.86 + 0.14 | 1.81 + 0.31 |
| ALT (U L–1) | 37 + 15 | 43 + 14 | 52 + 28 | 46 + 15 |
| AST(U L–1) | 110 + 31 | 99 + 19 | 150 + 44 | 137 + 42 |
| BUN (mmol L–1) | 8.54 + 0.91 | 8.83 + 1.29 | 9.47 + 3.03 | 8.65 + 1.63 |
| CRE (μmol L–1) | 15.41 + 3.37 | 12.89 + 3.25 | 13.88 + 2.03 | 15.68 + 3.82 |
| ALP (U L–1) | 120 + 19 | 121 + 17 | 164 + 19 | 161 + 22 |
Enzyme activity analysis
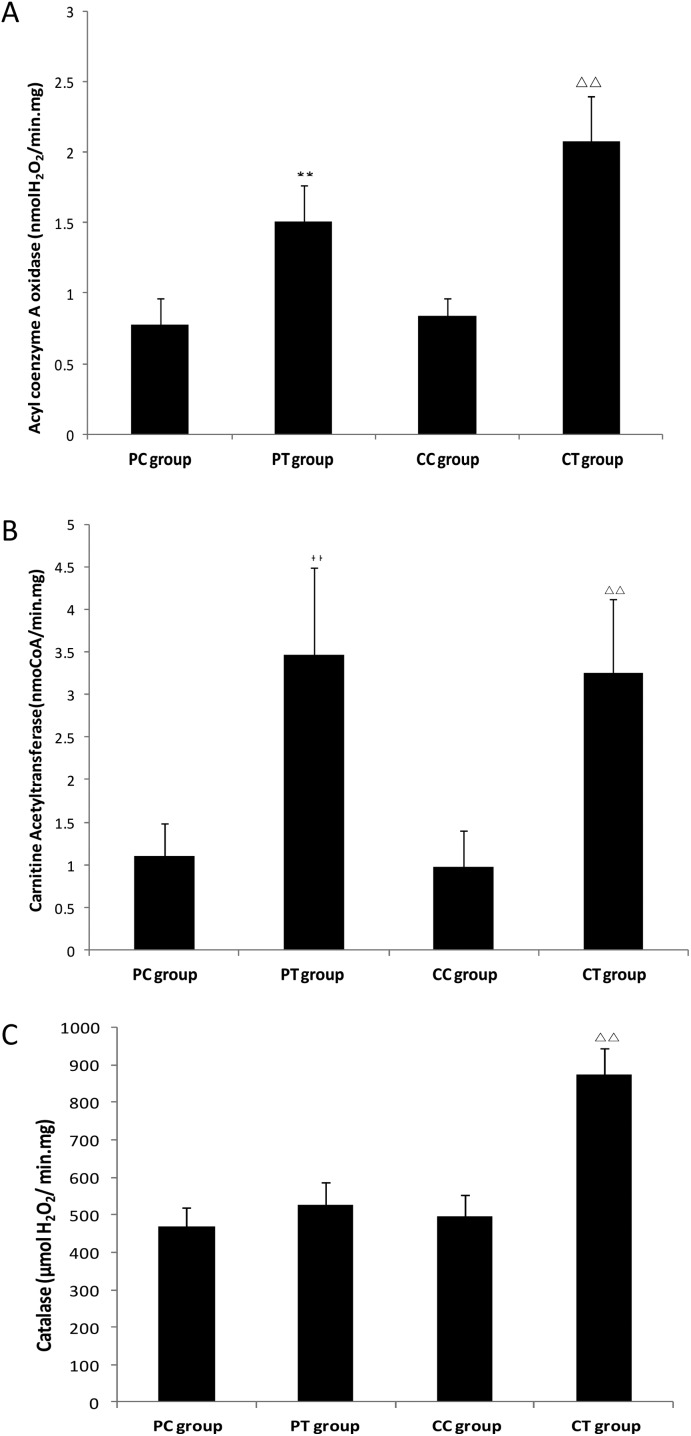
Compared with the CC group, the activities of acyl coenzyme A oxidase, carnitine acetyltransferase and catalase in the CT group increased significantly (P < 0.05 or P < 0.01), and similar changes of enzyme activities were found in the PT group compared with the PC group (P < 0.05) except catalase which displayed no obvious activity change (P > 0.05) (Fig. 5).
Fig. 5. Enzyme activities in crude extraction of liver peroxisome of mice after 4 weeks’ gemfibrozil treatment. Note: A: Activity of acyl coenzyme A oxidase. B: Activity of carnitine acetyltransferase. C: Activity of catalase. **: P < 0.01, compared with the PC group. ΔΔ: P < 0.01, compared with the CC group.
Pathology examination
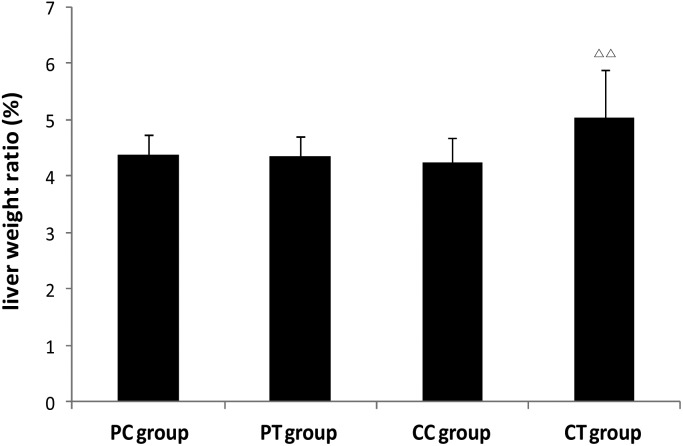
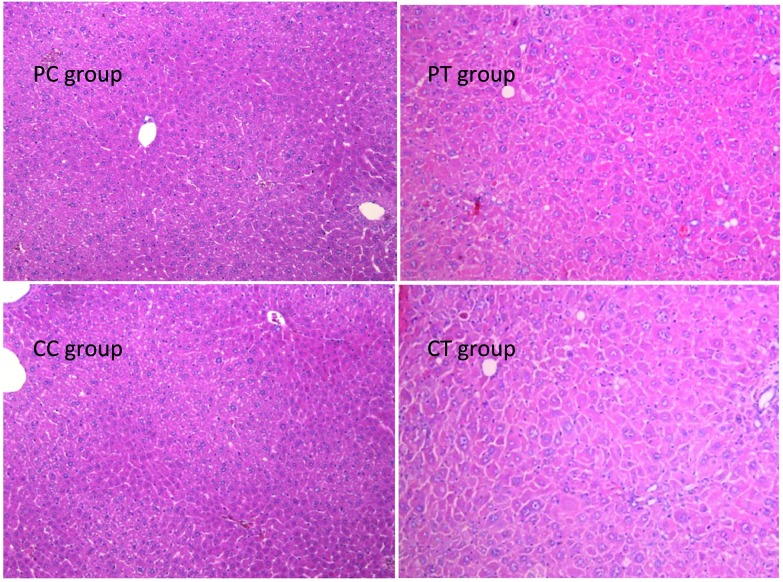
A significant increase of the liver weight and the weight ratio was found in the CT group in contrast with the CC group (P < 0.05, P < 0.01 respectively), whereas no difference was observed between PT and PC groups (Fig. 6). No change was discovered in the weight/weight ratio for the other organs (P > 0.05). Histological results showed that obvious hypertrophy of hepatocytes was induced in CT and PT groups. 6 cases (6/8) of hepatocyte hypertrophy were found in the CT group and 2 cases (2/8) of this were found in the PT group, and the extent of hepatocyte hypertrophy in the CT group was higher than that in the PT group (Fig. 7).
Fig. 6. Changes of the liver weight ratio in animals after 4 weeks’ gemfibrozil treatment. Note: ΔΔ: P < 0.01, compared with the CC group.
Fig. 7. Histological changes of the liver in animals after 4 weeks’ gemfibrozil treatment. Note: Histological examination of the four groups. Hepatocyte hypertrophy and enlarged liver nuclei were observed in PT and CT groups. Magnification: 100×.
Discussion
Hepatamegaly and carcinomas can be induced in rodents with different durations of PP drug administration. In clinics, PP drugs have been used for the treatment of hyperlipidemia for many years without epidemiologic evidence of increased liver cancer.13 However, concerns about the potential risks of damage to the human liver caused by PP drugs still remain. Owing to the fact that PPs exerted their effects through activation of PPARα,14–17 risk assessment of PP drugs with human PPARα transgenic mice may greatly reduce the uncertainty of extrapolating rodent data to humans. In this study, gemfibrozil was administered to the PPARα transgenic mice and wild type mice, respectively, and the effects induced by gemfibrozil were compared to explore the feasibility of preclinical safety evaluation of PP drugs with human PPARα transgenic mice.
The results of tissue distribution showed that the human PPARα gene expressed highly in the liver, heart and kidney of transgenic mice, coincided with the function of PPARα in regulating fatty acid metabolism, and it is similar to the tissue distribution of the mice PPARα gene in wild type mice.18 The lipid metabolism results showed that significant decreases in the content of TG, CHO, and LDL-C were induced by gemfibrozil in the PT group and the CT group, nevertheless the effects of gemfibrozil on HDL-C and NEFA were different between PPARα transgenic mice and C57BL/6J mice. Consistent with our results, Hennuyer N also found that gemfibrozil induced a significant decrease in the content of TG and CHO in serum of rodents with no obvious increase in the content of HDL-C.19,20 In clinical application, gemfibrozil decreases the contents of CHO and TG significantly, simultaneously, it increases the content of HDL-C in patients significantly.21 These results indicate that hypolipidemic effects induced by gemfibrozil, maybe, are not mediated through the same molecule mechanism between PPARα transgenic mice and C57BL/6J mice, and the effect of gemfibrozil on PPARα transgenic mice is more alike to that of humans.
Hepatomegaly and peroxisome proliferation are marker features of rodents after a short period of administration of PPs. After gemfibrozil treatment, hepatomegaly was observed in C57BL/6J mice as revealed by the increased liver weight ratio, while no significant change of the liver weight ratio was observed in PPARα transgenic mice. Histological results showed that hepatocyte hypertrophy was induced in CT and PT groups, however the extent and incidence of liver hypertrophy in the CT group were higher than that in the PT group. To further explain the reason for hepatomegaly and hepatocyte hypertrophy, enzyme activities of crude extraction of peroxisome were analyzed. Catalase is the marker enzyme of peroxisome, and the increase of the enzyme activity indicates the proliferation of peroxisomes in liver parenchymal cells.21 Acyl coenzyme A oxidase and carnitine acetyltransferase play key role in fatty acid metabolism, and acyl coenzyme A oxidase catalyses the first and rate-limiting step of β-oxidation. Our results showed that the activities of all examined enzymes involved in fatty acid metabolism increased in the PT group and the CT group, while the activity of catalase increased only in the CT group, which indicates that proliferation of perosixome was induced in C57BL/6J mice instead of PPARα transgenic mice after gemfibrozil treatment. Cheung C also reported Wy-14,643 (a potent PPARα ligand) induced significant proliferation of peroxisome in wild-type mice, but not in liver-specific humanized PPARα mice, as revealed by the catalase content of the liver.22 Peroxisome proliferation observed in this study perhaps is an important reason for hepatomegaly and hepatocyte hypertrophy in C57BL/6J mice treated with gemfibrozil. Above all, these results manifest that the PPARα transgenic mice are more suitable for safety evaluation of gemfibrozil.
Different effects can be induced by PPs in humans and rodents. Previously it was hypothesized that the species differences to PPs are a combined effects of quantity and quality differences of PPARα. It is estimated that human PPARα expressed in hepatocytes at levels of 5–10% compared to rodents which is sufficient to maintain lipid homeostases instead of growth and peroxisome proliferation of the liver.23 In our study, decreased serum lipid levels were induced while no obvious change of the liver weight ratio and peroxisome proliferation of the liver were induced in PPARα transgenic mice after gemfibrozil treatment. Similar results were also found in PPARα humanized mice.22 The intrinsic differences of PPARα between humans and rodents, including the expression pattern, polymorphisms or mutations in PPARα binding protein and the downstream transcriptional events etc.,24–26 may be more critical for species differences.
In this study, different changes of parameters including blood biochemistry, enzyme activities and histological pathology of the liver have been observed in PPARα transgenic mice and C57BL/6J mice after gemfibrozil treatment. However, further research studies are still necessary to validate whether the species difference effects observed in PPARα transgenic mice and C57BL/6J mice can also be induced by other PP drugs. Hepatomegaly and peroxisome proliferation were induced in C57BL/6J mice while not in PPARα transgenic mice after gemfibrozil treatment. A further study is also needed to make clear the explicit mechanism for different effects observed in this study, such as whether these differences were due to different PPARα expressions or PPARα's different regulations on downstream signal molecules including myc, Annexin A2, CD39 antigen, or caused by other intrinsic differences that are existing, and so on, which will facilitate appropriate safety evaluation of PP drugs.
Conclusion
In conclusion, gemfibrozil induced hypolipidemic effects without changing the liver weight ratio and peroxisome proliferation in PPARα transgenic mice are demonstrated, which are similar to the effects induced in humans. Findings in this study suggest that PPARα transgenic mice could serve as a useful tool for preclinical safety evaluation of PP drugs.
Conflicts of interest
There are no conflicts of interest to declare.
Acknowledgments
This work was granted by the “863 Project” (2013AA020105) and “key project for new drug innovation” (2015ZX09501007-005) from the Ministry of Science and Technology of the People's Republic of China.
References
- Zhu Y., Kan L., Qi C. J. Biol. Chem. 2000;275:13510–13516. doi: 10.1074/jbc.275.18.13510. [DOI] [PubMed] [Google Scholar]
- Issemann I., Green S. Nature. 1990;347:645–650. doi: 10.1038/347645a0. [DOI] [PubMed] [Google Scholar]
- Klaunig J. E., Babich M. A., Baetcke K. P. Crit. Rev. Toxicol. 2003;33:655–780. doi: 10.1080/713608372. [DOI] [PubMed] [Google Scholar]
- Cattley R. C. Toxicol. Pathol. 2004;32(Suppl. 2):6–11. doi: 10.1080/01926230490451680. [DOI] [PubMed] [Google Scholar]
- Cattley R. C., DeLuca J., Elcombe C. Regul. Toxicol. Pharmacol. 1998;27:47–60. doi: 10.1006/rtph.1997.1163. [DOI] [PubMed] [Google Scholar]
- Frick M. H., Elo O., Haapa K. N. Engl. J. Med. 1987;317:1237–1245. doi: 10.1056/NEJM198711123172001. [DOI] [PubMed] [Google Scholar]
- Lee S. S., Pineau T., Drago J. Mol. Cell. Biol. 1995;15:3012–3022. doi: 10.1128/mcb.15.6.3012. [DOI] [PMC free article] [PubMed] [Google Scholar]
- Lake B. G. Xenobiotica. 2009;39:582–596. doi: 10.1080/00498250903098184. [DOI] [PubMed] [Google Scholar]
- Walusimbi-Kisitu M., Harrison E. H. J. Lipid Res. 1983;24:1077–1084. [PubMed] [Google Scholar]
- Bieber L. L., Abraham T., Helmrath T. Anal. Biochem. 1972;50:509–518. doi: 10.1016/0003-2697(72)90061-9. [DOI] [PubMed] [Google Scholar]
- Aebi H., Catalases, in Methods of Enzymatic Analysis, ed. H. U. Bergmeyer, Academic Press, New York, 2nd edn, 1974, pp. 673–684. [Google Scholar]
- Bradford M. M. Anal. Biochem. 1976;72:248–254. doi: 10.1016/0003-2697(76)90527-3. [DOI] [PubMed] [Google Scholar]
- Childs M., Girardot G. Arch. Mal. Coeur Vaiss. 1992;85:129–133. [PubMed] [Google Scholar]
- Nakamura T., Ito Y., Yanagiba Y. Toxicology. 2009;265:27–33. doi: 10.1016/j.tox.2009.09.004. [DOI] [PMC free article] [PubMed] [Google Scholar]
- Albrecht P. P., Torsell N. E., Krishnan P. Toxicol. Sci. 2013;131:568–582. doi: 10.1093/toxsci/kfs318. [DOI] [PubMed] [Google Scholar]
- Foreman J. E., Chang S. C., Ehresman D. J. Toxicol. Sci. 2009;110:204–211. doi: 10.1093/toxsci/kfp077. [DOI] [PubMed] [Google Scholar]
- Gonzalez F. J., Shah Y. M. Toxicology. 2008;246:2–8. doi: 10.1016/j.tox.2007.09.030. [DOI] [PubMed] [Google Scholar]
- Yang Q., Nagano T., Shah Y. Toxicol. Sci. 2008;101:132–139. doi: 10.1093/toxsci/kfm206. [DOI] [PMC free article] [PubMed] [Google Scholar]
- Hennuyer N., Poulain P., Madsen L. Circulation. 1999;99:2445–2451. doi: 10.1161/01.cir.99.18.2445. [DOI] [PubMed] [Google Scholar]
- Cunningham M. L., Collins B. J., Hejtmancik M. R., Herbert R. A., Travlos G. S., Vallant M. K., Stout M. D. PPAR Res. 2010;2010:pii: 681963. doi: 10.1155/2010/681963. [DOI] [PMC free article] [PubMed] [Google Scholar]
- Siavash M., Amini M. J. Res. Pharm. Pract. 2014;3:77–82. doi: 10.4103/2279-042X.141075. [DOI] [PMC free article] [PubMed] [Google Scholar]
- Cheung C., Akiyama T. E., Ward J. M. Cancer Res. 2004;64:3849–3854. doi: 10.1158/0008-5472.CAN-04-0322. [DOI] [PubMed] [Google Scholar]
- Lalwani N. D., Reddy M. K., Qureshi S. A. Hum. Toxicol. 1983;2(1):27–48. doi: 10.1177/096032718300200103. [DOI] [PubMed] [Google Scholar]
- Holden P. R., Tugwood J. D. J. Mol. Endocrinol. 1999;22:1–8. doi: 10.1677/jme.0.0220001. [DOI] [PubMed] [Google Scholar]
- Jia Y., Qi C., Kashireddi P. J. Biol. Chem. 2004;279:24427–24434. doi: 10.1074/jbc.M402391200. [DOI] [PubMed] [Google Scholar]
- Smith C. L., O'Malley B. W. Endocr. Rev. 2004;25:45–71. doi: 10.1210/er.2003-0023. [DOI] [PubMed] [Google Scholar]


