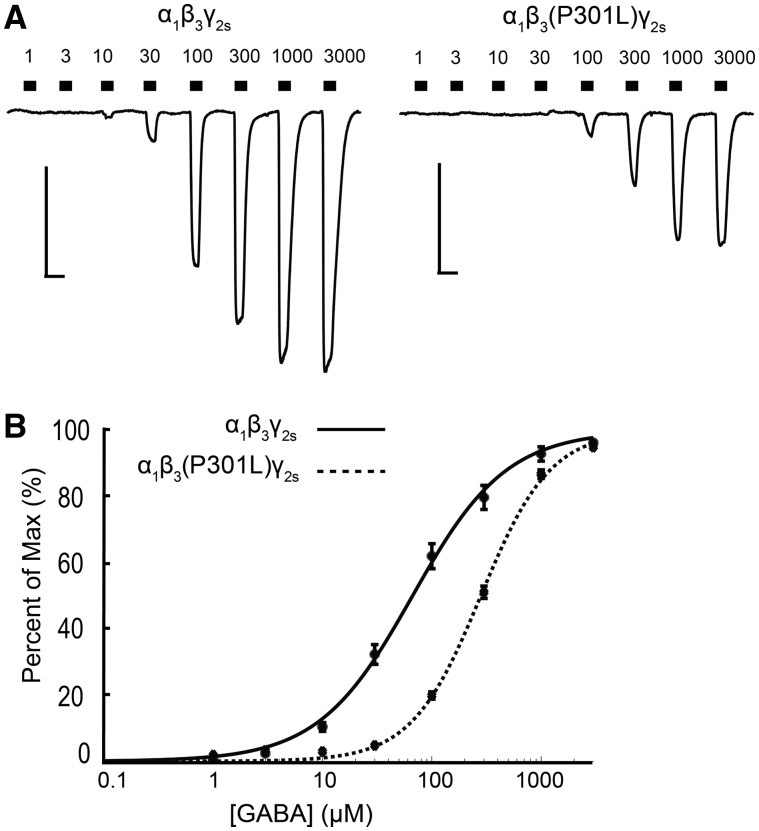
Figure 5.
α1β3(P301L)γ2s receptors are less sensitive to GABA activation. (A) Example trace of GABA concentration-response assays (1–3000 μM) for α1β3γ2s and α1β3(P301L)γ2s receptors expressed in HEK293T cells. Scale bars: horizontal = 5 s, vertical = 500 pA. (B) GABA concentration-response curves for α1β3γ2s (solid line, n = 21 cells) and α1β3(P301L)γ2s (dotted line, n = 20 cells) receptors. Points are mean ± SEM and error bars are not shown where bars are smaller than points. The drawn line is a representative fit based on the average GABA concentration responses.

