Abstract
In vitro assays are widely employed to obtain intrinsic clearance estimates used in toxicokinetic modeling efforts. However, the reliability of these methods is seldom reported. Here we describe the results of an international ring trial designed to evaluate two in vitro assays used to measure intrinsic clearance in rainbow trout. An important application of these assays is to predict the effect of biotransformation on chemical bioaccumulation. Six laboratories performed substrate depletion experiments with cyclohexyl salicylate, fenthion, 4-n-nonylphenol, deltamethrin, methoxychlor, and pyrene using cryopreserved hepatocytes and liver S9 fractions from trout. Variability within and among laboratories was characterized as the percent coefficient of variation (CV) in measured in vitro intrinsic clearance rates (CLIN VITRO, INT; ml/h/mg protein or 106 cells) for each chemical and test system. Mean intralaboratory CVs for each test chemical averaged 18.9% for hepatocytes and 14.1% for S9 fractions, whereas interlaboratory CVs (all chemicals and all tests) averaged 30.1% for hepatocytes and 22.4% for S9 fractions. When CLIN VITRO, INT values were extrapolated to in vivo intrinsic clearance estimates (CLIN VIVO, INT; l/d/kg fish), both assays yielded similar levels of activity (<4-fold difference for all chemicals). Hepatic clearance rates (CLH; l/d/kg fish) calculated using data from both assays exhibited even better agreement. These findings show that both assays are highly reliable and suggest that either may be used to inform chemical bioaccumulation assessments for fish. This study highlights several issues related to the demonstration of assay reliability and may provide a template for evaluating other in vitro biotransformation assays.
Keywords: biotransformation, ring trial, in vitro intrinsic clearance, S9 fractions, hepatocytes, rainbow trout
Hydrophobic organic chemicals released to the environment may accumulate in fish and other aquatic organisms. In general, this behavior reflects the tendency of such chemicals to partition out of water and into tissue lipids. Other chemicals accumulate in fish because of their affinity for specific proteins in blood and tissues. In either case, this accumulation increases the organism’s exposure to the chemical, increasing the risk of adverse effects. For this reason, the potential for chemical bioaccumulation in fish is commonly evaluated when performing chemical hazard assessments, and limits on acceptable levels of accumulation have been prescribed under several legislative frameworks (Gobas et al., 2009).
The potential for a chemical to accumulate in fish may be evaluated using standardized in vivo test methods (eg, OECD Test Guideline 305; OECD, 2012), but these methods are expensive, time-consuming, and require a large number of animals. More commonly, bioaccumulation assessments are performed using predictive computational models. One-compartment mass-balance models, such as those given by Arnot and Gobas (2003, 2004), are preferred for most screening-level assessments. Physiologically based toxicokinetic (PBTK) models have also been promoted as tools for bioaccumulation assessment (Brinkman et al., 2016; Stadnicka et al., 2012). Because they describe chemical accumulation in specific tissues and organs, PBTK models are well suited for relating in vitro effect concentrations to environmental exposures that would result in comparable in vivo chemical concentrations (“reverse toxicokinetics”; Wetmore et al., 2012).
A critical input to both model types is the rate of hepatic biotransformation. Researchers have long known that biotransformation may reduce the extent of chemical accumulation in fish (de Wolf et al., 1992; Oliver and Niimi, 1985; Southworth et al., 1980). However, unlike most other inputs to the models (eg, rates of chemical flux across the gills), the rate of biotransformation cannot be predicted with any confidence from chemical hydrophobicity (eg, log KOW). For this reason, biotransformation represents the principal source of uncertainty in many bioaccumulation assessments for fish (Nichols et al., 2009).
In order to improve in silico predictions of chemical bioaccumulation in fish, methods are needed to estimate hepatic biotransformation and incorporate this information into established computational models. One promising approach involves the measurement of intrinsic clearance using in vitro metabolizing systems derived from liver tissue (Nichols et al., 2006). This approach is based on methods pioneered by the pharmaceutical industry for preclinical screening of drug candidates (Rodrigues, 1997), and involves the measurement of biotransformation under nonsaturating conditions. The estimated rate of intrinsic clearance may be used directly as an input to PBTK models for fish (in the mass-balance equation for liver tissue). Alternatively, this value may be extrapolated to the whole animal to calculate a first-order metabolism rate constant (kM), which is used as an input to one-compartment bioaccumulation models. Several research groups have shown that incorporating in vitro metabolism data into one-compartment models for fish substantially improves model performance; that is, predicted levels of accumulation are much closer to measured values than predictions obtained assuming no metabolism (Cowan-Ellsberry et al., 2008; Dyer et al., 2008; Gomez et al., 2010; Han et al., 2007, 2009; Laue et al., 2014).
The use of in vitro data in a regulatory setting requires, however, that the methods used to generate this information are shown to be reliable. In this context, the term “reliability” refers to both repeatability (the ability of one user to generate the same result) and reproducibility (the ability of multiple users to obtain the same result). With regard to in vitro measurement of biotransformation, additional questions relate to the utility of different metabolizing systems and the need to account for differences in activity of starting material. Here we describe the results of an international ring trial involving 6 laboratories, each of which evaluated 6 test chemicals using two in vitro metabolizing systems: cryopreserved trout hepatocytes (RT-HEP) and trout liver S9 fractions (RT-S9). The ring trial was conducted with the goal of assessing intralaboratory variability (repeatability) and interlaboratory variability (reproducibility) in assay performance. Measured in vitro intrinsic clearance rates were then extrapolated to common units of in vivo intrinsic clearance (l/d/kg fish) to permit direct comparisons between the two assay systems and provide a basis for predicting chemical-specific bioconcentration factors (BCFs). The BCF is defined as the steady-state chemical concentration in a fish divided by that in water, assuming a water-only exposure, and is a well-known metric of chemical bioaccumulation that is used extensively for regulation of environmental contaminants (Gobas et al., 2009).
MATERIALS AND METHODS
Test chemical selection
The test chemicals cyclohexyl salicylate (CS), fenthion (FEN), 4-n-nonylphenol (4NP), deltamethrin (DM), methoxychlor (MC), and pyrene (PYR) were selected based on their relative hydrophobicity, ease of analysis, and the existence of measured bioaccumulation data for fish. Table 1 presents the structure and measured log KOW value for each chemical, whereas Table 2 presents measured and modeled BCFs. Predicted BCFs were obtained using an established model (Arnot and Gobas, 2003; as implemented within the in vitro–in vivo extrapolation model given by Nichols et al., 2013b). The BCFs given in column 3 were generated under the assumption of no metabolism, and reflect the extent of chemical accumulation predicted from simple partitioning considerations. Absent biotransformation, each chemical would be expected to accumulate substantially in fish (BCFs ranging from about 600 to 23 000). Generally, however, measured BCFs are considerably lower than modeled values. All test chemicals except DM have been evaluated previously using in vitro assays derived from trout liver, thereby providing an opportunity to compare measured rates of activity to published values.
Table 1.
Test Chemicals Used to Evaluate the Reliability of In Vitro Substrate Depletion Assays
| Chemical | Structure | Log KOW | Previous Use in In Vitro Studies With RT-HEP and RT-S9 |
|---|---|---|---|
| Cyclohexyl salicylate | 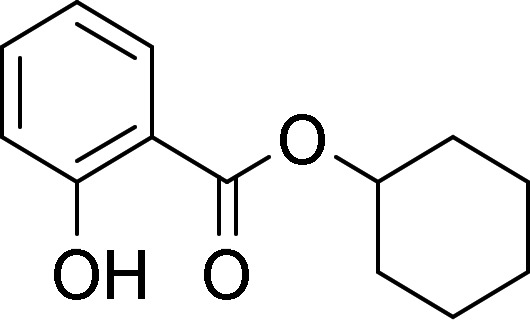 |
4.70a | Laue et al. (2014) |
| Fenthion | 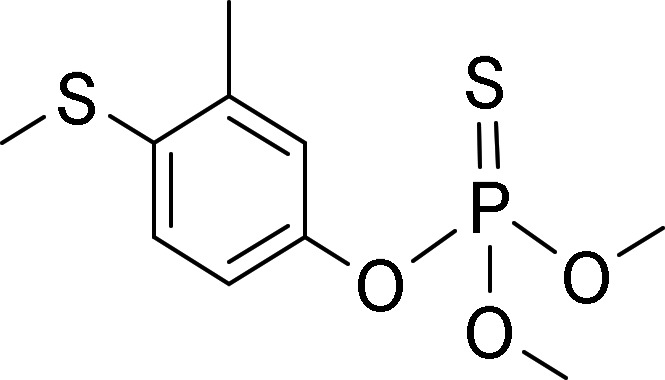 |
4.09b | Fay et al. (2014b) |
| 4-n-Nonylphenol |  |
5.76b | Mingoia et al. (2010),Han et al. (2007, 2008, 2009) Fay et al. (2014b) |
| Deltamethrin | 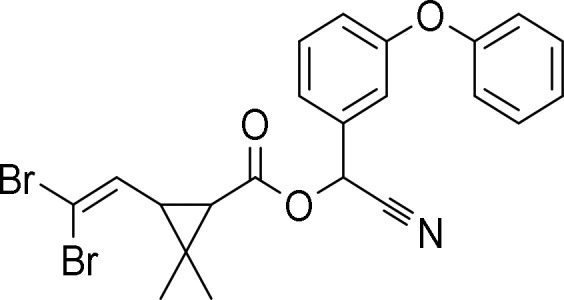 |
6.20b | Not tested |
| Methoxychlor | 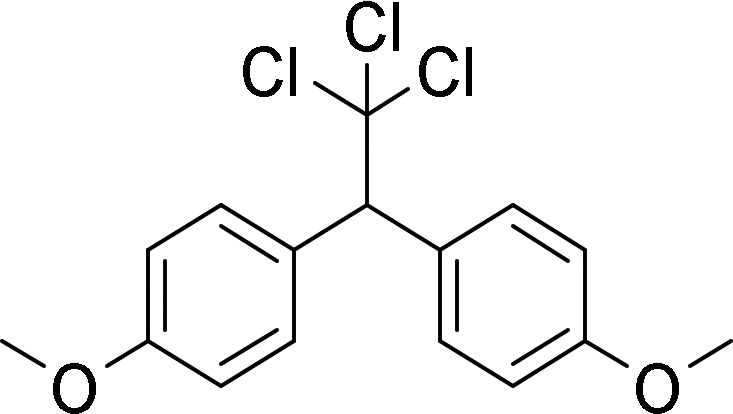 |
5.08b | Fay et al. (2014b)Bischof et al. (2016) |
| Pyrene | 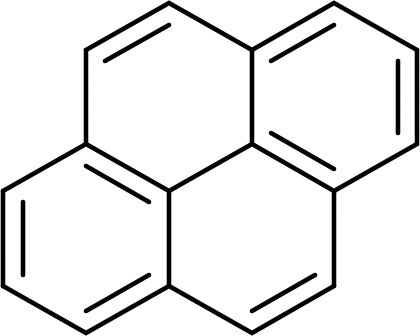 |
4.88b | Fay et al. (2014a, 2017) Mingoia et al. (2010),Nichols et al. (2013a,b, 2017) |
Measured value given by Laue et al. (2014).
Measured values from the U.S. EPA EPI Suite experimental database (U.S. EPA, 2012).
Abbreviations: RT-HEP, cryopreserved rainbow trout hepatocytes; RT-S9, rainbow trout liver S9 fractions.
Table 2.
Comparison of Measured and Modeled Chemical Bioconcentration Factors (BCFs; l/kg)
| Chemical | Measured In Vivo BCFsa (From Literature) | BCF Model Predictions Assuming No Biotransformationb | BCF Model Predictions ObtainedUsing In Vitro Rates of Biotransformation (RT-HEP and RT-S9)b,c |
|||
|---|---|---|---|---|---|---|
| RT-HEPfU = fU, P/fU, HEP | RT-HEPfU = 1.0 | RT-S9fU = fU, P/fU, S9 | RT-S9fU = 1.0 | |||
| Cyclohexyl salicylate | 400d | 2371 | 217 ± 11 | 181 ± 1 | 448 ± 50 | 181 ± 1 |
| Fenthion | 182e | 607 | 277 ± 43 | 117 ± 2 | 192 ± 19 | 113 ± 1 |
| 4-n-Nonylphenol | 290f | 16 549 | 2909 ± 676 | 321 ± 14 | 3891 ± 590 | 381 ± 22 |
| Deltamethrin | 115g | 22 900 | 4070 ± 1259 | 311 ± 29 | 2275 ± 359 | 286 ± 10 |
| Methoxychlor | 174h | 5229 | 3835 ± 398 | 446 ± 84 | 3359 ± 113 | 423 ± 18 |
| Pyreneh | 78i | 3490 | 709 ± 78 | 213 ± 2 | 316 ± 21 | 204 ± 1 |
Additional details on in vivo BCF studies are included in OECD Project 3.13 Study Report, Annex 10 (OECD, 2017).
Generated using models given by Nichols et al. (2013b). The models were run assuming a 10 g fish containing 5% lipid, exposed at 12°C.
For all chemicals except PYR, reported BCFs represent the interlaboratory mean ± SD (n = 6). Interlaboratory means were based on intralaboratory means for each laboratory. Intralaboratory means were based in turn on in vitro datasets for 3 independent runs. For PYR, BCFs represent the mean ± SD of all interlaboratory means (n = 5), where PYR was run in parallel with a given test chemical.
Average of two measured steady state values for zebrafish (RIFM study); cited in Laue et al. (2014).
Average of 36 studies/measurements for medaka, guppies, goldfish, and minnows (Tsuda et al., 1993, 1995, 1996, 1997).
Average of 6 measurements for fathead minnows (Giesy et al., 2000; Snyder et al., 2001).
Modeled value for rainbow trout based on measured parent chemical concentrations at the lowest dissolved organic carbon concentration (Muir et al., 1994).
Measured 140 d value for sheepshead minnows (Hansen and Parrish, 1977).
Average of 4 measured 36 d values for sheepshead minnows (Jonsson et al., 2004).
Chemicals and supplies
CS was provided by Givaudan Schweiz AG. FEN, 4NP, DM, MC, and PYR were obtained from Sigma-Aldrich (St. Louis, MO), as were the internal standards anthracene (ANT), 4-n-nonylphenol-2,3,5,6-d4 (4NP-d4), methyl laurate (ML), and permethrin (PM). Fenthion-d6 (FEN-d6) and methoxylchor-d6 (MC-d6) were purchased from C/D/N Isotopes (Pointe-Claire, Quebec, Canada). With the exception of CS, all laboratories ordered test chemicals from the same commercial lots. Additional information pertaining to test chemicals and internal standards is provided in Supplementary Table 1. Dulbecco’s modified Eagle’s medium (low glucose) and Leibovitz-15 (L-15) medium were purchased from Life Technologies (Carlsbad, CA). β-Nicotinamide adenine dinucleotide phosphate was supplied by Oriental Yeast Co. (Osaka, Japan) or Enzo Life Sciences (Exeter, UK). Adenosine 3′-phosphate 5′-phosphosulfate lithium salt was purchased from Sigma-Aldrich or EMD Millipore (Temecula, CA). Reduced l-glutathione was obtained from Sigma-Aldrich or Thermo Fisher Scientific (ACROS Organics; Geel, Belgium). Uridine 5′-diphosphoglucuronic acid trisodium salt, alamethicin, and all other reagents and solvents were obtained from Sigma-Aldrich.
Animals
Rainbow trout (Oncorhynchus mykiss) were obtained from the USGS Upper Midwest Environmental Sciences Center (La Crosse, WI). The fish were fed a commercial trout chow (Classic trout; Skretting, Tooele, UT) and maintained at 11 ± 1°C under a 16:8-h light:dark cycle. Water used for fish holding was obtained directly from Lake Superior (single-pass, sand-filtered, and UV-treated) and had the following characteristics: alkalinity 43–47 mg/l as CaCO3, pH 7.2–7.8, and dissolved O2 85%–100% of saturation. All trout holding conditions and experimental procedures were approved by an Institutional Animal Care and Use Committee in accordance with principles established by the Interagency Research Animal Committee.
The mean weight of fish sampled to obtain isolated hepatocytes was 395.5 ± 83.4 g, whereas that of fish used to obtain liver S9 fractions was 322.9 ± 42.0 g. The sexual maturity of each animal was evaluated by determining its gonadosomatic index (GSI; mass of gonads/total body mass × 100). Measured GSI values suggested that all fish were in very early stages of sexual maturation (Gomez et al., 1999; Le Gac et al., 2001).
Preparation and characterization of cryopreserved trout hepatocytes and trout liver S9 fractions
RT-HEP and RT-S9 were generated in one location (U.S. Environmental Protection Agency, Mid-Continent Ecology Division, Duluth) and shipped to the other participating laboratories. All donor fish were drawn from the same mixed sex population of animals. RT-HEP were obtained using methods given by Fay et al. (2015). Each sample lot contained cells from 7 animals. The fresh cells were suspended in buffer containing dimethyl sulfoxide, aliquoted into 1.8 ml cryogenic sample vials, and transferred to the vapor phase of liquid N2 for freezing and storage. RT-S9 were prepared as described by Johanning et al. (2012a). Sample lots used to measure in vitro enzyme activity contained S9 fractions from 3 (CS, 4NP, FEN, and DM) or 6 (MC) fish. An additional sample lot, obtained using pooled material from 4 fish, was prepared for use as enzymatically inactive control material. Individual sample lots were aliquoted (150 µl) into 0.5 ml reaction tubes, frozen by immersion in liquid N2 and stored at –80°C. RT-HEP and RT-S9 were shipped together in the vapor phase of liquid N2.
RT-HEP and RT-S9 from each sample lot were characterized using model substrates for CYP1A, uridine diphosphate glucuronosyltransferase (UGT), and glutathione-S-transferase (GST). CYP1A plays a major role in biotransformation of hydrophobic contaminants by fish (Schlenk et al., 2008), whereas glucuronidation is thought to be the most important phase II conjugation reaction (Clarke et al., 1991; James, 1986). CYP1A activity was determined by measuring the rate of 7-ethoxyresorufin O-dealkylation (EROD assay). UGT activity was characterized by measuring glucuronidation of p-nitrophenol. GST activity was assessed by measuring glutathione conjugation of 1-chloro-2,4-dinitrobenzene. Characterization assays run using RT-HEP were performed on cell lysates as described by Fay et al. (2014a), whereas RT-S9 were characterized using methods given by Nichols et al. (2013a). The protein content of cell lysates and RT-S9 were determined using Peterson’s modification of the Lowry method (Sigma technical bulletin TP0300; Sigma-Aldrich). All characterization assays were performed on thawed material at the laboratory of origin.
Hepatocyte yield and viability
Thawed hepatocytes were evaluated in the presence of 0.04% trypan blue to determine cell yield and viability (Fay et al., 2015). These suspensions were then diluted to the desired concentration of viable cells (1 or 2 × 10⁶ cells/ml) in L-15 and recounted for accuracy.
Preparation of enzymatically inactive material
Hepatocyte suspensions (2 × 10⁶ cells/ml in L-15 medium) and S9 fractions (∼25 mg/ml protein in 100 mM potassium phosphate buffer) were inactivated by boiling for 15 min in a 100°C water bath. For hepatocyte suspensions, the final volume was adjusted by addition of L-15 to maintain the concentration of enzymatically inactive material. For the S9 material, the final volume was adjusted with phosphate buffer to twice the original volume. The sample was then homogenized with a mortar and pestle so that it could be pipetted into cryogenic sample vials for freezing and storage. All heat-inactivated samples were prepared in advance in one location (U.S. EPA, MED, Duluth) and stored at –80°C before shipping to the other participating laboratories.
Experimental design
The study design was informed by a statistical analysis of two previous multi-laboratory studies conducted using RT-HEP (Fay et al., 2014b) and RT-S9 (Johanning et al., 2012b). An analysis of these findings was performed using a linear-mixed effects (LMEs) model (McCulloch et al., 2008) to determine which factors contributed the most to variability in measured rates of biotransformation. The LME model was fit with restricted maximum likelihood to model intrinsic clearance as a population parameter, chemical and sampling time point as fixed effects, and laboratory, run (number of independent assays) and replicate vial (number of vials per time point) as random effects. Likelihood-ratio tests (LRTs; Graybill, 1976) were then performed to determine whether the contribution of a variance component to overall variability in the data was statistically significant (p < .05). The LRT analysis showed that the contribution of replicate vial effects to overall variability was not significant. In contrast, the contribution of run effects was not significant for active hepatocytes, but was significant for enzymatically inactive hepatocytes, and for both active and heat-inactivated S9 fractions. A detailed description of these analysis methods and subsequent findings is provided in the OECD Project 3.13 Study Report, Annex 4 (OECD, 2017).
The final study design involved 6 laboratories (A–F) located in Europe (2) and the United States (4). This group included 4 industry laboratories, an academic laboratory, and a private research institute. A separate government laboratory provided the biological material as well as analytical support. Each of the laboratories A–F evaluated 6 chemicals (CS, FEN, 4NP, DM, MC, and PYR) using both RT-HEP and RT-S9. Assays performed using CS, FEN, 4NP, DM, and MC were conducted with specific lots of biological material. PYR, employed as an internal reference chemical, was run in parallel with each of the other 5 test chemicals to obtain a dataset covering all lots of biological material. Three runs, conducted on different days, were performed for each test chemical and biological matrix. Each run was performed using a single reaction vial (one replicate), with one subsample withdrawn at each of 7 sampling time points.
Substrate depletion assays
In vitro intrinsic clearance rates were measured using a substrate depletion approach (Fay et al., 2015; Johanning et al., 2012a). Brief descriptions of each assay are provided as Supplementary Data (In vitro methods). Preliminary assays were conducted to evaluate the substrate concentration-dependence of activity, assess the kinetics of depletion, and optimize the sampling schedule. This information was then used to identify the lowest starting substrate concentration that would yield high quality measurements across most or all of the sampling times, taking into consideration the rate of activity and the analytical method limit of detection. Additional preliminary studies were conducted to determine stopping conditions (solvent type and ratio of sample to solvent), optimize extraction procedures, and ensure that there were no analytical interferences. The final reaction conditions for each test chemical are described in Supplementary Table 2.
Chemical analyses
Samples containing CS and MC were analyzed by gas chromatography/mass spectrometry (GC/MS). DM was analyzed by GC with tandem mass spectrometry, FEN and 4NP were analyzed by liquid chromatography with tandem mass spectrometry, and PYR was analyzed by high performance liquid chromatography with fluorescence detection. All samples generated for each test chemical were shipped to one laboratory for analysis. The purpose of this approach was to limit analytical variability as a contributing factor when making interlaboratory comparisons. Details pertaining to methods, instrumentation, and the laboratory responsible for analysis of test and reference chemicals are provided as Supplementary Data (Analytical methods).
Determination of in vitro intrinsic clearance
Measured chemical concentrations were log10-transformed and plotted against time to determine a first-order elimination rate constant (k; 1/h, equal to –2.3 × slope). Rate constants determined in the S9 assay were divided by protein concentration (mg/ml) to calculate in vitro intrinsic clearance (CLIN VITRO, INT; ml/h/mg protein). For the hepatocyte assay, CLIN VITRO, INT (ml/h/106 cells) was determined by dividing k by the measured concentration of viable cells.
Analysis of in vitro intrinsic clearance data
Intra- and interlaboratory variability were characterized as the percent coefficient of variation (CV; equal to the standard deviation/mean × 100%) in measured values. Intralaboratory variability in yield and viability of RT-HEP was calculated from a laboratory’s daily averages for each cell lot. Interlaboratory variability in these measurements was then calculated for each cell lot from overall averages determined by each laboratory. Intralaboratory variability in CLIN VITRO, INT was calculated from values determined for 3 independent runs. Interlaboratory variability in CLIN VITRO, INT was calculated from overall averages determined by each laboratory for each test chemical. CVs calculated using RT-HEP and RT-S9 data were compared using a Wilcoxon sum-rank (also known as a Mann–Whitney U) test. A p-value < .05 was considered to be statistically significant.
The potential for laboratory bias in CLIN VITRO, INT measurements was evaluated by ranking average values determined by each laboratory for CS, FEN, 4NP, DM, and MC from 1 to 6 (low to high). Additional ranks were obtained for PYR, which was evaluated in parallel with the other 5 test chemicals. The rank data for each in vitro test system were then evaluated using Friedman’s test (a nonparametric equivalent of an ANOVA applicable to complete block designs) with laboratory as the treatment effect blocked on each chemical tested. Every PYR test was treated as a different block. Because one laboratory did not test PYR in parallel with MC, PYR data collected during the MC studies was omitted from the analysis, giving 9 chemical blocks in total. Pairwise comparisons of laboratory rank were performed a posteriori using Conover’s test with Bonferroni-Holm adjusted p-values.
A second analysis using the Kendall rank correlation test was performed to test whether the rank determined for a given test chemical was correlated with the rank determined for PYR, run in parallel with the same chemical. Due to the lack of a complete PYR dataset, the MC studies were excluded from this analysis. This resulted in 4 comparisons (one each for CS, FEN, 4NP, and DM) per laboratory.
Clearance rate comparisons among in vitro test systems
To provide a direct basis for comparing the two in vitro test systems, CLIN VITRO, INT values determined using each system were extrapolated to common units of in vivo intrinsic clearance (CLIN VIVO, INT; l/d/kg fish). Scaling factors used to perform these extrapolations (163 mg S9 protein/g liver and 510 × 106 hepatocytes/g liver) were based on earlier work with sexually immature trout of the same age, source, and strain (Fay et al., 2014a; Nichols et al., 2013b). Liver size as a fraction of total body weight was set equal to the value (0.015) determined by Schultz and Hayton (1999) for small trout typical of those used in bioconcentration testing efforts.
CLIN VIVO, INT values calculated for CS, FEN, 4NP, DM, and MC, using data from both in vitro test systems, were compared using a two-way ANOVA, applying a Bonferroni–Holm adjustment to a posteriori intrachemical comparisons. Due to the large range of calculated values, a log10 transformation was applied prior to the analysis. Because PYR was employed in the study in a unique manner, direct comparisons between the two in vitro test systems for this chemical were made independently using a standard unpaired t-test.
CLIN VIVO, INT values calculated for each chemical and test system were then used as inputs to a well-stirred liver model to obtain a set of hepatic clearance estimates (CLH; l/d/kg fish) (Rowland et al., 1973; Wilkinson and Shand, 1975).
In this model, QH (l/d/kg fish) is liver blood flow rate and fU (unitless) is a binding term used to correct for binding effects in vitro and in blood plasma. For this evaluation, QH was calculated as 0.259 times the estimated cardiac output in small (10 g) trout commonly employed for standardized bioconcentration testing (Nichols et al., 2013b). Initially, the binding term fU was calculated as the ratio of unbound chemical fractions in blood plasma (fU,P) and in the in vitro test system (fU,HEP or fU,S9) (“restricted clearance”). Empirically based algorithms used to estimate these binding terms are described by Nichols et al. (2013a) and Fay et al. (2017). A second analysis was then performed by setting fU equal to 1.0 (“unrestricted clearance”). This approach assumes that chemical bioavailability to metabolizing enzymes in vitro and in vivo is effectively the same.
Prediction of chemical BCFs
Finally, CLIN VITRO, INT values determined using both in vitro test systems were used as inputs to two spreadsheet models (RT-HEP and RT-S9) that predict biotransformation impacts on chemical bioconcentration in trout (Nichols et al., 2013b). These models perform the in vitro–in vivo extrapolation described above to predict CLH. The CLH estimate is then extrapolated to a first-order whole-body elimination rate constant (kM; 1/d) which is used as an input to a one-compartment bioconcentration model (Arnot and Gobas, 2003). The spreadsheet models are designed to predict BCF values for juvenile rainbow trout (10 g, 5% lipid content, tested at 12°C) typically used in standardized in vivo testing efforts (OECD, 2012). Additional rate constants that describe chemical uptake across the gills, elimination across the gills, and egestion in feces are calculated from chemical log KOW using empirically based relationships. Details pertaining to the development of these relationships are provided elsewhere (Arnot and Gobas, 2003). BCFs predicted using in vitro data were then compared with BCFs measured previously in controlled laboratory exposures as well as modeled BCFs predicted under the assumption of no biotransformation.
RESULTS
Characterization of Cryopreserved Hepatocytes and Liver S9 Fractions
EROD, UGT, and GST activities for individual lots of RT-HEP averaged 5.43 ± 1.20 pmol/min/mg protein, 225 ± 19 pmol/min/mg protein, and 425 ± 32 nmol/min/mg protein, respectively (Supplementary Table 3). In each case, these are basal rates of activity measured under saturating substrate conditions. As such, the data can be used to assess variability in Vmax values for each reaction pathway among the pooled cell lots. A similar evaluation of RT-S9 samples yielded means of 5.49 ± 0.44 pmol/min/mg protein, 1178 ± 109 pmol/min/mg protein, and 889 ± 159 nmol/min/mg protein, respectively. All measured rates are within 50% of values determined previously for RT-HEP and RT-S9, obtained from trout of the same strain. For example, Fay et al. (2017) reported EROD, UGT, and GST activities of 6.2 ± 2.2 pmol/min/mg protein, 309 ± 66 pmol/min/mg protein, and 260 ± 44 nmol/min/mg protein, respectively, for RT-HEP. Measured activities reported previously for RT-S9 (both sexes) averaged 7.49 ± 0.46 pmol/min/mg protein, 769 ± 106 pmol/min/mg protein, and 497 ± 28 nmol/min/mg protein, respectively (Nichols et al., 2013a).
Yield and Viability of Thawed Hepatocytes
Averaged across all 6 laboratories, the yield for each cell lot ranged from 28.1% to 35.3%, whereas cell viability ranged from 85.5% to 87.2% (Supplementary Table 4). The intralaboratory variability in replicated cell yield determinations ranged from 2.1% to 37.7%. Intralaboratory variability in cell viability measurements ranged from 0.2% to 5.8%. For each corresponding cell lot and testing laboratory, the variability in cell yield was greater than that for cell viability (n = 30). The interlaboratory variability in cell yield for each cell lot was relatively large, resulting in CVs that ranged from 14.4% to 40.7%. The interlaboratory variability in cell viability measurements ranged from 4.6% to 6.5%.
In Vitro Intrinsic Clearance
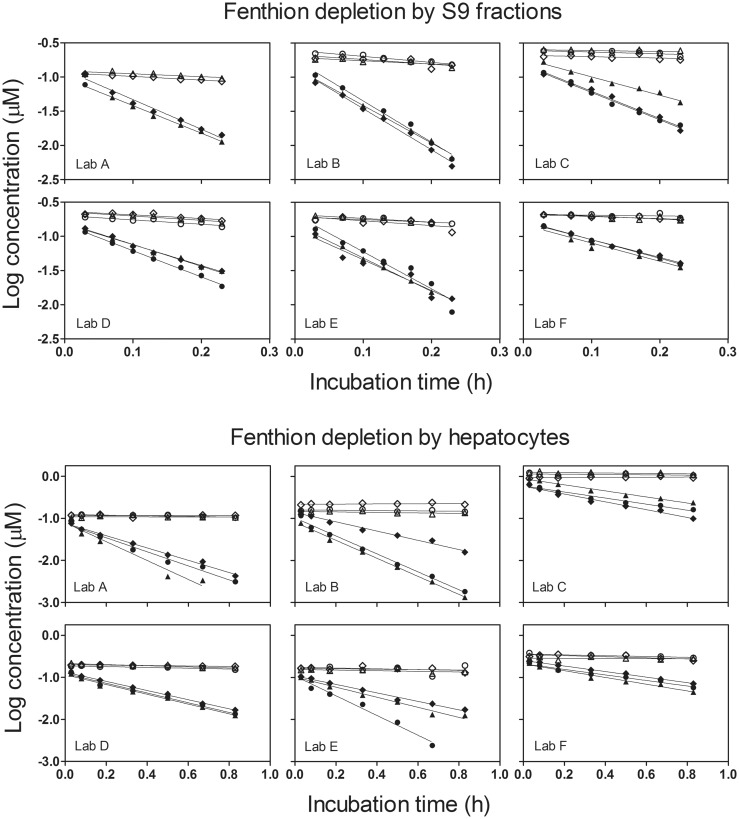
Figure 1 shows the complete set of depletion data for FEN, generated using both RT-HEP and RT-S9. Qualitatively similar results were obtained for the other 5 test chemicals (Supplementary Figs. 1–4). The data for active samples generally exhibited the expected log-linear decrease in chemical concentration, and in each case the slope derived from the fitted linear regression was significantly different from 0. A close examination of Figure 1 suggests, however, that there was a slow rate of chemical depletion from heat-inactivated S9 controls. Similar results were obtained in S9 assays performed using CS and DM. In contrast, there was little or no indication of chemical depletion from heat-inactivated hepatocytes for any of the test chemicals.
Figure 1.
In vitro biotransformation of fenthion (FEN) by rainbow trout liver S9 fractions (RT-S9) and cryopreserved rainbow trout hepatocytes (RT-HEP). Each panel shows data from one laboratory. Different symbol shapes represent measured concentrations from 3 independent experiments performed on different days. Filled symbols represent data derived from active biological material, whereas open symbols represent data from enzymatically inactive controls. Depletion curves shown for the RT-HEP assays do not take into account small differences in cell concentration between runs (typically ± 25% of nominal). Lines shown in each panel represent linear regression equations fitted to the data from independent runs.
Follow-up studies were conducted with all test chemicals to determine whether the apparent loss from heat-inactivated S9 samples was real or an artifact. For this effort, S9 samples from the same experimental lot were inactivated by allowing samples to stand at room temperature overnight (benchtop method). The reactions were then run in the absence of added cofactors. In all but one case (4NP), depletion rates for samples treated in this manner were statistically indistinguishable from 0. For 4NP, optimal results (ie, no significant depletion) were obtained using heat-inactivated samples; nevertheless, the loss from samples inactivated by time and the omission of cofactors was negligible. It is unlikely, therefore, that the apparent loss of chemical from heat-inactivated S9 samples reflected a true loss of chemical from the system. Based on these findings, CLIN VITRO, INT values for all chemicals and both test systems were calculated using measured rates of depletion from active samples without additional correction.
The rank order of CLIN VITRO, INT determined using RT-HEP was: CS > FEN > 4NP > DM > MC, whereas that determined using RT-S9 was: CS > FEN > DM > 4NP > MC (Figs. 2 and 3). For the hepatocytes, clearance rates averaged for each chemical across all 6 laboratories ranged from 0.08 ml/h/106 cells to 10.80 ml/h/106 cells, a 135-fold difference. The range of measured activities was somewhat lower for RT-S9 (0.32 ml/h/mg protein to 21.50 ml/h/mg protein, a 67-fold difference). Measured CLIN VITRO, INT values and associated CVs for each test system are summarized in Supplementary Tables 5 and 6. For clarity, intralaboratory CVs determined by one laboratory for a single chemical are referred to as “lab-specific” values, whereas intralaboratory CVs averaged across all 6 laboratories for a single chemical (appearing under the column heading “Mean CV (%)”) are termed “chemical specific” values. Chemical-specific intralaboratory CVs that were calculated from activities measured using RT-HEP were generally similar, ranging from 16.3% to 22.7%. The range of chemical-specific intralaboratory CVs determined using RT-S9 data (4.8% to 28.7%) was somewhat larger; however, this finding was largely driven by three unusually high lab-specific values for one chemical (DM). The mean of all 5 chemical-specific intralaboratory CVs calculated for RT-HEP (18.6% ± 3.0%) was greater than that determined for RT-S9 (14.1% ± 8.9%), but this difference was not significant (p = .151). Interlaboratory CVs developed using RT-HEP data (mean, across all chemicals = 32.4% ± 4.1%) were significantly larger (p = .012) than those generated using data from RT-S9 (mean, across all chemicals = 17.7% ± 6.8%). In every case, the chemical-specific intralaboratory CV calculated for a given chemical and test system was smaller than the corresponding interlaboratory CV. The lowest calculated interlaboratory CV (9.4%) was associated with metabolism of MC by RT-S9. As noted above, MC was the most slowly metabolized of all test chemicals in both systems. Overall, however, there were no clear trends for either test system regarding interlaboratory CVs and the rank order of chemical clearance.
Figure 2.
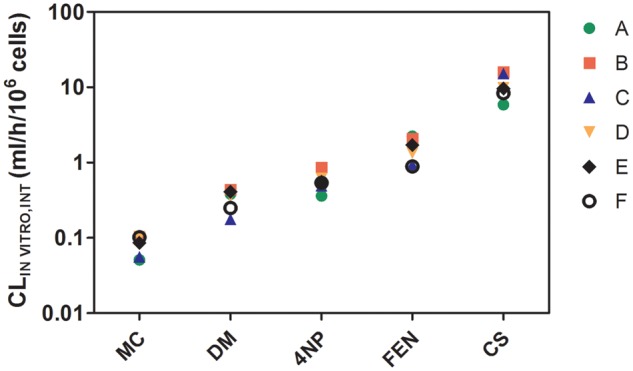
In vitro intrinsic clearance rates (CLIN VITRO, INT) for methoxychlor (MC), deltamethrin (DM), 4-nonylphenol (4NP), fenthion(FEN), and cyclohexyl salicylate (CS), determined using cryopreserved rainbow trout hepatocytes (RT-HEP). The symbols represent intrinsic clearance rates measured by 6 different laboratories (A–F). Each symbol represents the mean of 3 independently determined values. Variances associated with each of these means are given in Supplementary Table S5.
Figure 3.
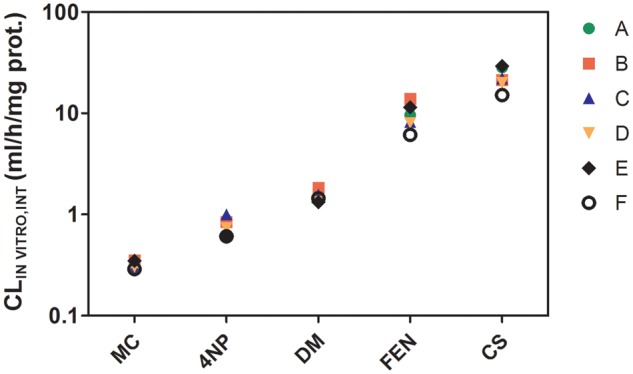
In vitro intrinsic clearance rates (CLIN VITRO, INT) for MC, 4NP, DM, FEN, and CS, determined using rainbow trout liver S9 fractions (RT-S9). The symbols represent intrinsic clearance rates measured by 6 different laboratories (A–F). Each symbol represents the mean of 3 independently determined values. Variances associated with each of these means are given in Supplementary Table S6.
Use of PYR as a Reference Chemical
Substrate depletion assays employing PYR as a reference chemical were performed in parallel with those conducted for the other 5 test chemicals. As indicated previously, these 5 chemicals were evaluated using different lots of biological material. The results for PYR therefore provided an opportunity to evaluate lot-to-lot differences in metabolic activity, as well as differences between the in vitro assays themselves (Supplementary Figs. 5–9 and Supplementary Table 7). CLIN VITRO, INT values for the 5 cell lots varied by a factor of 1.61 (highest/lowest, based on averages calculated across all laboratories), and by a factor of 1.66 for the 5 lots of RT-S9. These lot-to-lot differences in activity were significant for RT-HEP (one-way ANOVA; p = .046), but not for RT-S9 (p = .062). The mean of lab-specific intralaboratory CVs determined for each lot of RT-HEP (19.2% ± 4.0%) was greater than that calculated using data from RT-S9 (14.1% ± 2.6%), but this difference was not significant (p = .061). Averaged across all 5 cells lots, the mean interlaboratory CV for PYR (27.9% ± 11.0%) was essentially identical to that (27.0% ± 14.0%) determined for the 5 lots of RT-S9.
Assessment of Possible Study Bias
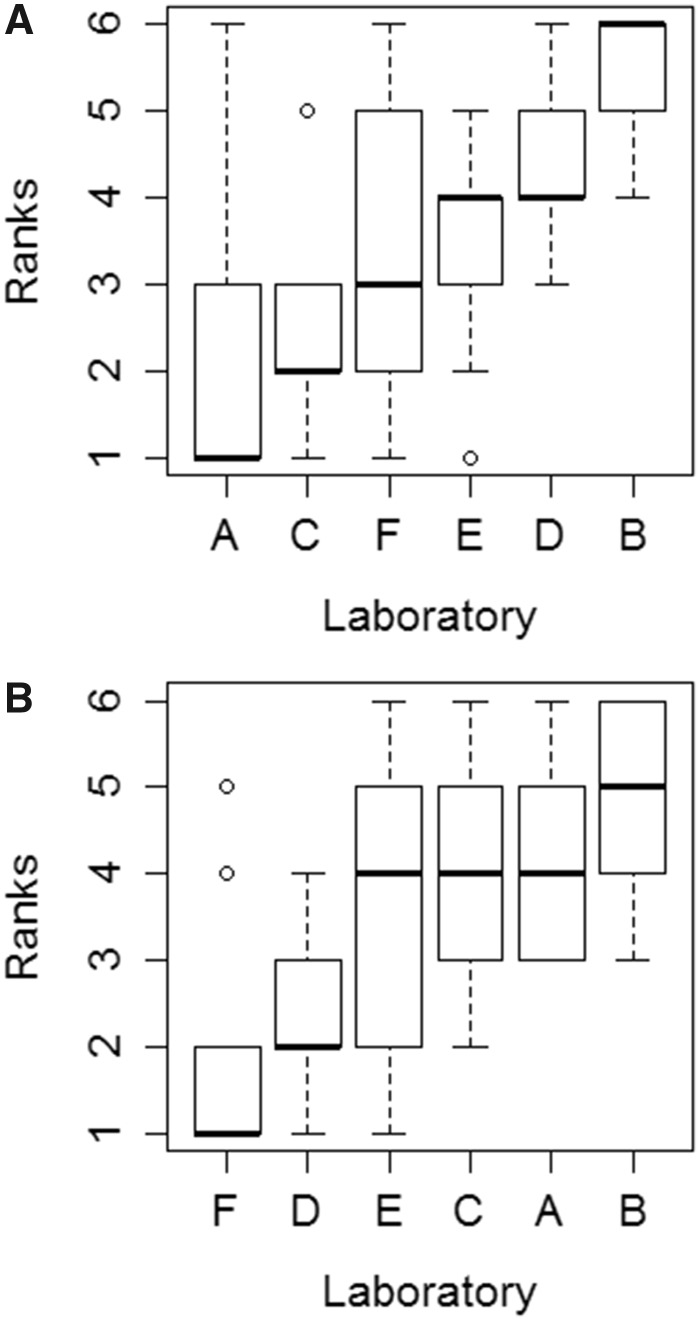
A rank-order assessment was performed on measured CLIN VITRO, INT values to test for possible laboratory bias in study findings. The objective of this analysis was to determine whether there were any trends with respect to absolute rates of measured activity, as would be evidenced (for example) by one laboratory reporting the highest (or lowest) values for most or all test chemicals. This assessment was performed by combining rank order data for all 6 test chemicals. For the hepatocytes, there was a significant difference in ranks associated with individual laboratories (Friedman’s test; p = .002). A plot of these ranks suggested a trend across all 6 laboratories (Figure 4A). However, a post hoc analysis did not confirm this (Conover’s test with Bonferroni–Holm adjusted p-values). Instead, these pairwise comparisons showed only that laboratory B was different from laboratories A, C, and F, and that laboratory D was different from laboratory A (Supplementary Table 8). A similar analysis of ranks for the RT-S9 data also indicated a significant difference among laboratories (p = .006; Figure 4B). In this case, pairwise comparisons showed that laboratory F was different from laboratories A, B, and C, whereas laboratory D was different from laboratories A and B (Supplementary Table 8).
Figure 4.
Evaluation of potential laboratory bias in measured in vitro intrinsic clearance rates (CLIN VITRO, INT). Individual laboratories are identified as A–F. The median rank associated with each laboratory is shown as a horizontal thick line, and the top and bottom of each box represents the 75th and 25th percentiles, respectively. The top and bottom whiskers extend up to 1.5 times the interquartile range, whereas dots represent individual observations beyond this range. Calculated ranks are based on measured rates of activity for CS, FEN, 4NP, DM, and MC (one value for each laboratory). Additional ranks were calculated using data for pyrene (PYR; 4 independent determinations per laboratory), run as a reference chemical (n = 9 total ranks). A, Ranks determined for each laboratory based on data collected using cryopreserved rainbow trout hepatocytes (RT-HEP). B, Ranks determined for each laboratory based data collected using rainbow trout liver S9 fractions (RT-S9).
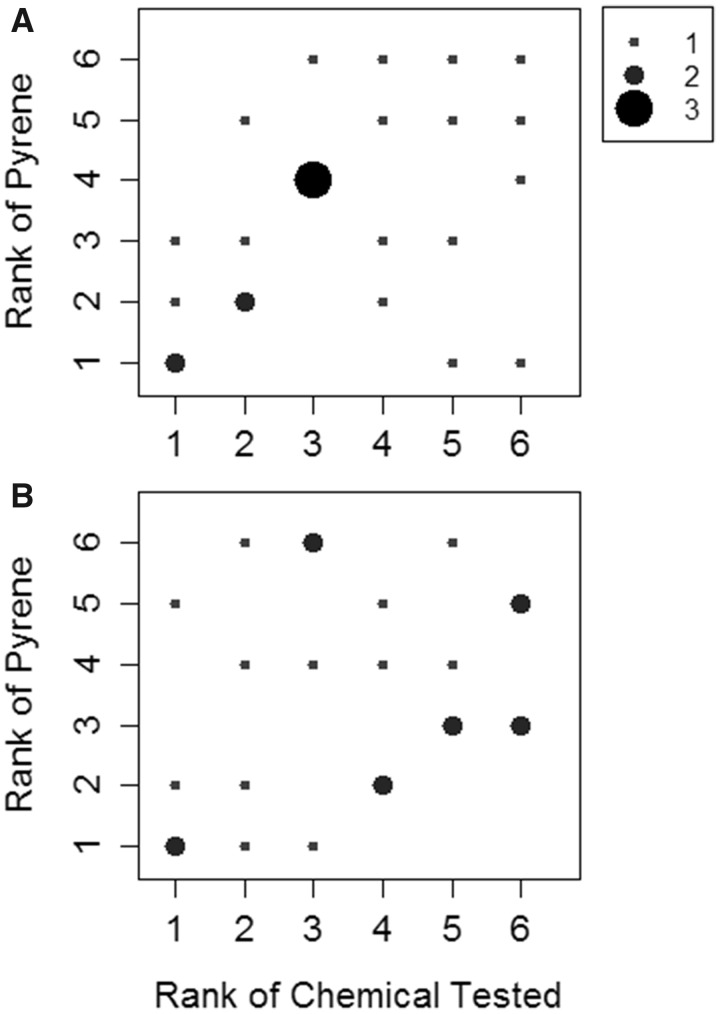
A second analysis was performed to compare laboratory ranks for each test chemical with the laboratory ranks for PYR, in the restricted case where PYR was run alongside the same chemical. At issue was the question of whether paired depletion experiments performed using a reference chemical (PYR) would prove useful in identifying laboratory bias. Rank-rank plots provide a graphical representation of these findings (Figure 5). Each observation represents a rank-rank pairing for one laboratory. If, for example, one laboratory obtained the highest clearance rate for both CS and PYR run in parallel with CS, this pairing would be represented as one observation (6/6) in the upper right hand corner of the plot. Perfect correspondence between the rank pairs would result in 6 points (n = 4 occurrences each) running diagonally from the lower left corner to the upper right corner.
Figure 5.
Rank-rank plots showing the relationship between intrinsic clearance values for individual test chemicals and for PYR, where PYR was run alongside the same test chemical. Each observation represents a pair of ranks for one laboratory. The frequency of any given observation (1–3 out of a possible 4) is denoted by the size of the dot. A, Ranks based on data collected using cryopreserved rainbow trout hepatocytes (RT-HEP). B, Ranks based on data collected using rainbow trout liver S9 fractions (RT-S9).
The rank-rank plot developed using data from RT-HEP provides graphical evidence for a weak correlation between measured clearance rates for individual test chemicals and for PYR (Figure 5A). This was confirmed by the Kendall rank correlation test result which, though significant (p = .025), was only marginally so. In contrast, the rank-rank plot obtained using data from RT-S9 provided no evidence for a correlation (Figure 5B). The correlation test result (p = .183) was consistent with this finding.
Clearance Rate Comparisons Among In Vitro Test Systems
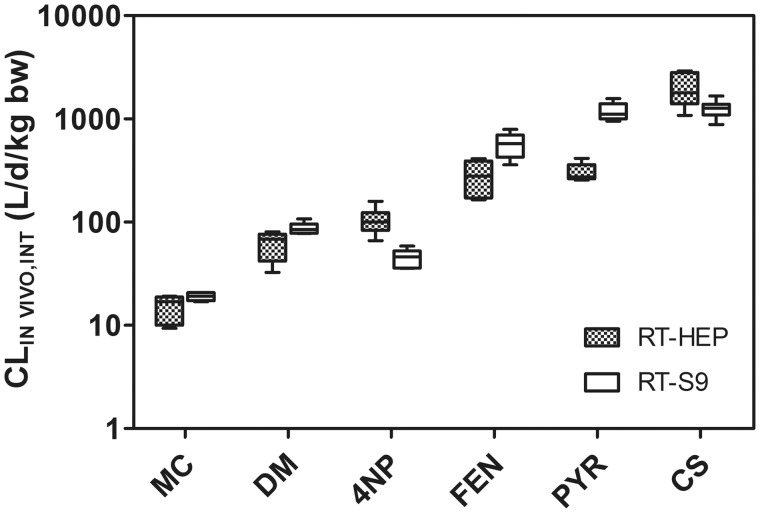
Measured rates of CLIN VITRO, INT determined using RT-HEP and RT-S9 were extrapolated to common units of CLIN VIVO, INT (l/d/kg fish) to permit direct comparisons between the two in vitro test systems (Figure 6). For PYR, these comparisons were based on CLIN VITRO, INT values determined for all lots of biological material (RT-HEP or RT-S9). For the other test chemicals, mean CLIN VIVO, INT values represent activity measured using a single lot of RT-HEP or RT-S9. With the exception of PYR, the resulting CLIN VIVO, INT values for each chemical differed by no more than a factor of 3. The average CLIN VIVO, INT value for PYR determined using RT-S9 was 3.9 times greater than that determined using RT-HEP.
Figure 6.
Estimated in vivo intrinsic clearance rates (CLIN VIVO, INT) for MC, DM, 4NP, FEN, PYR, and CS. CLIN VIVO, INT values were calculated from measured rates of in vitro intrinsic clearance obtained using cryopreserved rainbow trout hepatocytes (RT-HEP) or trout liver S9 fractions (RT-S9). Means calculated for all laboratories are shown as horizontal lines. Values shown for MC, DM, 4NP, FEN, and CS represent data generated using chemical-specific lots of biological material, whereas those given for PYR represent studies performed using all 5 lots of tested material. Boxes denote the 25th and 75th percentiles, whereas top and bottom whiskers extend up to 1.5 times the interquartile range.
A subsequent analysis of test data for CS, FEN, 4NP, and DM (two-way ANOVA using Bonferroni-Holm adjusted p-values for intrachemical comparisons) indicated that there were no trends in the data which would suggest that one in vitro test system or the other consistently yields a higher or lower rate of activity (p = .77). For 4NP, however, CLIN VIVO, INT values determined using RT-HEP were significantly higher than those obtained using RT-S9 (p = .021), whereas in the case of FEN the opposite was true (p = .026). For PYR, CLIN VIVO, INT rates obtained using RT-S9 were significantly higher than those determined using RT-HEP (t-test; p < .001).
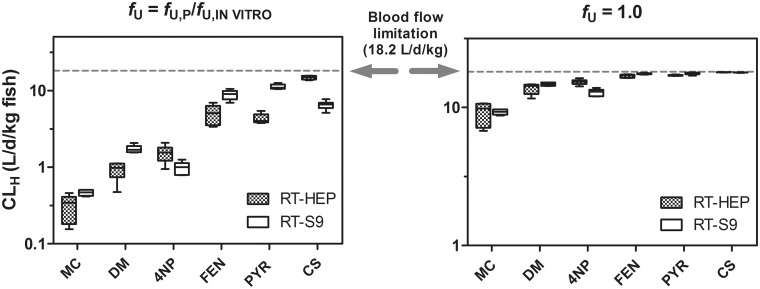
Under the restricted clearance assumption, CLH values predicted for each chemical using data from the two in vitro test systems differed by less than a factor of 2.6 (Figure 7). This improved agreement, relative to that for calculated CLIN VIVO, INT values, can be attributed to the fact that for several chemicals the product term fu CLIN VIVO, INT was approaching the estimated rate of liver blood flow (ie, the theoretical maximum value), which is shown in the figure as a dashed line. The observed agreement between CLH values predicted using both test systems was even greater when using the unrestricted clearance assumption.
Figure 7.
Estimated hepatic clearance values (CLH) for MC, DM, 4NP, FEN, PYR, and CS. CLH values were calculated using a well-stirred liver model under two different binding assumptions (fU = fU, P/fU, HEP or S9 or fU = 1.0; see text for details). In vitro intrinsic clearance rates used as inputs to these calculations were generated using cryopreserved rainbow trout hepatocytes (RT-HEP) or rainbow trout liver S9 fractions (RT-S9). Means calculated for all laboratories are shown as horizontal lines. Values shown for MC, DM, 4NP, FEN, and CS represent data generated using chemical-specific lots of biological material (RT-HEP or RT-S9), whereas those given for PYR represent studies performed using all 5 lots of tested material. Boxes denote the 25th and 75th percentiles, whereas top and bottom whiskers extend up to 1.5 times the interquartile range.
Prediction of Chemical BCFs
For each of the test chemicals, BCFs predicted using in vitro data were much closer to previously measured values than were BCFs predicted under the assumption of no biotransformation (Table 2). Generally, however, the best correspondence between measured and modeled BCFs was achieved when using the unrestricted clearance assumption (fU = 1.0), particularly for chemicals with higher log KOW values. Moreover, BCFs predicted under this assumption using either test system (RT-HEP or RT-S9) were nearly identical. This outcome follows from the close agreement between predicted CLH values noted above.
DISCUSSION
In vitro assays have been used for decades to measure biotransformation in a variety of organisms. However, apart from two previous studies with RT-S9 and RT-HEP (Fay et al., 2014b; Johanning et al., 2012b), we are unaware of any efforts to evaluate the reliability of these methods across multiple laboratories. Differences between the present study and earlier work include the number of participating laboratories (6 vs. 3 or 4), use of both RT-HEP and RT-S9 (not one or the other), and incorporation of PYR as an internal reference compound. Whereas previous studies were limited to a simple characterization of assay reliability, as represented by the CV in replicated measurements, the current study design permitted direct comparisons of the two in vitro test systems, including the reliability of each method and differences in predicted rates of in vivo intrinsic clearance. The use of an internal reference compound provided a means for characterizing lot-to-lot differences in activity of biological material. The larger number of laboratories and incorporation of a reference chemical also provided data needed to perform a rigorous assessment of possible laboratory bias.
Measurable rates of substrate depletion were observed for all 6 test chemicals in both test systems. The CLIN VITRO, INT values determined across individual test chemicals differed by ∼2 orders of magnitude. For MC, the most slowly metabolized of the test chemicals, depletion rate constants averaged 0.16/h for RT-HEP and 0.32/h for RT-S9. The working lifetime of these in vitro preparations remains to be firmly established; however, depletion rates in this range are close to the lower limit that can be accurately quantified by these approaches. Previously, Chen et al. (2016) suggested that this limit value was approximately 0.14/h for RT-S9, based on modeled simulations of hypothetical depletion data. The actual limit value will vary depending on the quality of a dataset and the behavior of enzymatically inactive controls.
For several of the chemicals evaluated in this effort, the use of boiled RT-S9 as a negative control resulted in an apparent loss of compound from the reaction system. However, when the same chemicals were introduced to a test system inactivated using the benchtop method there was no discernable loss of compound. Deposition of heat-denatured protein onto the wall of the reaction vessel with repeated vortexing may have reduced the amount of chemical remaining in solution. Additional work is required to evaluate this possibility. Presently, it appears that the benchtop method of inactivating RT-S9 provides a simple and effective means of creating control material. Boiling RT-HEP also results in a solution containing denatured protein, but the character of this solution differs from that of boiled RT-S9, perhaps due to a lower protein content (∼0.3 to 0.4 mg/mL for a solution containing 2 × 10⁶ cells/ml; Fay et al., 2017). As noted previously, there was no discernable loss of chemicals from vials containing boiled RT-HEP.
In all but one case, CLIN VITRO, INT values measured in this study for individual test chemicals were within a factor of 10 of previously reported values (Supplementary Table 9). In general, however, rates determined in the present study are higher than those given earlier. For CS, these differences may be due to differences in activity of starting biological material. Laue et al. (2014) reported a CLIN VITRO, INT of 3.49 ml/h/mg protein for CS, whereas the CLIN VITRO, INT determined in the present study was 22.64 ml/h/mg protein. The starting substrate concentration (1 μM) used in both studies was the same, but rainbow trout used to provide liver S9 fractions were obtained from different sources. In the case of FEN, differences in starting substrate concentration may have played a role. Thus, Fay et al. (2014b) reported a clearance rate 0.25 ml/h/106 cells for FEN at a starting substrate concentration of 2 μM. In the present effort, the CLIN VITRO, INT determined for FEN was 1.51 ml/h/106 cells, although the starting substrate concentration was 0.2 μM. The CLIN VITRO, INT determined in this study for PYR (3.48 ml/h/106 cells) is nearly 100 times faster than that (0.036 ml/h/106 cells) reported by Mingoia et al. (2010; mean of all values for RT-HEP). The starting substrate concentration employed by Mingoia et al. (2010) was 10 μM. This concentration is substantially higher than the Michaelis–Menten affinity constant (KM) for PYR determined using RT-S9 (0.070 μM; Nichols et al., 2017). It is likely, therefore, that experiments conducted by Mingoia et al. (2010) were performed under saturated conditions.
The reliability of each in vitro assay was assessed by quantifying intra- and interlaboratory variability in repeated clearance rate determinations. Chemical-specific intralaboratory CVs calculated for all 6 test compounds averaged 18.9% for RT-HEP and 14.1% for RT-S9. A similar level of intralaboratory variability was observed previously in a more limited ring trial conducted using RT-HEP (mean CV, all chemicals = 17%; Fay et al., 2014b). In most cases, intralaboratory CVs calculated for a given chemical and test system were substantially smaller than the corresponding interlaboratory CV. This finding was expected and reflects a high level of consistency in the performance of both assays by individual users.
Interlaboratory CVs calculated across all chemicals and tests averaged 30.1% for RT-HEP and 22.4% for RT-S9. This apparent difference in assay performance was probably due to increased variability inherent to the use of cryopreserved cells. For the RT-HEP assay, the user must reconstitute frozen samples through a series of steps, count live cells, and dilute the sample accordingly (Fay et al., 2015). The diluted sample is then counted a second time to determine the number of cells that will be used to normalize in vitro rate determinations. An evaluation of cell yield and viability data suggested that variability in cell yield determinations (within and among laboratories) was substantially greater than the variability in measured cell viability (Supplementary Table 4). This outcome is most likely due to differences in sample handing, although difference in cell counting technique could also contribute.
Methodological issues associated with the RT-HEP assay may also explain the observed laboratory bias in measured CLIN VITRO, INT values (Figure 4A). Although different users may handle and count cells differently, individual users are likely to perform these steps in a consistent manner. In contrast, the RT-S9 assay is performed using a nearly identical amount of starting material, obtained by diluting a previously characterized sample. The observed laboratory bias in RT-S9 study results (Figure 4B) is therefore harder to explain, although differences in technique (eg, pipetting, mixing of samples) could play a role.
The measured depletion rates for PYR provided only weak evidence of a laboratory bias in study findings. However, the utility of PYR as a reference chemical was demonstrated in several instances where measured activity for PYR and another test compound tested in parallel was found to be absent or greatly reduced (for example, due to an omission of cofactors). Over time, the repeated use of a reference chemical will result in historical data that can be used to evaluate the “goodness” of each assay result. Reference chemicals may also be useful when comparing different fish species and strains, and could, in principal, be used to “benchmark” different study results that are due to inherent differences in metabolizing capacity. Finally, incorporation of a reference chemical may provide an important means of demonstrating user proficiency, particularly for laboratories that generate data as part of a regulatory submission.
When expressed in common units (CLIN VIVO, INT; L/d/kg fish), intrinsic clearance rates determined using both assays were similar (<3-fold difference for all chemicals except PYR). This level of agreement was considered to be very good, given the lot-to-lot differences in activity of RT-HEP and RT-S9, indicated by study results for PYR (>1.6-fold; highest/lowest). Closer agreement between the two systems (<2.6-fold difference for all chemicals) was obtained when CLIN VIVO, INT values were extrapolated to estimates of hepatic clearance (CLH), primarily because measured rates of activity were driving the well-stirred liver model toward a flow-limited condition. There were no obvious trends in the data which would suggest that one test system consistently yields a higher or lower rate of CLIN VIVO, INT (and by extension CLH). This finding contradicts earlier work (Han et al., 2009), which suggested that CLH values predicted using RT-HEP are consistently higher than those predicted using RT-S9. Instead, the present work is consistent with a study by Fay et al. (2017), which reported excellent agreement in CLH values for 6 PAHs predicted using both in vitro test systems.
BCFs calculated using measured rates of in vitro activity illustrate the utility of these methods for refining modeled bioaccumulation predictions (Table 2). To date, comparisons between measured and modeled BCFs have been compromised by a lack of correspondence between fish species used to obtain in vitro and in vivo data. Thus, all measured BCFs reported in Table 2 were obtained from species other than trout. Nevertheless, the incorporation of in vitro data into an established one-compartment model (Arnot and Gobas, 2003) resulted in BCFs that are remarkably close to reported values, particularly under the assumption of unrestricted clearance. Similar findings have been reported by other research groups (Cowan-Ellsberry et al., 2008; Dyer et al., 2008; Gomez et al., 2010; Han et al., 2007, 2009; Laue et al., 2014).
The use of RT-S9 and RT-HEP for this application reflects the existence of physiological and anatomical information required to scale in vitro rates of clearance to the intact animal (Nichols et al., 2006, 2013b). Additional work has been performed to develop methods for cryopreservation of trout hepatocytes (Fay et al., 2014a; Mingoia et al., 2010), facilitating their use across laboratories. Ultimately, however, a need exists to develop similar methods for other fish species in order to characterize species difference with respect to metabolism impacts on chemical bioaccumulation.
The results of this ring trial show that assays performed using RT-HEP and RT-S9 are highly reliable, and suggest that either system may be used with confidence to inform chemical bioaccumulation assessments for fish. Presently, it cannot be said that one system is preferred for this application. Additional work with a wider range of chemical substrates is needed to determine whether the domain for applicability of these two assays differs. Importantly, this effort highlights several issues related to the demonstration of assay reliability, including aspects of study design (number of laboratories, test chemicals, replicates, etc.), assessment of starting biological material, and the analysis of experimental findings (eg, assessment of bias). As such, this study provides a template that could be employed to evaluate other in vitro assays, including those used to measure intrinsic clearance in humans.
Standardized OECD test guidelines for in vitro determination of intrinsic hepatic clearance using RT-HEP and RT-S9 are currently under review (OECD, 2017). Acceptance of these methods by risk assessors will depend on additional studies demonstrating the accuracy of modeled bioaccumulation predictions, performed using experimental designs that provide in vitro and in vivo information for the same test species. Several investigations of this type are ongoing.
DISCLAIMER
This work describes an international ring trial of two in vitro assay systems. A report that describes the results of this ring trial was submitted previously to the Organization for Economic Co-operation and Development (OECD) and made publicly available on the OECD website (OECD Project 3.13 Study Report; OECD, 2017). Portions of this work are excerpted from this earlier report; however, the present contribution includes substantial new material pertaining to data analysis and interpretation. This paper has been reviewed internally by Givaudan Schweiz AG, the Health and Environmental Sciences Institute, and the National Health and Environmental Effects Research Laboratory, U.S. Environmental Protection Agency, and approved for publication. The views, conclusions and recommendations expressed in this article are those of the authors and do not necessarily represent views or policies of the European Commission, the OECD and its member countries, or the U.S. Environmental Protection Agency, nor does mention of any trade names or commercial products constitute endorsement or recommendation for use.
FUNDING
This work was supported by HESI, a nonprofit institution whose mission is to collaboratively identify and help to resolve global health and environment challenges through the engagement of scientists from academia, government, industry, NGOs and other strategic partners. HESI receives funding and in-kind support from member companies and other non-industry organizations to support projects, and this effort was managed under the auspices of the Bioaccumulation Technical Committee. A full list of the participating organizations is available at http://hesiglobal.org/development-of-methods-for-a-tiered-approach-to-assess-bioaccumulation-of-chemicals/. In-kind support was provided by the affiliations of the authors.
ACKNOWLEDGEMENTS
The authors gratefully acknowledge the government, academic and industry scientists of the HESI Bioaccumulation Technical Committee for their contributions to and support of this work.
SUPPLEMENTARY DATA
Supplementary data are available at Toxicological Sciences online.
Supplementary Material
REFERENCES
- Arnot J. A., Gobas F. A. P. C. (2003). A generic QSAR for assessing the bioaccumulation potential of organic chemicals in aquatic food webs. QSAR Comb. Sci. 22, 337–345. [Google Scholar]
- Arnot J. A., Gobas F. A. P. C. (2004). A food web bioaccumulation model for organic chemicals in aquatic ecosystems. Environ. Toxicol. Chem. 23, 2343–2355. [DOI] [PubMed] [Google Scholar]
- Bischof I., Koster J., Segner H., Schlechtriem C. (2016). Hepatocytes as in vitro test system to investigate metabolite patterns of pesticides in farmed rainbow trout and common carp: Comparison between in vivo and in vitro and across species. Comp. Biochem. Physiol. 187, 62–73. [DOI] [PubMed] [Google Scholar]
- Brinkman M., Schlechtriem C., Reininghaus M., Eichbaum K., Buchinger S., Reifferscheid G., Hollert H., Preuss T. G. (2016). Cross-species extrapolation of uptake and disposition of neutral organic chemicals in fish using a multispecies physiologically-based toxicokinetic model framework. Environ. Sci. Technol. 50, 1914–1923. [DOI] [PubMed] [Google Scholar]
- Chen Y., Hermens J. L. M., Jonker M. T. O., Arnot J. A., Armitage J. M., Brown T., Nichols J. W., Fay K. A., Droge S. T. J. (2016). Which molecular features affect the intrinsic hepatic clearance rate of ionizable chemicals in fish? Environ. Sci. Technol. 50, 12722–12731. [DOI] [PubMed] [Google Scholar]
- Clarke D. J., George S. G., Burchell B. (1991). Glucuronidation in fish. Aquat. Toxicol. 20, 35–56. [Google Scholar]
- Cowan-Ellsberry C. E., Dyer S. D., Erhardt S., Bernhard M. J., Roe A. L., Dowty M. E., Weisbrod A. V. (2008). Approach for extrapolating in vitro metabolism data to refine bioconcentration factor estimates. Chemosphere 70, 1804–1817. [DOI] [PubMed] [Google Scholar]
- de Wolf W., de Bruijn J. H. M., Seinen W., Hermens J. (1992). Influence of biotransformation on the relationship between bioconcentration factors and octanol-water partition coefficients. Environ. Sci. Technol. 26, 1197–1201. [Google Scholar]
- Dyer S. D., Bernhard M. J., Cowan-Ellsberry C., Perdu-Durand E., Demmerle S., Cravedi J.-P. (2008). In vitro biotransformation of surfactants in fish. Part I: Linear alkylbenzene sulfonate (C12-LAS) and alcohol ethoxylate (C13EO8). Chemosphere 72, 850–862. [DOI] [PubMed] [Google Scholar]
- Fay K. A., Fitzsimmons P. N., Hoffman A. D., Nichols J. W. (2014). Optimizing the use of rainbow trout hepatocytes for bioaccumulation assessments with fish. Xenobiotica 44, 345–351. [DOI] [PubMed] [Google Scholar]
- Fay K., Mingoia R. T., Goeritz I., Nabb D. L., Hoffman A. D., Ferrell B. D., Peterson H. M., Nichols J. W., Segner H., Han X. (2014). Intra- and interlaboratory comparison of clearance rates of xenobiotics by cryopreserved trout hepatocytes for the prediction of bioaccumulation potential. Environ. Sci. Technol. 48, 8170–8178. [DOI] [PubMed] [Google Scholar]
- Fay K., Nabb D., Mingoia R. T., Goeritz I., Hoffman A. D., Ferrell B. D., Peterson H. M., Nichols J. W., Segner H., Han X. (2015). Determination of metabolic stability using cryopreserved hepatocytes from rainbow trout (Oncorhynchus mykiss). Curr. Prot. Toxicol. 65, 4.42.1–4.42.29. [DOI] [PubMed] [Google Scholar]
- Fay K. A., Fitzsimmons P. N., Hoffman A. D., Nichols J. W. (2017). Comparison of trout hepatocytes and liver S9 fractions as in vitro models for predicting hepatic clearance in fish. Environ. Toxicol. Chem. 36, 463–471. [DOI] [PMC free article] [PubMed] [Google Scholar]
- Giesy J. P., Pierens S. L., Snyder E. M., Miles-Richardson S., Kramer V. J., Snyder S. A., Nichols K. M., Villeneuve D. A. (2000). Effects of 4-nonylphenol on fecundity and biomarkers of estrogenicity in fathead minnows (Pimephales promelas). Environ. Toxicol. Chem. 19, 1368–1377. [Google Scholar]
- Gobas F. A. P. C., de Wolf W., Burkhard L. P., Verbruggen E., Plotzke K. (2009). Revisiting bioaccumulation criteria for POPs and PBT assessments. Integ. Environ. Assess. Manage. 5, 624–637. [DOI] [PubMed] [Google Scholar]
- Gomez C. F., Constantine L., Huggett D. B. (2010). The influence of gill and liver metabolism on the predicted bioconcentration of three pharmaceuticals in fish. Chemosphere 81, 1189–1195. [DOI] [PubMed] [Google Scholar]
- Gomez J. M., Mourot B., Fostier A., Le Gac F. (1999). Growth hormone receptors in ovary and liver during gametogenesis in female trout (Oncorhynchus mykiss). J. Reprod. Fertility 115, 275–285. [DOI] [PubMed] [Google Scholar]
- Graybill F. A. (1976). Theory and Application of the Linear Model. Duxberry Press, North Scituate. [Google Scholar]
- Han X., Nabb D. L., Mingoia R. T., Yang C.-H. (2007). Determination of xenobiotic intrinsic clearance in freshly isolated hepatocytes from rainbow trout (Oncorhynchus mykiss) and rat and its application in bioaccumulation assessment. Environ. Sci. Technol. 41, 3269–3276. [DOI] [PubMed] [Google Scholar]
- Han X., Mingoia R. T., Nabb D. L., Yang C.-H., Snajdr S., Hoke R. A. (2008). Xenobioitic intrinsic clearance in freshly isolated hepatocytes from rainbow trout (Oncorhynchus mykiss): Determination of trout hepatocellularity, optimization of cell concentrations and comparison of serum and serum-free incubations. Aquat. Toxicol. 89, 11–17. [DOI] [PubMed] [Google Scholar]
- Han X., Nabb D. L., Yang C.-H., Snajdr S. I., Mingoia R. T. (2009). Liver microsomes and S9 from rainbow trout (Oncorhynchus mykiss): Comparison of basal-level enzyme activities with rat and determination of xenobiotic intrinsic clearance in support of bioaccumulation assessment. Environ. Toxicol. Chem. 28, 481–488. [DOI] [PubMed] [Google Scholar]
- Hansen D. J., Parrish P. R. (1977). Suitability of sheepshead minnows (Cyprinodon variegatus) for life-cycle toxicity tests In Aquatic Toxicology and Hazard Evaluation: Proceedings of the First Annual Symposium on Aquatic Toxicology (Mayer F.L., Hamelink J.L., Eds.), pp. 117–126, American Society for Testing and Materials, STP 634, Philadelphia. [Google Scholar]
- James M. O. (1986). Xenobiotic conjugation in fish and other aquatic species In Xenobiotic Conjugation Chemistry (Paulson G.D., Caldwell J., Hutson D.H., Menn JJ, Eds.), pp. 29–47, ACS Symposium Series Vol.299, American Chemical Society, Washington. [Google Scholar]
- Johanning K., Hancock G., Escher B., Adekola A., Bernhard M., Cowan-Ellsberry C., Domoradski J., Dyer S., Eickhoff C., Embry M., et al. (2012a). Assessment of metabolic stability using the rainbow trout (Oncorhynchus mykiss) liver S9 fraction. Curr. Prot. Toxicol. 53, 14.10.1–14.10.28. [DOI] [PubMed] [Google Scholar]
- Johanning K., Hancock G., Escher B., Adekola A., Bernhard M., Cowan-Ellsberry C., Domoradzki J., Dyer S., Eickhoff C., Erhardt S., et al. (2012b). In Vitro Metabolism Using Rainbow Trout Liver S9. Summary report of the HESI Bioaccumulation Committee. Available at: http://hesiglobal.org/publication/in-vitro-metabolism-using-rainbow-trout-liver-s9-summary-report-of-the-hesi-bioaccumulation-committee/
- Jonsson G., Bechmann R. K., Bamber S. D., Baussant T. (2004). Bioconcentration, biotransformation, and elimination of polycyclic aromatic hydrocarbons in sheepshead minnows (Cyprinodon variegatus) exposed to contaminated seawater. Environ. Toxicol. Chem. 23, 1538–1548. [DOI] [PubMed] [Google Scholar]
- Laue H., Gfeller H., Jenner K. J., Nichols J. W., Kern S., Natsch A. (2014). Predicting the bioconcentration of fragrance ingredients by rainbow trout using measured rates of in vitro intrinsic clearance. Environ. Sci. Technol. 48, 9486–9495. [DOI] [PubMed] [Google Scholar]
- Le Gac F., Thomas J. L., Mourot B., Loir M. (2001). In vivo and in vitro effects of prochloraz and nonylphenol ethoxylates on trout spermatogenesis. Aquat. Toxicol. 53, 187–200. [DOI] [PubMed] [Google Scholar]
- McCulloch C. E., Searle S. R., Neuhaus J. M. (2008). Generalized, Linear, and Mixed Models, 2nd ed.John Wiley & Sons, Hoboken. [Google Scholar]
- Mingoia R. T., Glover K. P., Nabb D. L., Yang C.-H., Snajdr S. L., Han X. (2010). Cryopreserved hepatocytes from rainbow trout (Oncorhynchus mykiss): A validation study to support their application in bioaccumulation assessment. Environ. Sci. Technol. 44, 3052–3058. [DOI] [PubMed] [Google Scholar]
- Muir D. C. G., Hobden B. R., Servos M. R. (1994). Bioconcentration of pyrethroid insecticides and DDT by rainbow trout: Uptake, depuration, and effect of dissolved organic carbon. Aquat. Toxicol. 29, 223–240. [Google Scholar]
- Nichols J. W., Schultz I. R., Fitzsimmons P. N. (2006). In vitro-in vivo extrapolation of hepatic metabolism data for fish: I. A review of methods and strategy for incorporating intrinsic clearance estimates into chemical kinetic models. Aquat. Toxicol. 78, 74–90. [DOI] [PubMed] [Google Scholar]
- Nichols J. W., Bonnell M., Dimitrov S. D., Escher B. I., Han X., Kramer N. I. (2009). Bioaccumulation assessment using predictive approaches. Integ. Environ. Monit. Assess 5, 577–597. [DOI] [PubMed] [Google Scholar]
- Nichols J. W., Hoffman A. D., Fitzsimmons P. N., ter Laak T. L. (2013a). Hepatic clearance of six polyaromatic hydrocarbons by isolated perfused trout livers: Prediction from in vitro intrinsic clearance and evaluation of protein binding effects. Toxicol. Sci. 136, 359–372. [DOI] [PubMed] [Google Scholar]
- Nichols J. W., Huggett D. B., Arnot J. A., Fitzsimmons P. N., Cowan-Ellsberry C. E. (2013b). Towards improved models for predicting the bioconcentration of well-metabolized compounds by rainbow trout using measured rates of in vitro intrinsic clearance. Environ. Toxicol. Chem. 32, 1611–1622. [DOI] [PubMed] [Google Scholar]
- Nichols J. W., Ladd M.A., Fitzsimmons P. N. (2017). Measurement of kinetic parameters for biotransformation of polycyclic aromatic hydrocarbons by trout liver S9 fractions: implications for bioaccumulation assessment. Applied In Vitro Toxicology. doi/abs/10.1089/aivt.2017.0005. [DOI] [PMC free article] [PubMed] [Google Scholar]
- OECD (2012). Test No. 305: Bioaccumulation in Fish: Aqueous and Dietary Exposure, OECD Guidelines for the Testing of Chemicals, Section 3. OECD Publishing. DOI: 10.1787/9789264185296-en.
- OECD (2017). Study Report. Multi-Laboratory Ring-Trial to Support Development of OECD Test Guidelines on Determination of In Vitro Intrinsic Clearance Using Cryopreserved Rainbow Trout Hepatocytes and Liver S9 Sub-Cellular Fractions. https://www.oecd.org/env/ehs/testing/4-OECD%20Draft%20ring%20trial%20study%20report%20for%20WNT.pdf
- Oliver B. G., Niimi A. J. (1985). Bioconcentration factors of some halogenated organics for rainbow trout: Limitations in their use for prediction of environmental residues. Environ. Sci. Technol. 19, 842–849. [DOI] [PubMed] [Google Scholar]
- Rodrigues A. D. (1997). Preclinical drug metabolism in the age of high-throughput screening: An industrial perspective. Pharm. Res. 14, 1504–1510. [DOI] [PubMed] [Google Scholar]
- Rowland M., Benet L. Z., Graham G. G. (1973). Clearance concepts in pharmacokinetics. J. Pharmacokinet. Biopharm 1, 123–136. [DOI] [PubMed] [Google Scholar]
- Schultz I. R., Hayton W. L. (1999). Interspecies scaling of the bioaccumulation of lipophilic xenobiotics in fish: An example using trifluralin. Environ. Toxicol. Chem. 18, 1440–1449. [Google Scholar]
- Schlenk D., Celander M., Gallagher E. P., George S., James M., Kullman S. W., van den Hurk P., Willett K. (2008). Biotransformation in fishes In The Toxicology of Fishes (Di Giulio R.T., Hinton D.E., Eds.), pp. 153–234, CRC Press, Boca Raton. [Google Scholar]
- Snyder S. A., Keith T. L., Pierens S. L., Snyder E. M., Giesy J. P. (2001). Bioconcentration of nonylphenol in fathead minnows (Pimephales promelas). Chemosphere 44, 1697–1702. [DOI] [PubMed] [Google Scholar]
- Stadnicka J., Schirmer K., Ashauer R. (2012). Predicting concentrations of organic chemicals in fish using toxicokinetic models. Environ. Sci. Technol. 46, 3273–3280. [DOI] [PMC free article] [PubMed] [Google Scholar]
- Southworth G. R., Keffer C. C., Beauchamp J. J. (1980). Potential and realized bioconcentration. A comparison of observed and predicted bioconcentration of azaarenes in the fathead minnow (Pimephales promelas). Environ. Sci. Technol. 14, 1529–1531. [DOI] [PubMed] [Google Scholar]
- Tsuda T., Aoki S., Kojima M., Fujita T. (1993). Accumulation and excretion of organophosphorous pesticides by carp Cyprinus carpio. Comp. Biochem. Physiol. Part C 104, 275–278. [Google Scholar]
- Tsuda T., Aoki S., Inoue T., Kojima M. (1995). Accumulation and excretion of diazinon, fenthion and fenitrothion by killifish: Comparison of individual and mixed pesticides. Water Res. 29, 455–458. [Google Scholar]
- Tsuda T., Kojima M., Harada H., Nakajima A., Aoki S. (1996). Accumulation and excretion of fenthion, fenthion sulfoxide and fenthion sulfone by killifish (Oryzias latipes). Comp. Biochem. Physiol. Part C 113, 45–49. [Google Scholar]
- Tsuda T., Kojima M., Harada H., Nakajima A., Aoki S. (1997). Relationships of bioconcentration factors of organophosphate pesticides among species of fish. Comp. Biochem. Physiol. Part C 116, 213–218. [Google Scholar]
- U.S. EPA (2012). EPI Suite – Estimation Program Interface Suite for Windows, v4.11. Available at: https://www.epa.gov/tsca-screening-tools/epi-suitetm-estimation-program-interface. Accessed November 20, 2017.
- Wetmore B. A., Wambaugh J. F., Ferguson S. S., Sochaski M. A., Rotroff D. M., Freeman K., Clewell H. J. III, Dix D. J., Andersen M. E., Houck K. A., et al. (2012). Integration of dosimetry, exposure, and high-throughput sceening data in chemical toxicity assessment. Toxicol. Sci. 125, 157–174. [DOI] [PubMed] [Google Scholar]
- Wilkinson G. R., Shand D. G. (1975). A physiological approach to hepatic drug clearance. Clin. Pharmacol. Ther. 18, 377–390. [DOI] [PubMed] [Google Scholar]
Associated Data
This section collects any data citations, data availability statements, or supplementary materials included in this article.


