

 Quartz nanoparticles (QNPs) cause various diseases in the biological systems and are thus considered as hazardous materials; however, their properties are important in a wide range of biological and pharmaceutical entities.
Abstract
Quartz nanoparticles (QNPs) cause various diseases in the biological systems and are thus considered as hazardous materials; however, their properties are important in a wide range of biological and pharmaceutical entities. The present study was initiated to enhance the understanding of the genotoxic potential and focused on the mechanism involved in the indigenous quartz nanoparticles induced toxicity in A549 cells. The results show a concentration dependent decrease in the cell viability of A549 cells. Additionally, QNPs exposure results in the concentration dependent toxicity, which intensifies the generation of ROS, which in turn is confirmed by the increased lipid peroxidation and decreased GSH levels. Moreover, it also induces DNA damage in the cells exposed to QNPs as compared to the control cells. The outcome of the results confirms that QNPs have cytotoxic and genotoxic effects on the A549 cells in a concentration and time dependent manner. Western blot analysis indicates the up regulation of LC-3I/II, Beclin-1, and p62 protein levels, which confirms the occurrence of autophagy through the phosphatidylinositol 3-kinase (PI3K)/a threonine kinase (Akt)/mammalian target of rapamycin (mTOR) pathway, as well as the inhibitor of autophagy is also verified. Our study demonstrates that QNPs exposure in human lung cells causes oxidative stress and DNA damage, which leads to autophagy. Hence, from a bioremediation point of view, the remedial strategy that can be adopted from the biological DNA damage from these health hazardous materials will result in a safer environment.
1. Introduction
Worldwide, natural minerals have various industrial applications; however, they pose a threat to large populations who may be exposed at the industrial as well as at the consumer levels.1–4 During mining, processing, and industrial usage, workers are exposed to these minerals. Silicosis is an occupational health concern, which is associated with the inhalation of quartz (crystalline silica) in the occupational settings, e.g. mining, sandblasting, surface drilling, stone cutting, construction, pottery making, and silica flour mill operations, and is most common among the workers in the underdeveloped countries. Apart from the occupational exposure, environmental exposure to quartz dust is also very common due to its presence in the soil, which becomes airborne under arid, windy conditions or during agricultural, urban, and construction activities. Presently, a number of safety standards exist to limit the airborne levels of quartz. The Occupational Safety and Health Administration (OSHA) has set the permissible exposure limit (PEL) of 100 μg m–3 for 8 h work exposure for quartz and another organization, the National Institute for Occupational Safety and Health (NIOSH), has set the PEL as 50 μg m–3 for up to 10 h per day for a 40 h work week. However, in the actual settings of occupations, such as rock drilling and sandblasting, the respirable quartz dust levels are far more than these standards and thus an overexposure is possible, which usually happens in small, unregulated industrial settings or in high-hazard occupations such as sandblasting, drilling, tunneling, silica flour mill operations, and stone grinding.
Information about the safety and probable hazards of this mineral are urgently desired. With this aim, the field of nanotoxicology has significantly emerged to deal with the potential risk of ultrafine particles.5–7 This study places nanominerals in the setting of customary particle toxicology and thus incorporates reference to different type of particles, such as asbestos and silica.8–10
Quartz dust induces cellular inflammation in vivo,11–15 inhalation of quartz particles causes the development of silicosis with progressive pulmonary dysfunction,16–20 and aerosolized quartz particles impede alveolar macrophage clearance capacities prompting dynamic injuries and pneumonitis. Oxidative stress has likewise been reported in rats after intratracheal instillation of quartz.21,22 Numerous trial studies have discovered that the surface properties of crystalline silica impact its fibrogenic activity and features identified with its cytotoxicity.23–25 Although numerous potential contributory components have been reported in the literature, the precise mechanism of quartz lethality is complex and has not been totally understood yet.
However, to date, there are no studies covering the detailed toxicological exploitation and clearance kinetics of the quartz nanomaterials. To the best of our knowledge, the possible mechanism responsible for the DNA damage and cell death pathway triggered by QNPs has not been fully investigated. Herein, we investigate the DNA damaging potential and influence mode of cell death using A549 cells as the investigation model for cancer cells. Further, this study characterizes the nanoparticles for their toxicological potential, which enables to determine the danger assessment as well as a safer environment in terms of a remedial strategy that can be adopted from the biological DNA damage.26–28
2. Materials and methods
2.1. Chemicals
Quartz powder, which is meant for industrial use, was a kind gift from the Wolkem India limited, Udaipur, India. Fetal bovine serum (FBS), penicillin–streptomycin, DMEM/F-12 medium, and HBSS were purchased from Invitrogen Co. MTT [3-(4,5-dimethylthiazol-2-yl)-2,5-diphenyltetrazoliumbromide], reduced nicotinamide adenine dinucleotide (NADH), reduced glutathione (GSH), 5,5′-dithiobis(2-nitrobenzoic acid) (DTNB), thiobarbituric acid (TBA), and low melting point (LMP) and normal melting point (NMP) agarose were obtained from Fermentas (Glen Burnie, MD). Other chemicals mainly ethylene diaminetetraacetic acid disodium salt (Na2EDTA), tris (hydroxymethyl) aminomethane (Trizma base), t-octylphenoxy poly-ethoxyethanol (Triton X-100), dimethyl sulfoxide (DMSO), sodium lauroyl sarcosinate (Sarkosyl, SLS), and ethidium bromide were purchased from Merck (Darmstadt, Germany). All other chemicals used were of the highest purity and were available from the commercial sources.
2.2. Characterization of the quartz nanoparticles
2.2.1. Preparation of the quartz nanoparticles
Nanoparticles were prepared by grinding 25 g powder in a ball mill (PM 100, Retsch, Germany) for 300 h at alternative cycles of grinding (5 min) and halt (1 min) at 350 rpm using mixtures of different sizes of balls.
2.2.2. Polarized microscope analysis of the particles
For polarized microscopy, quartz particle mounted slides were observed under a phase contrast polarized optical microscope using the M/S Leica analysis software, Microsystems Ltd, Switzerland.
2.2.3. TEM analysis of the particles
For the measurement of particle size and shape, 100 μg mL–1 of QNPs was suspended in distilled water, sonicated at 30 W for 10 min (Sonics Vibra Cell, India), and 50 μg of the suspension was dropped over a carbon coated grid. The grids were properly dried and examined under a transmission electron microscope (FEI Tecnai G2 Spirit Twin, Czech Republic) at 80 000 kV.
2.2.4. SEM analysis of the particles
For SEM analysis, a small amount of QNPs powder was placed on a carbon tape, sputter coated with gold, and visualized at an accelerating voltage of 30 kV using an FEI Quanta FEG 450 field emission scanning electron microscope with an EDAX (FEI, the Netherlands) instrument.
2.2.5. DLS analysis of the particles
For DLS, the QNPs sample suspended in the cell culture media was ultrasonicated at 30 W for 10 min (Sonics Vibra Cell, India). Size distribution, hydrodynamic size, and zeta potential were analysed using DLS and a Zetasizer Nano-ZS equipped with a 4.0 mW, 633 nm laser (Model ZEN 3600, Malvern Instruments Ltd, Malvern, UK).
2.3. Cell culture and exposure to quartz nanoparticles
Human lung epithelial cells (A549) were cultured in a DMEM/F-12 medium supplemented with 10% FBS and 100 μg mL–1 penicillin–streptomycin at 5% CO2 and 37 °C. At 85% confluence, cell harvesting was performed using 0.25% trypsin and sub-cultured according to the need of the experiment e.g. 75 cm2 and 6 well plate. Cells were left for 24 h to attach and attain a normal morphology prior to the treatment. For exposure, QNPs were suspended in the cell culture medium and diluted to appropriate concentrations (10, 25, 50, and 100 μg mL–1). To avoid the agglomeration of nanoparticles, QNPs suspensions were sonicated for 10 min at 40 W at room temperature in a sonicator bath. After the completion of the exposure time, cells were harvested to determine the cytotoxicity, oxidative stress, and genotoxicity parameters. Cells that were not exposed to QNPs served as controls in each experiment. The selection of the 10, 25, 50, and 100 μg mL–1 dosage range of QNPs was based on a preliminary dose–response study (data not shown).
2.4. Cytotoxicity assays
The cytotoxic response of QNPs in the A549 cells was determined using the MTT and NRU assays.
2.4.1. MTT assay
Cell viability was assessed using the MTT assay.29,30 This assay is based on the ability of the viable cells, but not dead cells, to reduce 3-(4,5-dimethylthiazol-2-yl)-2,5-diphenyltetrazolium bromide (MTT) into insoluble blue formazan crystals. After the exposure duration, the medium was aspirated off and 100 μL MTT laden medium (0.5 mg MTT per mL) was added and incubated for 2 h. The reaction was stopped and the formazan crystals thus formed were solubilised by mixing an equal volume of 100 μL dimethylsulfoxide and incubating for 2 h. The absorbance was determined at 570 nm using a microplate reader (Omega Fluostar) and the mean of the triplicate measurements was calculated. This value corresponds to 0% decrease in the MTT conversion activity and represents 100% cell viability.
2.4.2. Neutral red uptake assay
The cytotoxicity assay, neutral red uptake (NRU), was also performed.31 In brief, 1 × 10⁴ cells per well were seeded in 96-well plates and exposed to QNPs at the concentrations of 10, 25, 50, and 100 μg mL–1 for 24 h. At the end of exposure, the test solution was aspirated and cells were washed with PBS twice and incubated for 3 h in the medium supplemented with neutral red (50 μg mL–1). The medium was washed off using a solution containing 0.5% formaldehyde and 1% calcium chloride. After this, the cells were incubated at 37 °C for 20 min in a mixture containing acetic acid (1%) and ethanol (50%) to extract the dye. The absorbance was determined at 540 nm using a microplate reader (Omega Fluostar).
2.5. Assays for the oxidative stress and oxidative stress markers
2.5.1. ROS generation by DCHF-DA method
Intracellular ROS generation was determined using 2,7-dichlorofluorescein diacetate (DCFDA; Molecular Probes, Sigma).32 Briefly, A549 cells (10 000 cells per well) were seeded in a 96 well black bottom plate and exposed to the varying concentrations of QNPs and NPs mixtures (10 to 100 μg mL–1) with a negative control for 3, 6, and 24 h. After the completion of the exposure time, the medium was discarded and the culture medium containing 20 μM working solution of DCFDA was added under low-light conditions. Then, the cells were incubated for 30 min at 37 °C. After this, the medium containing DCFDA was discarded and 200 μL of PBS was added to each well and the fluorescence intensity was detected using a Multiwell Microplate Reader (Biotek, USA). The excitation and emission wavelengths were 485 nm and 528 nm, respectively.
2.5.2. Lipid peroxidation (LPO) assay
The extent of membrane LPO was estimated by measuring the formation of malondialdehyde (MDA) using a reported method.33 MDA is one of the end products of the membrane lipid peroxidation. Briefly, a mixture of 0.1 mL cell extract and 1.9 mL 0.1 M sodium phosphate buffer (pH 7.4) was incubated at 37 °C for 1 h. After the mixture was precipitated with 5% TCA, the supernatant was collected by centrifugation at 2500 rpm for 10 min at room temperature. Then, 1.0 mL of 1% TBA was added to the supernatant and placed in boiling water for 15 min. After cooling down to room temperature, the absorbance of the mixture was measured at 532 nm, converted to MDA, and expressed in nmol mg–1 protein. A reaction mixture devoid of cell extract served as the control.
2.5.3. Determination of the intracellular GSH Level
The content of GSH was quantified using a fluorometric assay.34 After the exposure duration, cells were lysed in a 20 mM Tris (hydroxymethyl) aminomethane (pH 7.0) by repeated cycles of freeze–thawing and centrifuged at 10 000 rpm for 5 min at 4 °C. The supernatant was transferred to another tube, and from this, the protein content was measured. For the determination of intracellular GSH, the protein in this supernatant was precipitated by PCA (final concentration of 1% PCA) and again centrifuged at 10 000 rpm for 5 min at 4 °C. Then, 20 μL sample was mixed with 160 μL phosphate-EDTA buffer (0.1 M–5 mM, pH 8.3) and 20 μL o-phthalaldehyde (OPT, 1 mg mL–1 in methanol) in a black 96-well plate. After 2 h incubation at room temperature in the dark, fluorescence was measured at the emission wavelength of 460 nm and excitation wavelength of 350 nm. Results are expressed as nmol of glutathione per milligram of protein.
2.6. Single cell gel electrophoresis (SCGE, Comet) assay
To check the DNA damaging potential, the alkaline SCGE (Comet) assay was performed.35–37 Briefly, A549 cells were incubated with different concentrations of QNPs. After the completion of the exposure time, the medium was removed and the cells were washed thrice using cold PBS. Then, the cells were harvested by centrifugation at 2500 rpm for 10 min at 4 °C, and the cell pellet was suspended in 100 μL. For the assay, 100 μL agarose (NMP) was layered on the slides by covering with a coverslip and placed on ice to set the agarose. After this, 10 μL of cell suspension was quickly mixed with 100 μL low melting agarose and placed over the agarose (NMP) and allowed to fix on ice. This slide was then again layered using LMP agarose and fixed. The slides were then dipped into a pre-chilled lysing solution (pH 10) [2.5 M NaCl, 100 mM Na2EDTA, 10 mM Trizma, 1% sarkosyl, 10% DMSO, and 1% Triton X-100] and kept overnight at 0 °C. For electrophoresis, the slides were placed on a horizontal gel electrophoresis unit and covered with a pre-chilled alkaline solution [300 mM NaOH and 1 mM Na2EDTA (pH 13)] at 0 °C for 40 min, and then electrophoresis was performed for 30 min at 25 V, 300 mA, and 0 °C. After the completion of electrophoresis, the slides were rinsed thrice with 400 mM Trizma solution (pH 7.5) to neutralize the alkali, and then stained with 50 μL of ethidium bromide (20 μg mL–1) and covered with a coverslip. For analysis, 150 nuclei were examined and photographed using a fluorescence microscope (Nikon, Kyoto, Japan) at the excitation of 520–550 nm and barrier filter of 580 nm. DNA damage was then analyzed using a computerized image analysis software (CASP software).
2.7. Detection of the mitochondrial membrane potential (MMP) and mode of cell death
MMP was determined using JC 1 dye (molecular probe). After 24 h exposure, cells were trypsinized, centrifuged at 1000 rpm, and suspended in 500 μL of 5 mmol L–1 JC-1 in cell culture medium and incubated for 30 min at 37 °C. After incubation, the cells were centrifuged at 1000 rpm and suspended in a 400 μL PBS. Red-green fluorescence was acquired with a BD FACScanto II flow cytometer (Becton Dickinson, San Jose, CA). The data analysis was performed using the BD FACS Diva software (Becton Dickinson, USA).
The mode of cell death was determined using the Annexin V-Propidium Iodide (PI) apoptosis detection kit (BD Biosciences, San Diego, USA). Briefly, after exposure, the cells were trypsinized and centrifuged at 1000 rpm. The pellet was then washed with PBS and suspended in a 100 μL binding buffer, and then 2 μL Annexin V-FITC was added and incubated for 10 min. A 2 μL PI was then added and incubated for 10 min. After incubation, 400 μL binding buffer was added to all the samples. Samples were acquired using a BD FACScanto II flow cytometer (Becton Dickinson, San Jose, CA). The data analysis was performed using the BD FACS Diva software (Becton Dickinson, USA).
2.8. MDC staining for autophagy
The formation of autophagosomes was examined in the A549 cells for the induction of autophagy by QNPs. For staining, autophagic vacuoles were incubated with 50 μM MDC in the dark at 37 °C for 30 min. Then, the samples were checked for autophagosome accumulation by fluorescent microscopy (Leica microsystems, USA).
2.9. Total cell lysate
After the completion of the exposure time, cells were trypsinized and washed with ice-cold PBS. Cells were then treated with an ice-cold cell lysis buffer (Sigma-Aldrich) for overnight at –20 °C. The cell lysate was then collected by centrifugation at 12 000 rpm for 30 min at 4 °C, and the supernatant was immediately used or can be stored at –80 °C per liquid nitrogen.
2.10. Western blotting
Western blotting was performed by following the Towbin method with some modifications.38 Protein (50–100 μg) was separated on 8–12% SDS-PAGE and immediately blotted on the PVDF membrane, which was then incubated with different antibodies i.e. Chk1, ATM, H2A.X, p53, LC3, p62, beclin-1, PI3K, AKT, and mTOR β-actin (Abcam, Cambridge, UK). After the primary antibodies, a secondary horseradish peroxidase conjugated secondary antibody was used in the chemiluminescence kit. The blots were then visualized using a Versa Doc Imaging System (Biorad, CA, USA). For equal loading of proteins, the membrane was first probed with a β-actin antibody. Densitometric analysis of the protein bands was performed via the digitalized scientific software program, UN-SCAN-IT, purchased from Silk Scientific Corporation (Orem, UT, USA).
2.11. Statistical analysis
All results are presented as the mean and standard deviation from at least three independent experiments. Statistical analysis was carried out using the Student's t-test. Significance is ascribed at p < 0.05. All values are ± the standard error of mean (SEM) from the three independent experiments. *(p < 0.05) and **(p < 0.01) represent statistically significant disparity from the control.
3. Results and discussion
3.1. Characterization of the QNPs
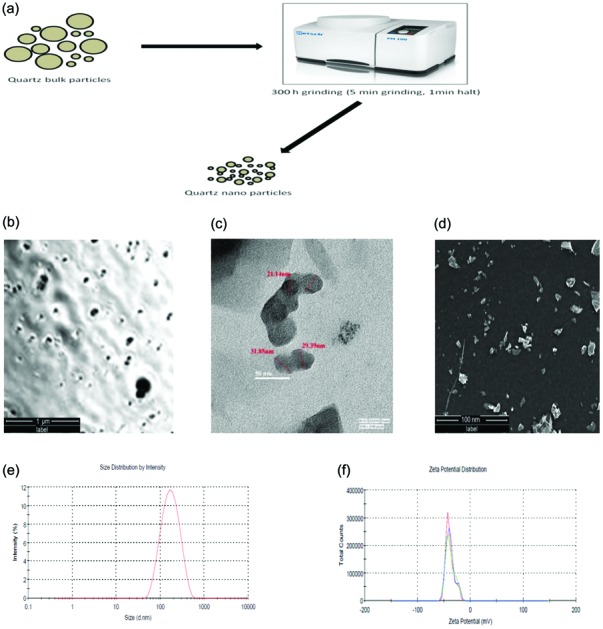
The quartz nanoparticles were prepared by balling quartz dust particles of irregular size and checked under polarized microscopy [Fig. 1a and b]. The size of the QNPs, as shown in the TEM images, varies from 30–40 nm and all the particles have irregular shapes [Fig. 1c]. Surface morphology analysis by SEM confirms the irregular angular shape and rough surface of the QNPs [Fig. 1d]. The QNPs were also characterized using dynamic light scattering techniques in DMEM F-12 culture medium. The average size and zeta potential of the QNPs were determined to be 135.4 ± 0.23 nm and –39.3 ± 0.25 mV, respectively [Fig. 1e and f].
Fig. 1. Schematic for the preparation of quartz nanoparticles (a), polarized microscopy (b), transmission electron microscopy (TEM) (c) and scanning electron microscopy (SEM) (d) analysis showing the quartz nanoparticles. Hydrodynamic size (e) and zeta potential (f) of the quartz nanoparticles by DLS.

3.2. Cytotoxicity of QNPs
The cytotoxicity of the QNPs was assessed using the MTT assay, which shows evidence of a concentration-dependent effect with 97%, 84.5%, 59.6%, 40.8% and 92%, 62.3%, 47.6%, 29.6% decrease in the cell viability in the concentration range of 10, 25, 50, and 100 μg mL–1 for 24 h and 48 h, respectively (with an IC50 value of around 50 μg mL–1 for the A549 cell line for 24 h and around 25 μg mL–1 for 48 h exposure) [Fig. 2a]. The results of the NRU assay confirm the results of the MTT assay, showing a time and concentration dependent decrease in the cell viability of A549 cells after the QNPs exposure at the respective concentrations [Fig. 2b].
Fig. 2. QNPs induced cytotoxicity in both time and concentration dependent manner, as indicated by a decrease in the cell viability by (a) MTT and (b) NRU assays.

3.3. Measurement of ROS by the DCHF-DA method
The amount of ROS generated post QNPs exposure was measured using the DCHF-DA method. Our result shows that after 6 h exposure to QNPs, 109.2%, 141.2%, 175.4%, and 183.9% ROS production occurs, which continues to increase until 24 h showing 124.8%, 166.9%, 230.6%, and 254.8% at concentrations of 10, 25, 50, 100 μg mL–1, respectively. At 36 h, the ROS generation drastically decreased to a non-significant level showing 148.9%, 137.3%, 125.8%, and 109.3% at the concentrations of 10, 25, 50, and 100 μg mL–1, respectively. Comparison between different time points shows a concentration dependent increase in the ROS generation in A549 cells [Fig. 3].
Fig. 3. QNPs induced ROS generation in both time and concentration dependent manner, as indicated by the increase in the fluorescence intensity.

3.4. Effect of QNPs on the oxidative stress markers in A549 cells
QNPs induce maximum lipid peroxidation in A549 cells after 24 h exposure, showing an increase from 2.29 nmol mg–1 protein (Control) to 2.56, 2.68, 3.1, and 3.6 nmol mg–1 protein at 10, 25, 50, and 100 μg mL–1, respectively [Fig. 4a]. An increased level of ROS also affects the GSH level and the results here show a significant decrease in the GSH level after the QNPs exposure i.e., 15.16 nmol mg–1 protein (Control) to 14.7, 14.1, 13.6, and 12.9 nmol mg–1 protein at the concentrations of 10, 25, 50, and 100 μg mL–1, respectively [Fig. 4b].
Fig. 4. (a) Level of lipid peroxidation shown by MDA formation. (b) Level of GSH shown by the GSH assay.

3.5. Effect of QNPs on DNA damage in A549 cells
The QNPs induced DNA damage in the A549 cells was analyzed using the standard alkaline Comet assay. Cells exposed to 10, 25, 50, and 100 μg mL–1 concentration of QNPs for 12 h exhibited a significant induction of DNA damage compared to the control cells, as evident by the Comet parameters, such as Olive tail moment and % tail DNA, in the standard alkaline Comet assay. The results here show a significant increase in the tail DNA percentage in the QNPs exposed cells, thus confirming DNA fragmentation compared to the control cells [Fig. 5a and b].
Fig. 5. QNPs induced DNA damage in human lung epithelial cells by the Comet assay (a) % tail DNA and (b) OTM.

3.6. QNPs effect on the MMP and apoptosis
The QNPs exposed cells show a significant concentration dependent decrease in the mitochondrial membrane potential, as evident by the JC-1 dye. There was a significant decrease in MMP, i.e., 0.9%, 1.3%, 6.0%, 10.5%, and 17.6%, compared to that of the control [Fig. 6a]. The number of apoptotic cells also increased in a concentration dependent manner. There was an increase in the number of apoptotic cells from 1.8% (control) to 4.1%, 8.2%, 13.5%, 20.1%, and 26.4% at given concentrations [Fig. 6b].
Fig. 6. Mitochondrial membrane potential alteration (a) and apoptosis induction (b) due to the QNPs on the A549 cells after 24 h.

3.7. Western blot analysis
The western blot analysis data exhibits that there was a significant (p < 0.05) increase in the pro-apoptotic protein Bax by 1.14, 1.24, and 1.51 fold in the case of QNPs at 25, 50, and 100 μg mL–1 concentration, respectively. The tumor suppressor protein p53 upregulates by 1.19, 1.40, and 1.55 fold in the case of QNPs at 25, 50 and 100 μg mL–1 concentration, respectively. The level of Bcl-2 down-regulates to 0.66, 0.57, and 0.34 fold in the case of QNPs, compared to the control at 25, 50, and 100 μg mL–1 concentration, respectively [Fig. 7a]. There was also an up-regulation in the levels of DNA damage sensing proteins, up-regulation of H2A.X to 1.3, 1.2, and 1.6 fold, up-regulation of Chk-1 to 1.3, 1.6, and 1.9 fold, up-regulation of ATM to 1.4, 1.8, and 2.1 fold in the case of QNPs, compared to those of the control at 25, 50, and 100 μg mL–1 concentration, respectively [Fig. 7b]. Further adding to the results, there was also an increase in the up-regulation of HMGB1 expression by 2.1, 3.2, and 3.5 fold in the case of QNPs at the concentrations of 25, 50, and 100 μg mL–1, respectively, compared with those of the control, and the LC-3 protein to 1.48, 1.65, and 1.83. The Beclin-1 protein concentration increases by 1.5, 2.0, and 2.6 fold with the down-regulation of p62 by 1, 0.8, and 0.5 fold compared to those of the control at the concentrations of 25, 50, and 100 μg mL–1, respectively [Fig. 7c]. The involvement of the PI3K-Akt-mTOR pathway was also checked at the protein levels and the results show significant down-regulation in the proteins levels: PI3K was down-regulated by 0.9, 0.7, and 0.4 fold, Akt by 0.8, 0.6, and 0.5 fold, and mTOR by 0.9, 0.6, and 0.3 fold in the case of QNPs, compared to those of the control at 25, 50, and 100 μg mL–1 concentration [Fig. 7d].
Fig. 7. Western blot analysis showing the induction of marker proteins of (a) apoptosis, (b) DNA damage, (c) Autophagy, and (d) PI3K-Akt-mTOR pathway due to the QNPs on the A549 cells after 24 h.

3.8. Discussion
There is very little information about the toxicity of QNPs and the biological and cellular responses of the QNPs are poorly understood. Our findings confirm that the direct exposure of QNPs to lung cells aggravates the oxidative stress resulting in inflammation, which leads to DNA damage and initiation of cell death pathways. The increase in cell death is related to the physiochemical properties of the nanoparticles that result in cell injury.39 Similar to our study, a number of other nanoparticles, such as iron oxide, copper oxide, and titanium oxide, has been reported to induce the size-dependent cytotoxicity. Cellular uptake of nanoparticles is a crucial issue in determining the effect of nanoparticles on the cellular integrity.40 The flow cytometry particle uptake results confirm the internalization of QNP in A549 cells after 24 h exposure. To gain a closer insight into the mechanism of QNPs induced toxicity, cellular morphology and cell viability were determined. A change in the cellular morphology is a direct indicator of cytotoxicity, as confirmed by the results of cytotoxicity, MTT, and NRU assays.41 The cell viability assay reports the cytotoxic nature of QNPs and their involvement in membrane damage.42 Apoptosis and necrosis were further investigated to check the mode of cell death induced by QNPs. Flow cytometric data confirms a significant increase in the apoptotic cells in a concentration dependent manner.43 Thus, it is revealed that A549 cells undergo apoptosis after an exposure to QNPs.
The induction of ROS results in oxidative damage trailed by lipid peroxidation and a decrease in the antioxidant activities. Oxidative stress is considered as the main feature of nanotoxicity.44 ROS generated by QNPs surpasses the ability of antioxidant defense mechanisms, thus causing harmful effects on the cellular macromolecules such as DNA and other organelles e.g. mitochondria and ER.45 We detected a decline in the mitochondrial membrane potential in a concentration dependent manner leading to collapse of the mitochondria due to the oxidative stress generated by the QNPs.
Excess ROS resulting in the oxidative DNA damage is confirmed by our results. Oxidative stress induced lipid peroxidation also plays an important role in cell death and DNA damage.46 ROS directly leads to DNA damage and cell cycle arrest G2/M phase.47 Upon DNA damage, Chk1 becomes activated and inhibits the downstream target, resulting in the down-regulation of cyclin B1/cdc2 kinase, which is essential for the cells to move into the mitosis phase. Chk1 is an essential kinase that is required to preserve genome stability and is activated at the time of DNA damage and also involved in the cell cycle regulation.48 Further, when cells have DNA damage/unreplicated DNA, cell cycle checkpoints will arrest the cells at one stage. The G2/M checkpoint plays an important role to prevent the cells with DNA damage from entering into the mitosis phase, and when the DNA damage is beyond repair, apoptosis occurs.
In addition to apoptosis, we also observed another type of cell death, i.e. autophagy, which was confirmed by the MDC staining. It was reported that nanomaterials induced mitochondrial damage has a close link to autophagy.49 QNPs trigger autophagy and autophagic vacuole accumulation in the A549 cells. To further confirm the autophagy activation, LC-3I/LC-3II conversions were employed to detect the autophagic vacuoles. LC-3 is an autophagic protein marker that gets converted into LC-3 II upon autophagic induction and the ratio of LC-3II/LC-3 I is a standard marker for autophagy.50 In our study, after QNPs exposure, there was a significant increase in the ratio of LC-3I/II in a concentration dependent manner and there was also an up-regulation of HMGB1 and beclin-1, which are critical regulators of autophagy. There was also down-regulation of p62, as observed from the MDC results, thus confirming autophagy.51
After QNPs exposure, both apoptosis and autophagy were observed, which are catabolic pathways essential for homeostasis and also tumor suppressing pathways. The coexistence of apoptosis and autophagy in the QNPs exposure can be possibly related to the interaction of Bcl2/Beclin-1.52 Bcl2 interacts with beclin-1 to inhibit the autophagy and it binds at the BH3 domain of Bcl2. Increased Beclin-1 expression releases Bax/Bak from Bcl2 to promote apoptosis and also a decrease in the Bcl2 levels can result in beclin-1 dependent autophagy.53 Another possibility for autophagy could be the overexpression of cytokines. ROS induces the expression of pro-inflammatory cytokines and translocates HMGB1 to promote the cytophagic flux by regulating Hsp 27 and can also directly interact with Beclin-1. These could be the possible mechanisms for the coexistence of apoptosis and autophagy.
Several studies including our findings have reported that autophagy is involved in the nanoparticles-induced toxicity via the PI3K/Akt/mTOR pathway, such as polyamidoamines (PAMAM) nanoparticles, zinc oxide nanoparticles, poly-glycyrrhetinic acid nanoparticles, silver nanoparticles, and silica nanoparticles.54
The classical pathway well known for regulating autophagy is serine/threonine kinase, which is the mammalian target of rapamycin (mTOR). Under normal conditions, mTOR exists in the phosphorylated form and suppresses autophagy. At autophagy induction by rapamycin treatment or nutrient starvation, phosphorylation of mTOR is down-regulated.55,56 Many studies have earlier reported the regulation of the mTOR by PI3K/Akt pathway. We analyzed the expression of phosphorylated Akt, which acts up stream to mTOR. As expected, upon treatment with QNPs, the levels of PI3K and Akt significantly decreased. These results confirm the QNPs induced autophagy through the PI3K-Akt-mTOR pathway in the A549 cells.
4. Conclusion
In conclusion, this study addresses the genotoxic potential of the QNPs in A549 cells. The results show that QNPs could provoke DNA damage via oxidative stress generation in a concentration and time dependent manner leading to cell death. In addition, they also induce autophagy via the PI3K/Akt/mTOR pathway. This study will be helpful to understand the molecular mechanism involved in the cell death induced by QNPs such that the bioremediation processes from health hazardous materials may be evolved in the near future.
Acknowledgments
The authors gratefully acknowledge the financial assistance to Ms. Sushma in the form of Fellowship from UGC, New Delhi, and Director, CSIR-Indian Institute of Toxicology Research, Lucknow, for granting permission to work for her Ph.D. degree under AcSIR. A part of this study carried out at MNNIT Allahabad is also acknowledged.
References
- Ahmad I. Nanotoxicology. 2008;2:S-27. [Google Scholar]
- Kachuri L., Villeneuve P. J., Parent M. É., Johnson K. C., Harris S. A. Int. J. Cancer. 2014;135:138–148. doi: 10.1002/ijc.28629. [DOI] [PubMed] [Google Scholar]
- Moitra S., Puri R., Paul D., Huang Y. C. T. Curr. Opin. Pulm. Med. 2015;21:114–120. doi: 10.1097/MCP.0000000000000136. [DOI] [PubMed] [Google Scholar]
- Balamuralikrishnan B., Balachandar V., Subramaniam M. D., Alagumuthu K. K., Sureshkumar S., Arun M., Sasikala K. Stoch. Environ. Respiratory Risk Assessment. 2014;28(Suppl. 7):1801–1814. [Google Scholar]
- Oberdörster G., Oberdörster E., Oberdörster J. Environ. Health Perspect. 2007;115:A290. doi: 10.1289/ehp.115-1892118. [DOI] [PMC free article] [PubMed] [Google Scholar]
- Akhtar U. S., Rastogi N., McWhinney R. D., Urch B., Chow C. W., Evans G. J., Scott J. A. Toxicol. Rep. 2014;1:145–156. doi: 10.1016/j.toxrep.2014.05.002. [DOI] [PMC free article] [PubMed] [Google Scholar]
- Madl A. K., Plummer L. E., Carosino C., Pinkerton K. E. Annu. Rev. Physiol. 2014;76:447–465. doi: 10.1146/annurev-physiol-030212-183735. [DOI] [PMC free article] [PubMed] [Google Scholar]
- Donaldson K., Seaton A. Part. Fibre Toxicol. 2012;9:13–25. doi: 10.1186/1743-8977-9-13. [DOI] [PMC free article] [PubMed] [Google Scholar]
- Donaldson K., Tran C. L. Mutat. Res. Genet. Toxicol. Environ. Mutagen. 2004;553:5–9. [Google Scholar]
- Algar G. O., Canchucaja L., d'Orazzio V., Manich A., Joya X., Vall O. Environ. Monit. Assess. 2015;187:1–10. doi: 10.1007/s10661-014-4196-5. [DOI] [PubMed] [Google Scholar]
- Duffin R., Tran C. L., Clouter A., Brown D. M., MacNee W., Stone V., Donaldson K. Ann. Occup. Hyg. 2002;1:242–245. [Google Scholar]
- Schins R. P., Duffin R., Höhr D., Knaapen A. M., Shi T., Weishaupt C., Borm P. J. Chem. Res. Toxicol. 2002;15:1166–1173. doi: 10.1021/tx025558u. [DOI] [PubMed] [Google Scholar]
- Fanizza C., Ursini C. L., Paba E., Ciervo A., Di F. A., Maiello R., De S. P., Cavallo D. Toxicol. in Vitro. 2007;21:586–594. doi: 10.1016/j.tiv.2006.12.002. [DOI] [PubMed] [Google Scholar]
- Li Y., Zhu T., Guo X., Shang Y. Prog. Nat. Sci. 2006;16:1138–1144. [Google Scholar]
- Stoeger T., Reinhard C., Takenaka S., Schroeppel A., Karg E., Ritter B., Schulz H. Environ. Health Perspect. 2006:328–333. doi: 10.1289/ehp.8266. [DOI] [PMC free article] [PubMed] [Google Scholar]
- Rabolli V., Re S. L., Uwambayinema F., Yakoub Y., Lison D., Huaux F. Toxicol. Lett. 2011;203:127–134. doi: 10.1016/j.toxlet.2011.03.009. [DOI] [PubMed] [Google Scholar]
- Napierska D., Thomassen L. C., Lison D., Martens J. A., Hoet P. H. Part. Fibre Toxicol. 2010;7:39–71. doi: 10.1186/1743-8977-7-39. [DOI] [PMC free article] [PubMed] [Google Scholar]
- Seaton A., Donaldson K. Part. Fibre Toxicol. 2012;9:13–25. doi: 10.1186/1743-8977-9-13. [DOI] [PMC free article] [PubMed] [Google Scholar]
- Kuempel E. D., Attfield M. D., Vallyathan V., Lapp N. L., Hale J. M., Smith R. J., Castranova V. J. Biosci. 2003;28:61–69. doi: 10.1007/BF02970133. [DOI] [PubMed] [Google Scholar]
- Rimal B., Greenberg A. K., Rom W. N. Curr. Opin. Pulm. Med. 2005;11:169–173. doi: 10.1097/01.mcp.0000152998.11335.24. [DOI] [PubMed] [Google Scholar]
- Warheit D. B., Webb T. R., Colvin V. L., Reed K. L., Sayes C. M. Toxicol. Sci. 2007;95:270–280. doi: 10.1093/toxsci/kfl128. [DOI] [PubMed] [Google Scholar]
- Albrecht C., Knaapen A. M., Becker A., Höhr D., Haberzettl P., Van Schooten F. J., Schins R. P. Respir. Res. 2005;6:129–145. doi: 10.1186/1465-9921-6-129. [DOI] [PMC free article] [PubMed] [Google Scholar]
- Albrecht C., Höhr D., Haberzettl P., Becker A., Borm P. J., Schins R. P. Inhalation Toxicol. 2007;19:39–48. doi: 10.1080/08958370701492979. [DOI] [PubMed] [Google Scholar]
- Fenoglio I., Fubini B. Elements. 2007;23:407–414. [Google Scholar]
- Thorek D. L., Tsourkas A. Biomaterials. 2008;29:3583–3590. doi: 10.1016/j.biomaterials.2008.05.015. [DOI] [PMC free article] [PubMed] [Google Scholar]
- Grieger K. D., Fjordbøge A., Hartmann N. B., Eriksson E., Bjerg P. L., Baun A. J. Contam. Hydrol. 2010;118(3):165–183. doi: 10.1016/j.jconhyd.2010.07.011. [DOI] [PubMed] [Google Scholar]
- Bhatt I., Tripathi B. N. Chemosphere. 2011;82(3):308–317. doi: 10.1016/j.chemosphere.2010.10.011. [DOI] [PubMed] [Google Scholar]
- Fadeel B., Alfonso E. G. B. Adv. Drug Delivery Rev. 2010;62(3):362–374. doi: 10.1016/j.addr.2009.11.008. [DOI] [PubMed] [Google Scholar]
- Mosmann T. J. Immunol. Methods. 1983;65:55–63. doi: 10.1016/0022-1759(83)90303-4. [DOI] [PubMed] [Google Scholar]
- Hansen M. B., Nielsen S. E., Berg K. J. Immunol. Methods. 1989;119:203–210. doi: 10.1016/0022-1759(89)90397-9. [DOI] [PubMed] [Google Scholar]
- Borenfreund E., Puerner J. A. J Tissue Cult. Methods. 1985;9:7–9. [Google Scholar]
- Wang H., Joseph J. A. Free Radical Biol. Med. 1999;27:612–616. doi: 10.1016/s0891-5849(99)00107-0. [DOI] [PubMed] [Google Scholar]
- Ohkawa H., Ohishi N., Yagi K. Anal. Biochem. 1979;95:351–358. doi: 10.1016/0003-2697(79)90738-3. [DOI] [PubMed] [Google Scholar]
- Hissin P. J., Hilf R. Anal. Biochem. 1976;74:214–226. doi: 10.1016/0003-2697(76)90326-2. [DOI] [PubMed] [Google Scholar]
- Singh N. P., McCoy M. T., Tice R. R., Schneider E. L. Exp. Cell Res. 1988;175:184–191. doi: 10.1016/0014-4827(88)90265-0. [DOI] [PubMed] [Google Scholar]
- Klaude M., Eriksson S., Nygren J., Ahnstrom G. Mutat. Res. 1996;363:89–96. doi: 10.1016/0921-8777(95)00063-1. [DOI] [PubMed] [Google Scholar]
- Tice R. R., Agurell E., Anderson D., Burlinson B., Hartmann A., Kobayashi H., Miyamae Y., Rojas E., Ryu J. C., Sasaki Y. F. Environ. Mol. Mutagen. 2000;35:206–221. doi: 10.1002/(sici)1098-2280(2000)35:3<206::aid-em8>3.0.co;2-j. [DOI] [PubMed] [Google Scholar]
- Towbin H., Staehelin T., Gordon J. Proc. Natl. Acad. Sci. U. S. A. 1979;76:4350e4. doi: 10.1073/pnas.76.9.4350. [DOI] [PMC free article] [PubMed] [Google Scholar]
- Jiang J., Oberdörster G., Biswas P. J. Nanopart. Res. 2009;11(1):77–89. [Google Scholar]
- Foged C., Brodin B., Frokjaer S., Sundblad A. Int. J. Pharm. 2005;298:315–322. doi: 10.1016/j.ijpharm.2005.03.035. [DOI] [PubMed] [Google Scholar]
- Sager T. M., Castranova V. Part. Fibre Toxicol. 2009;6:1–11. doi: 10.1186/1743-8977-6-15. [DOI] [PMC free article] [PubMed] [Google Scholar]
- Ahamed M., Akhtar M. J., Raja M., Ahmad I., Siddiqui M. K. J., AlSalhi M. S., Alrokayan S. A. Nanomedicine. 2011;7:904–913. doi: 10.1016/j.nano.2011.04.011. [DOI] [PubMed] [Google Scholar]
- Choi S. J., Oh J. M., Choy J. H. J. Inorg. Biochem. 2009;103:463–471. doi: 10.1016/j.jinorgbio.2008.12.017. [DOI] [PubMed] [Google Scholar]
- Oberdörster G., Oberdörster E., Oberdörster J. Environ. Health Perspect. 2005;113:823–839. doi: 10.1289/ehp.7339. [DOI] [PMC free article] [PubMed] [Google Scholar]
- Löffler H., Bochtler T., Fritz B., Tews B., Ho A. D., Lukas J., Krämer A. Cell Cycle. 2007;6:2541–2548. doi: 10.4161/cc.6.20.4810. [DOI] [PubMed] [Google Scholar]
- Cassel S. L., Eisenbarth S. C., Iyer S. S., Sadler J. J., Colegio O. R., Tephly L. A., Sutterwala F. S. Proc. Natl. Acad. Sci. U. S. A. 2008;105:9035–9040. doi: 10.1073/pnas.0803933105. [DOI] [PMC free article] [PubMed] [Google Scholar]
- Sharma V., Anderson D., Dhawan A. Apoptosis. 2012;17(8):852–870. doi: 10.1007/s10495-012-0705-6. [DOI] [PubMed] [Google Scholar]
- Duan J. PLoS One. 2013;8(4):e62087. doi: 10.1371/journal.pone.0062087. [DOI] [PMC free article] [PubMed] [Google Scholar]
- Malumbres M., Barbacid M. Trends Biochem. Sci. 2005;30:630–641. doi: 10.1016/j.tibs.2005.09.005. [DOI] [PubMed] [Google Scholar]
- Lam M. H., Rosen J. M. Cell Cycle. 2004;3:1355–1357. doi: 10.4161/cc.3.11.1225. [DOI] [PubMed] [Google Scholar]
- Mizushima N., Yoshimori T. Autophagy. 2007;3:542–545. doi: 10.4161/auto.4600. [DOI] [PubMed] [Google Scholar]
- Fátima Â., Zambuzzi W. F., Modolo L. V., Tarsitano C. A., Gadelha F. R., Hyslop S., Pilli R. A. Chem.-Biol. Interact. 2008;176:143–150. doi: 10.1016/j.cbi.2008.08.003. [DOI] [PubMed] [Google Scholar]
- Komatsu M., Ichimura Y. FEBS Lett. 2010;584:1374–1378. doi: 10.1016/j.febslet.2010.02.017. [DOI] [PubMed] [Google Scholar]
- Duan J., Yu Y., Yu Y., Li Y., Wang J., Geng W., Jiang L., Li Q., Zhou X., Sun Z. Int. J. Nanomedicine. 2014;9:5131–5141. doi: 10.2147/IJN.S71074. [DOI] [PMC free article] [PubMed] [Google Scholar]
- Li C., Liu H., Sun Y., Wang H., Guo F., Rao S., Deng J., Zhang Y., Miao Y., Guo C., Meng J., Chen X., Li L., Li D., Xu H., Wang H., Li B., Jiang C. J. Mol. Cell Biol. 2009;1:37–45. doi: 10.1093/jmcb/mjp002. [DOI] [PubMed] [Google Scholar]
- Wang F. Z., Xing L., Tang Z. H., Lu J. J., Cui P. F., Qiao J. B., Jiang L., Jiang H. L., Zong L. Mol. Pharm. 2016;13:1298–1307. doi: 10.1021/acs.molpharmaceut.5b00879. [DOI] [PubMed] [Google Scholar]