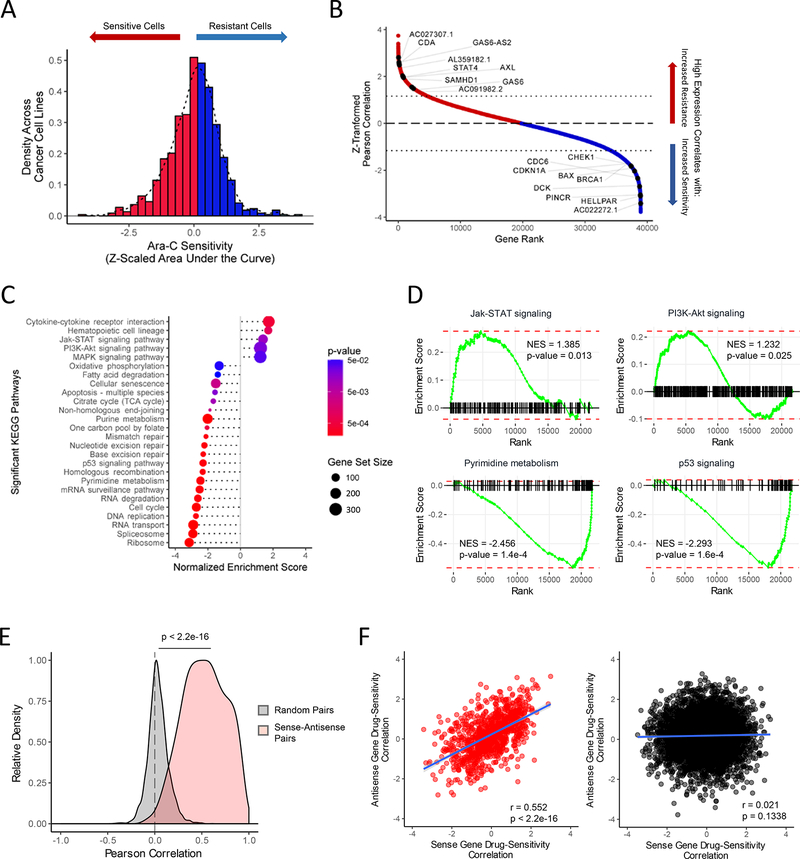
Figure 1. Identification of Protein-Coding and Noncoding Gene Biomarkers Correlated with Differential Ara-C Response.
(A) Distribution of Ara-C drug sensitivities across 760 pan-cancer cell lines profiled by both CCLE and CTD2 studies, quantified by their Z-scaled area under the dose response curve values after regressing out lineage-specific effects. See also Table S1.
(B) Distribution of Z-scaled drug resistance-gene expression Pearson correlation values of all analyzed genes. Representative protein-coding and non-coding gene symbols enriched beyond a Z-score threshold of ± 1.16 are demarcated. See also Table S1.
(C) Summary of gene set enrichment analysis (GSEA) of protein-coding genes ranked by drug resistance-gene expression correlation values using annotated KEGG (Kyoto Encyclopedia of Genes and Genomes) pathways. See also Table S3.
(D) Representative KEGG pathways from GSEA of protein-coding genes ranked by drug sensitivity-gene expression correlation values as shown in Figures 1B–1C. See also Table S3.
(E) Pearson correlation distributions of gene pair expression levels in the cancer cell line panel across 997 sense-antisense cognate gene pairs and 5,000 random protein coding- lncRNA gene pairs. Wilcoxon rank-sum test: p < 2.2e-16.
(F) Relationship of drug sensitivity-gene expression correlation values between protein coding-lncRNA gene pairs across 997 sense-antisense cognate gene pairs (left panel: Pearson’s R = 0.552, p < 2.2e-16) and 5,000 random gene pairs (right panel: Pearson’s R = 0.021, p = 0.1338).

