Abstract
Objectives.
(1) Analyze the relationship between intranasal airflow distribution and subjective nasal patency in healthy and nasal airway obstruction (NAO) cohorts using computational fluid dynamics (CFD). (2) Determine whether intranasal airflow distribution is an important objective measure of airflow sensation that should be considered in future NAO virtual surgery planning.
Study Design.
Cross sectional.
Setting.
Academic tertiary medical center and academic dental clinic.
Subjects and Methods.
Three-dimensional models of nasal anatomy were created based on computed tomography scans of 15 NAO patients and 15 healthy subjects and used to run CFD simulations of nasal airflow and mucosal cooling. Subjective nasal patency was quantified with a visual analog scale (VAS) and the Nasal Obstruction Symptom Evaluation (NOSE). Regional distribution of nasal airflow (inferior, middle, and superior) was quantified in coronal cross-sections in the narrowest nasal cavity. The Pearson correlation coefficient was used to quantify the correlation between subjective scores and regional airflows.
Results.
Healthy subjects had significantly higher middle airflow than NAO patients. Subjective nasal patency had no correlation with inferior and superior airflows, but a high correlation with middle airflow (|r|=0.64 and |r|=0.76 for VAS and NOSE, respectively). Anterior septal deviations tended to shift airflow inferiorly, reducing middle airflow and reducing mucosal cooling in some NAO patients.
Conclusion.
Reduced middle airflow correlates with the sensation of nasal obstruction, possibly due to a reduction in mucosal cooling in this region. Further research is needed to elucidate the role of intranasal airflow distribution in the sensation of nasal airflow.
Keywords: Sensation of nasal airflow, nasal airway obstruction surgery, subjective nasal patency, computational fluid dynamics (CFD) simulations, virtual surgery planning
Introduction
Nasal airway obstruction (NAO) is one of the most common indications for otolaryngology referral1 and carries an estimated economic burden upwards of $5 billion annually.2 Many studies have aimed to improve diagnosis of this condition to predict and optimize surgical outcomes. Despite these efforts, NAO remains a diagnostic challenge due to inconsistencies between subjective symptoms and clinical exam,3 and the lack of reliable symptomatic correlation with objective assessment of nasal function by methods such as rhinomanometry, peak nasal inspiratory flow (PNIF), and acoustic rhinometry.4–10
Given that current objective methods do little to identify specific, clinically-significant anatomical sites of obstruction, the diagnosis of NAO, the decision to proceed with surgery, and the selection of structures to target is often based on surgeon intuition. The development of better objective methods to guide decision-making may help improve the success rate of NAO surgery, which has been deemed unsatisfactory by many otolaryngologists.11,12 Short-term studies report surgical failure rates as high as 20–37%,13–17 while long-term studies report even higher failure over time.7,11,18 For example, in one study on long-term septoplasty outcomes, the proportion of patients stating “my symptoms are gone” was 53% six months postoperatively, but only 18% three to six years postoperatively.11 In today’s setting of increasing focus on health care cost and utilization, accurate (and early) identification of NAO patients with a high likelihood of surgical benefit is more important than ever.19,20
Recent literature utilizing three-dimensional nasal airway modeling and computational fluid dynamics (CFD) have identified key objective variables of nasal airflow and mucosal cooling that reliably correlate with subjective nasal patency21–23 and offer the potential for clinical application in virtual surgery planning. This body of literature proposes that while common tests such as rhinomanometry, PNIF, and acoustic rhinometry accurately measure nasal airflow resistance, perhaps mucosal cooling has the greatest clinical relevance to subjective patency.24,25
Zhao and Jiang26 recently reported that subjective nasal patency scores had a higher correlation with airflow near the middle turbinate than with peak heat flux in 22 healthy subjects. Therefore, the purpose of this study is to apply CFD to quantify the intranasal airflow distribution in a cohort of healthy and NAO subjects aimed at (1) investigating whether intranasal airflow distribution is abnormal in NAO patients and (2) analyzing whether subjective nasal patency correlates with intranasal airflow distribution. Most importantly, if such a correlation exists, this knowledge may have potential for application in future virtual surgery planning for NAO corrective surgery.
Methods
Patient Selection
The research was performed under approval by the institutional review board at the Medical College of Wisconsin. Informed consent was obtained from each patient. This project is part of a larger study aimed at correlation of subjective and objective measures of nasal patency and their application to NAO virtual surgery.21,22,27–30
Twenty-seven NAO patients undergoing corrective surgery (septoplasty, turbinectomy and/or septorhinoplasty) were recruited between 2009 and 2013. Preoperative axial CT scans were obtained in 0.6-mm increments with in-plane resolution of 0.31mm. Included patients were at least 16 years-old and diagnosed with anatomic NAO (deviated septum, medically-resistant turbinate hypertrophy, or nasal valve dysfunction) (Table A1). Patients with nasal obstructive symptoms primarily due to rhinitis, sinusitis, or neoplastic or autoimmune processes (i.e., not due to anatomic obstruction) were excluded.
Table A1 –
Diagnosis, predominant side of obstruction, and surgical procedure in the cohort of 15 nasal airway obstruction (NAO) patients.
| Subject (Gender) | Diagnosis | Predominant Side of Obstruction | Surgical Procedure |
|---|---|---|---|
| 1 (Male) | Deviated Nasal Septum | Bilateral | Septorhinoplasty |
| 2 (Female) | Deviated Nasal Septum Right inferior turbinate hypertrophy |
Left | Septoplasty Right inferior turbinectomy |
| 3 (Male) | Deviated Nasal Septum | Left | Septoplasty |
| 4 (Male) | Deviated Nasal Septum | Left | Septoplasty |
| 5 (Male) | Deviated Nasal Septum Left inferior tubinate hypertrophy |
Bilateral | Septoplasty Left inferior turbinectomy |
| 6 (Male) | Deviated Nasal Septum | Right | Septoplasty (with slight lateralization of inferior turbinates) |
| 7 (Male) | Deviated Nasal Septum External Nasal Deformity |
Left | Septorhinoplasty |
| 8 (Female) | Deviated Nasal Septum External Nasal Deformity Inferior Turbinate Hypertrophy |
Right | Septorhinoplasty Turbinectomy |
| 9 (Male) | Deviated Nasal Septum External Nasal Deformity |
Right | Septorhinoplasty |
| 10 (Male) | Deviated Nasal Septum Bilateral Vestibular Stenosis |
Bilateral | Repair of bilateral vestibular
stenosis Septoplasty |
| 11 (Female) | Deviated Nasal Septum Bilateral Vestibular Stenosis Bilateral Inferior Turbinate Hypertrophy |
Right | Septoplasty Repair of bilateral vestibular stenosis with butterfly onlay graft Bilateral turbinectomy |
| 12 (Female) | Deviated Nasal Septum | Right | Septoplasty |
| 13 (Male) | Deviated Nasal Septum Bilateral Vestibular Stenosis |
Bilateral | Repair of bilateral vestibular
stenosis Septoplasty |
| 14 (Male) | Deviated Nasal Septum | Right | Septoplasty |
| 15 (Female) | Deviated Nasal Septum Bilateral Vestibular Stenosis |
Bilateral | Septoplasty Repair of bilateral vestibular stenosis with septal cartilage butterfly onlay graft |
Fifty-two healthy subjects undergoing cone-beam CT (CBCT) scans at Marquette University School of Dentistry for indications unrelated to nasal etiology were recruited. CBCT scans were obtained in 0.5-mm increments with in-plane resolution of 0.5mm. Subjects were at least 18 years-old, denied symptoms of nasal obstruction, and were non-smokers for at least 3 months preceding their scan. Exclusion criteria were pregnancy, history of nasal surgery, severe nasal trauma, autoimmune disease, chronic sinusitis, severe allergies or other sinonasal disease. Subjects were included if NOSE score ≤ 32 based on the mean NOSE score (15) plus one standard deviation (17) of healthy individuals described in a recent literature review.28
The first 15 patients from each cohort were selected for evaluation, regardless of subjects’ nasal cycle status.29 Within the NAO cohort (ten male, five female), 13 identified as Caucasian, one as Hispanic, and one as “other” ethnicity. Within the healthy cohort (four male, 11 female), eight identified as Caucasian, three as Hispanic, three as Asian, one as African-American and one as “other” ethnicity.
Creation of Three-Dimensional Models
Three-dimensional digital models of nasal passages (excluding paranasal sinuses) were created in Mimics 16.0 (Materialise Inc., Plymouth, Michigan). Models were exported in STL format and imported into ICEM-CFD 14.0 (ANSYS, Inc., Canonsburg, Pennsylvania), where planar nostrils and outlet surfaces were created and the geometry was meshed with approximately 4 million tetrahedral cells.
Definition of Intranasal Regions for Airflow Distribution
Each nasal cavity was sectioned into 11 uniformly-spaced coronal sections. The most posterior extent of either nostril was designated as relative distance (D)=0.0 and the posterior-most edge of the septum as D=1.0 (Figure 1). Coronal sections were labeled according to their relative distance from the nostril, as defined by D=Z/Lseptum, where Z is distance from the nostrils and Lseptum is septum length.
Figure 1:
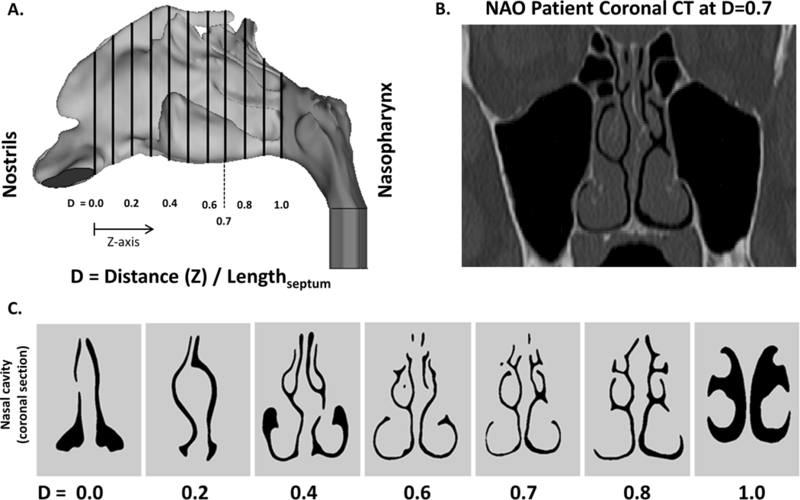
(A) CFD nasal airway (sagittal view) demonstrating 11 equally-spaced coronal cross-sections. (B) Coronal CT of NAO patient at D=0.7. (C) Coronal cross-sections of nasal cavity at corresponding relative distance (D).
To analyze regional airflow, the coronal sections at D=0.3, D=0.5, and D=0.7 were divided into three vertical segments designated as inferior, middle and superior regions independently for each nasal cavity using horizontal lines at the ventral lamella of each turbinate (Figure 2 and Figure A1). For clarity of presentation, the results for section D=0.7 are described below, while the results for sections D=0.3 and D=0.5 are presented in the Appendix. Section D=0.7 was selected for presentation because it includes the inferior, middle, and superior turbinates in nearly all subjects. The main conclusions of this manuscript were not dependent on the section selected for analysis (see Appendix).
Figure 2:
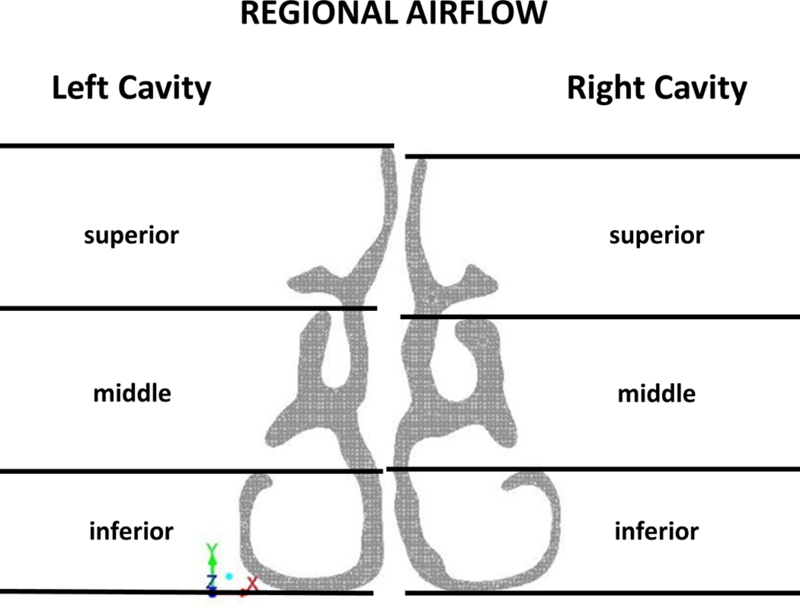
Each nasal cavity was vertically divided into inferior, middle and superior regions at relative distance D=0.7.
Figure A1 –
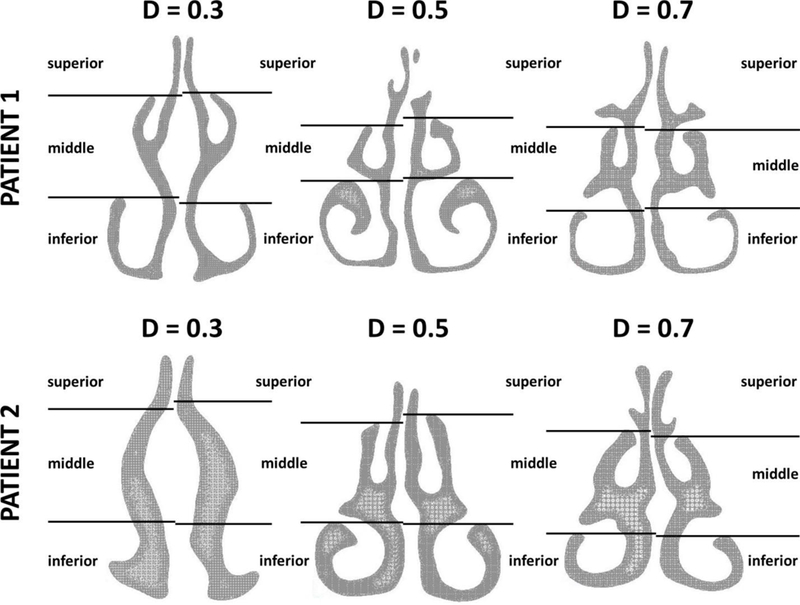
Definition of inferior, middle, and superior regions in three coronal sections of the nasal cavity (D=0.3, D=0.5, and D=0.7, where D is the relative distance from nostrils, see Figure 1.) Each section was divided into inferior, middle, and superior regions using horizontal lines through the ventral lamella of the inferior and middle turbinates. This systematic approach was applied to all sections in all patients, except that section D=0.3 did not always include the inferior and/or middle turbinates. In these patients (such as Patient 2 in this figure), the coordinates used to split section D=0.5 were also used to split section D=0.3.
CFD Simulations
Our CFD modeling methods have been described in detail elsewhere.22,31 Steady-state inspiratory laminar airflow simulations were conducted in Fluent 14.0 (ANSYS, Inc.) with the following boundary conditions: (1) air velocity set to zero at stationary walls, (2) pressure inlet at the nostrils with gauge pressure set to zero, and (3) an outlet pressure such that bilateral airflow was equal to 15L/min. The outlet pressure required to obtain 15 L/min of bilateral airflow was estimated by running preliminary simulations to quantify the relationship between outlet pressure and flowrate. Heat transfer simulation methods are described in detail in prior studies.21,31
Assessment of Subjective Nasal Patency
All participants were administered the Nasal Obstruction Symptom Evaluation (NOSE) to assess disease-specific quality-of-life. This is a 5-item scale in which patients rate symptoms of nasal congestion, nasal blockage, difficulty breathing through nose, difficulty sleeping, and air hunger sensation on a 0 (not a problem) to 4 (severe problem) scale. The score is then multiplied by 5 to give a score from 0 to 100.
In addition, a unilateral visual analog scale (VAS) score was obtained. Patients were asked to cover one nostril and rate their ability to breathe on a 0 (no obstruction) to 10 (severe obstruction) scale. This was repeated for the contralateral nostril. The VAS score represented an assessment of subjective nasal patency at the time of administration, while the NOSE score reflected NAO symptoms during the preceding 30 days.
Outcome Measures
CFD simulations provided the following measurements of previously-described objective measurements of nasal patency21,22: (1) unilateral nasal airflow, (2) unilateral nasal resistance, (3) total unilateral heat flux, (4) unilateral surface area where heat flux exceeds 50 W/m2 (SAHF50). In addition, regional flow was quantified in inferior, middle and superior regions (Figure 2).
Statistical Analysis
Wilcoxon signed-rank tests were used to test whether differences between the healthy and NAO cohorts were statistically significant at the level p <0.05. The correlation coefficients between subjective and objective measures of nasal patency were computed using both the Pearson and Kendall’s tau correlation coefficients, while trendlines were obtained using a least squares linear regression.
The manuscript focuses on correlations between subjective nasal patency and unilateral measures of nasal airflow in the narrowest nasal cavity based on previous reports that: (1) subjective nasal patency has a stronger correlation with unilateral rather than bilateral objective measures,5 and (2) subjective nasal patency has a stronger correlation with unilateral measures in the most obstructed side than with measures in the least obstructed side.22 The narrow side was defined as the cavity with lesser unilateral airflow in each individual. The correlation between subjective scores and intranasal airflow distribution in the non-narrow side was also investigated and the results are presented in the Appendix.
Results
Subjective Patency Scores
Subjective nasal patency scores were significantly different between NAO patients and healthy subjects measured by both NOSE (65 ± 18 vs. 6 ± 8, respectively, p<0.0001) and VAS (6.7 ± 2.7 vs. 1.7 ± 2.6 on the narrow side with p<0.001, 3.3 ± 2.3 vs. 1.4 ± 2.5 on the non-narrow side with p<0.01, respectively) (Figure 3). These data confirm a symptomatic distinction between cohorts as measured by NOSE and VAS scores.28
Figure 3:

(A) NOSE scores in NAO and healthy cohorts. (B) VAS scores in NAO and healthy cohorts (narrow side). (C) VAS scores in NAO and healthy cohorts (non-narrow side). Error bars: ±1 standard deviation.
Objective CFD Variables
Unilateral CFD variables were analyzed separately for narrow and non-narrow nasal cavities (Table 1). Unilateral nasal resistance was higher in NAO patients than in healthy subjects in the narrow cavity (0.75±1.4 Pa.s/ml vs. 0.10±0.04 Pa.s/ml, p=0.0006). Consequently, average unilateral airflow (72±34 ml/s vs. 105±14 ml/s, p=0.0025), average unilateral heat flux (114±54 W/m2 vs. 167±27 W/m2, p=0.0055), and average unilateral SAHF50 (30±13 cm2 vs. 41±5 cm2, p=0.007) were smaller in the narrow side of NAO patients as compared to healthy subjects.
Table 1:
Unilateral CFD variables previously described as correlating with subjective nasal patency are shown with comparison of mean values between NAO patients and healthy subjects.
| CFD Variables (mean ± standard deviation) | Narrow side | Non-narrow side | ||||
|---|---|---|---|---|---|---|
| NAO | Healthy | P value | NAO | Healthy | P value | |
| Unilateral Airflow (ml/s) | 72 ± 34 | 105 ± 14 | 0.0025 | 177 ± 34 | 145 ± 14 | 0.0025 |
| Unilateral Resistance (Pa.s/ml) | 0.75 ± 1.45 | 0.097 ± 0.040 | 0.0006 | 0.12 ± 0.07 | 0.07 ± 0.03 | 0.031 |
| Unilateral Heat Flux (W/m2) | 114 ± 54 | 167 ± 27 | 0.0055 | 230 ± 35 | 212 ± 15 | 0.12 |
| Surface area where heat flux > 50 W/m2 (cm2) | 30 ± 13 | 41 ± 5 | 0.007 | 58 ± 8 | 50 ± 5 | 0.0048 |
The correlation between unilateral CFD variables and subjective patency scores was analyzed for the entire cohort of 30 individuals combined together. Before looking at regional airflows, the two variables with the strongest correlation with subjective scores were total unilateral airflow (NOSE: r=−0.55, p=0.0016; VAS: r=−0.49, p=0.0056) and unilateral SAHF50 (NOSE: r=−0.55, p=0.0016; VAS: r=−0.51, p=0.0038) (Table 2).
Table 2:
Pearson and Kendall’s tau correlation coefficients, 95% confidence intervals (CI), and P values between CFD variables and subjective nasal patency (NOSE and VAS scores), narrow side only.
| Subjective scores vs objective
variable (Narrow side) |
Pearson correlation | Kendall’s tau correlation | ||||
|---|---|---|---|---|---|---|
| r | 95% CI | P Value | rho | 95% CI | P Value | |
| NOSE | ||||||
| Unilateral Airflow (ml/s) | -0.55 | -0.24 to −0.76 | 0.0016 | -0.35 | -0.14 to −0.56 | 0.001 |
| Unilateral Resistance (Pa.s/ml) | - | - | N.S. | 0.40 | 0.21 to 0.58 | <0.0001 |
| Unilateral Heat Flux (W/m2) | -0.48 | -0.14 to −0.72 | 0.0075 | - | - | N.S. |
| SAHF50 (cm2) | -0.55 | -0.24 to −0.76 | 0.0016 | -0.38 | -0.14 to −0.62 | 0.0016 |
| Inferior region airflow (ml/s) | - | - | N.S. | - | - | N.S. |
| Middle region airflow (ml/s) | -0.76 | -0.56 to −0.88 | <0.0001 | -0.54 | -0.38 to −0.69 | <0.0001 |
| Superior region airflow (ml/s) | - | - | N.S. | - | - | N.S. |
| VAS | ||||||
| Unilateral Airflow (ml/s) | -0.49 | -0.16 to −0.73 | 0.0056 | -0.32 | -0.12 to −0.53 | 0.0018 |
| Unilateral Resistance (Pa.s/ml) | - | - | N.S. | 0.41 | 0.22 to 0.61 | <0.0001 |
| Unilateral Heat Flux (W/m2) | -0.43 | -0.09 to −0.69 | 0.0166 | - | - | N.S. |
| SAHF50(cm2) | -0.51 | -0.19 to −0.74 | 0.0038 | -0.37 | -0.17 to −0.58 | 0.0004 |
| Inferior region airflow (ml/s) | - | - | N.S. | - | - | N.S. |
| Middle region airflow (ml/s) | -0.64 | -0.36 to −0.81 | 0.0002 | -0.38 | -0.19 to −0.58 | 0.0002 |
| Superior region airflow (ml/s) | - | - | N.S. | - | - | N.S. |
Abbreviations: N.S. = Not significant; SAHF50 = Surface area where heat flux > 50 W/m2.
Regional Airflow Distribution
Regional airflow distribution is graphically depicted in Figure 4. In the narrow cavity, only the average middle airflow differed significantly between cohorts, with NAO patients having less middle airflow than healthy individuals (31±18 ml/s vs. 68±10 ml/s, respectively; p<0.0001) (Figure 4). Analysis of regional airflow as a percentage of total unilateral airflow revealed that the main flow pathway was the middle region in healthy individuals (66 ± 9% vs. 23 ± 7% in the middle and inferior regions, respectively, p <0.0001). In contrast, similar percentages of inhaled air flowed through the middle and inferior regions in the narrow side of NAO patients (39 ± 13% middle region, 50 ± 18% inferior region, p = 0.16). This difference in airflow allocation between the two cohorts is further illustrated by the fact that middle flow exceeded inferior flow in the narrow cavity of all 15 healthy subjects, but in 7 of 15 NAO patients, inferior flow was greater than middle flow. Superior airflow in the narrow side did not differ significantly between cohorts with 11±5% and 11±10% of inspired air reaching the superior region in healthy and NAO cohorts, respectively (p=0.23).
Figure 4:

Regional airflow distribution in NAO and healthy cohorts, (A) Non-narrow and (B) narrow sides. Asterisk (*) denotes statistically significant differences. Error bars: ±1 standard deviation.
Subjective Patency vs. Regional Airflow
Subjective patency scores were plotted against narrow-side regional airflow (Figure 5). Narrow-side middle airflow demonstrated a strong correlation with both NOSE (r=−0.76, p<0.0001) and VAS scores (r=−0.64, p=0.0002), but inferior and superior airflows failed to correlate with subjective patency (Table 2 and Figure 5). The higher correlation of subjective patency with middle airflow is partially explained by a stronger correlation between total unilateral airflow and middle airflow (r=0.90, p<0.0001) than between total unilateral airflow and inferior or superior airflows (r=0.56, p=0.001; and r=0.49, p=0.006, respectively) (Figure 6).
Figure 5:
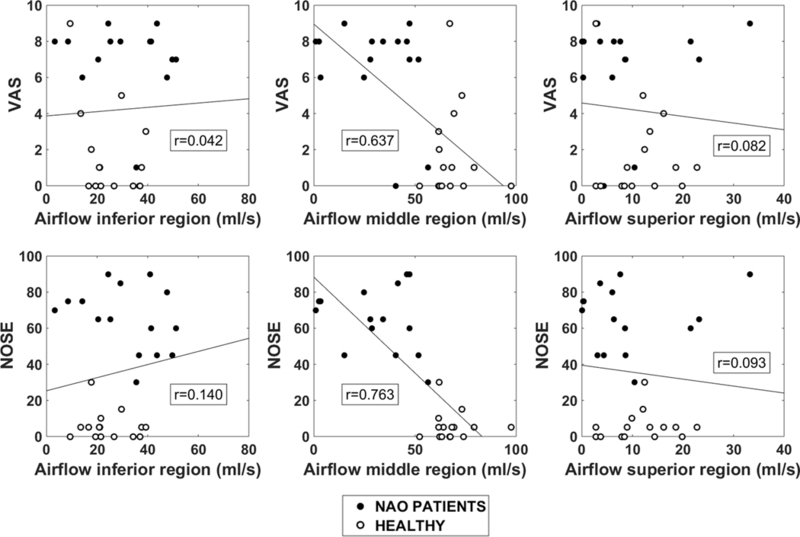
Unilateral VAS (top) and NOSE (bottom) scores plotted against regional airflow (inferior, middle, superior) in the narrow side.
Figure 6:

Unilateral regional airflow vs total unilateral airflow in NAO and healthy cohorts. Both narrow and non-narrow sides included (30 subjects, 60 nasal cavities).
Effect of Anatomic Obstruction on Airflow Distribution
We explored possible anatomical differences between NAO patients and healthy individuals that may explain the different airflow distributions in the two cohorts. First, several NAO patients (8 out 15) had anterior septal deviations constricting the nasal valve region (Figures 7A, 7B). These airway constrictions were usually located at the superior margin of the nasal valve, thus redirecting the airstream and favoring more inferior airflow in NAO patients (Figures 7C). Second, there was a tendency for narrower nasal cavities to have less middle airflow (r=−0.76, p<0.0001) (Figure 8A). Finally, middle airflow also correlated with SAHF50 (r=0.46, p=0.0002) (Figure 8B), suggesting that there is less stimulation of cold receptors in patients with low middle airflow.
Figure 7:
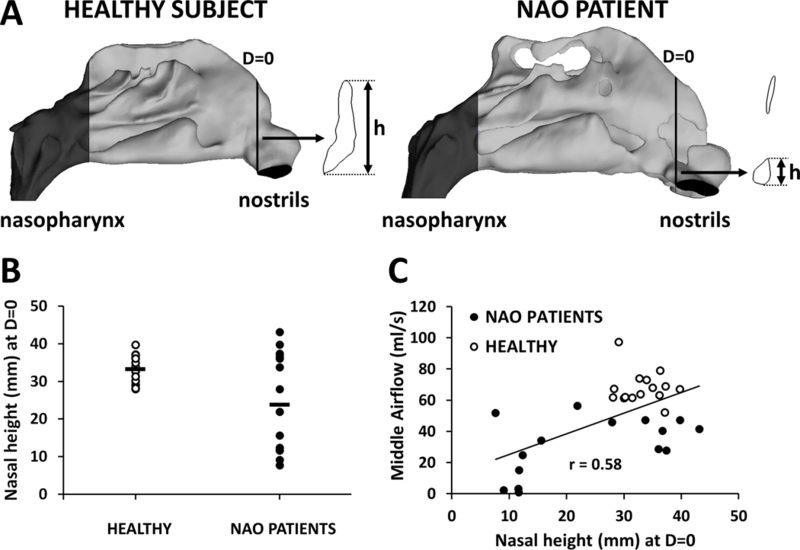
(A,B) Several patients in the NAO cohort had anterior septal deviations, which reduced the nasal height (h) measured at D=0 in the narrow side. (C) Middle airflow was lower in NAO patients with a small nasal height at D=0.
Figure 8:
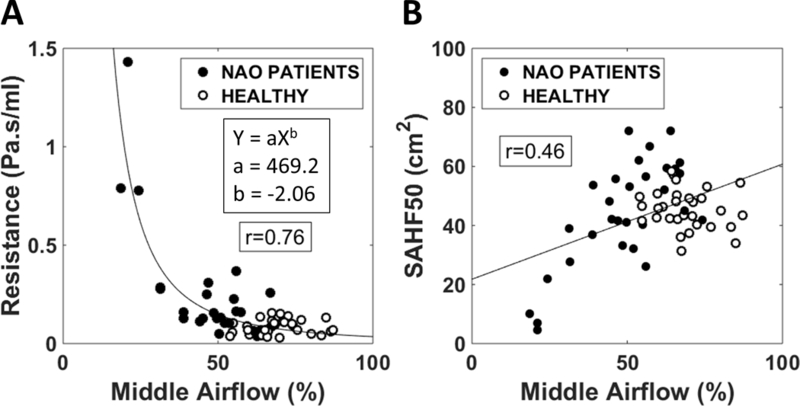
The percentage of unilateral airflow passing through the middle region correlated with (A) the unilateral nasal resistance and (B) the surface area where heat flux exceeds 50 W/m2 (SAHF50).
Discussion
The mechanism responsible for nasal airflow sensation remains incompletely understood. Multiple in vivo studies found that subjective nasal patency does not correlate with nasal resistance measured via rhinomanometry or the airspace minimal cross-sectional area (MCA) measured via acoustic rhinometry.4,5,8–10 This agrees with the concept that NAO patients present due to a subjective perception of decreased patency rather than an objective reduction in nasal resistance.32 Certainly, resistance is a related entity, however it remains a distinctly different variable than subjective patency,9 which recent literature suggests may be more related to mucosal cooling.24
The effect of mucosal cooling on nasal patency has been studied for over a century. In 1927, Fox33 reported that volatile oils such as camphor, eucalyptus and menthol improved patency perception without changing nasal resistance, which was supported by subsequent research in the 1980s and 90s.34–36 Further support to the mucosal cooling hypothesis comes from the observation that subjects report improved nasal patency when inspiring dry air (as compared to room air at the same temperature) due to evaporative mucosal cooling.6
Earlier studies suggested that airflow sensation occurs primarily at the nasal vestibule.37,38 Jones and coauthors32 reported that local anesthesia of the nasal vestibule produced a sensation of nasal obstruction. Clarke and Jones39 measured intranasal sensation to air jets and reported that the nasal vestibule is more sensitive to these mechanical stimulations than the posterior nose. Jones and colleagues40 measured the intranasal distribution of thermoreceptors using a cold probe and reported a higher density of thermoreceptors in the nasal vestibule relative to the nasal cavum. These studies suggested that the density of mechanoreceptors and thermoreceptors was not uniform within the nasal cavity, leading some investigators to conclude that the nasal mucosa has a limited role in airflow sensation and that the skin-lined nasal vestibule is the primary site for airflow sensation.37
Recent studies confirm that the mucosa of the nasal cavity is not a homogenous tissue; rather it consists of a heterogeneous distribution of sensory receptors.41,42 Frasnelli and colleagues used air puffs to determine that the mucosa of the anterior septum was more sensitive to CO2 while the posterior septum was more sensitive to mechanical stimuli.42 Meusel and collaborators measured trigeminal electrophysiological responses to several chemosensory stimuli, including menthol and CO2. While response to CO2 displayed an anterior-posterior gradient, menthol stimulation was similar throughout the nasal cavity, suggesting that menthol-sensitive cold receptors are uniformly distributed throughout the nasal cavity. Recent advances in molecular biomarkers have led to identification of a transient receptor potential cation channel, subfamily M, member 8 (TRPM8) as a cold- and menthol-sensitive receptor, and inferior turbinate biopsies have confirmed its presence within nasal mucosa.43,44 Altogether, these studies demonstrate that trigeminal somatosensory neurons enable the detection of a wide range of environmental stimuli within the nasal mucosa, including pressure, temperature, and chemical irritants.
Recent CFD studies have confirmed that mucosal cooling correlates with subjective nasal patency.21,22,26 Kimbell and colleagues found a correlation (|r|=0.65) between NOSE score and narrow side unilateral heat flux.22 Zhao and colleagues also reported correlation (|r|=0.46) between peak heat flux posterior to the nasal vestibule and average VAS score.26 In a study by Sullivan and colleagues21 looking at pre- and post-operative NAO patients, SAHF50 was determined to be the strongest predictor of nasal patency scores with a correlation of |r|=0.76 and |r|=0.63 for NOSE and VAS scores, respectively. These authors concluded that sensation of nasal patency was due to stimulation of cold receptors throughout the nasal mucosa (rather than at a single site where heat flux is maximum), which is consistent with the uniform distribution of TRPM8 receptors reported by Meusel and colleagues.41
Our study confirms the observation by Zhao and Jiang26 that subjective nasal patency correlates with intranasal airflow distribution (Figure 5 and Table A2). We expanded on their findings, demonstrating that (1) NAO patients have a deficit in middle airflow in the narrow cavity as compared to healthy individuals (Figure 4 and Figure A2); (2) subjective nasal patency has a stronger correlation with middle airflow in the narrow cavity than with any other regional airflow (Figure 5 and Figures A3–A7); (3) total unilateral airflow better correlates with middle airflow than inferior or superior airflows (Figure 6); (4) the abnormal airflow distribution in the NAO cohort is partially due to anterior septal deviations shunting airflow away from the middle region (Figure 7); and (5) intranasal airflow distribution correlates with both nasal resistance and SAHF50, suggesting that patients with a high nasal resistance tend to have less middle airflow and less stimulation of cold receptors (Figure 8).
Table A2 –
Pearson correlation coefficients (r), 95% confidence intervals, and P values between subjective nasal patency scores (NOSE and VAS) and regional airflow (inferior, middle, superior) measured either in the narrow side or in the non-narrow side at sections D=0.3, D=0.5, and D=0.7. N.S. = Not significant at level p<0.05.
| NARROW SIDE | ||||||
| NOSE | VAS | |||||
| r | 95% CI | P value | r | 95% CI | P value | |
| Section D = 0.3 | ||||||
| Inferior airflow (ml/s) | N.S. | - | - | N.S. | - | - |
| Middle airflow (ml/s) | -0.61 | -0.80 to −0.32 | < 0.001 | -0.47 | -0.71 to −0.13 | 0.009 |
| Superior airflow (ml/s) | N.S. | - | - | N.S. | - | - |
| Section D = 0.5 | ||||||
| Inferior airflow (ml/s) | N.S. | - | - | N.S. | - | - |
| Middle airflow (ml/s) | -0.66 | -0.82 to −0.39 | < 0.001 | -0.51 | -0.74 to −0.19 | 0.004 |
| Superior airflow (ml/s) | N.S. | - | - | N.S. | - | - |
| Section D = 0.7 | ||||||
| Inferior airflow (ml/s) | N.S. | - | - | N.S. | - | - |
| Middle airflow (ml/s) | -0.76 | -0.88 to −0.56 | < 0.001 | -0.64 | -0.81 to −0.36 | < 0.001 |
| Superior airflow (ml/s) | N.S. | - | - | N.S. | - | - |
| NON-NARROW SIDE | ||||||
| NOSE | VAS | |||||
| r | 95% CI | P value | r | 95% CI | P value | |
| Section D = 0.3 | ||||||
| Inferior airflow (ml/s) | N.S. | - | - | N.S. | - | - |
| Middle airflow (ml/s) | N.S. | - | - | N.S. | - | - |
| Superior airflow (ml/s) | N.S. | - | - | N.S. | - | - |
| Section D = 0.5 | ||||||
| Inferior airflow (ml/s) | N.S. | - | - | N.S. | - | - |
| Middle airflow (ml/s) | N.S. | - | - | N.S. | - | - |
| Superior airflow (ml/s) | N.S. | - | - | N.S. | - | - |
| Section D = 0.7 | ||||||
| Inferior airflow (ml/s) | 0.53 | 0.21 to 0.75 | 0.003 | N.S. | - | - |
| Middle airflow (ml/s) | N.S. | - | - | N.S. | - | - |
| Superior airflow (ml/s) | N.S. | - | - | N.S. | - | - |
Figure A2 –
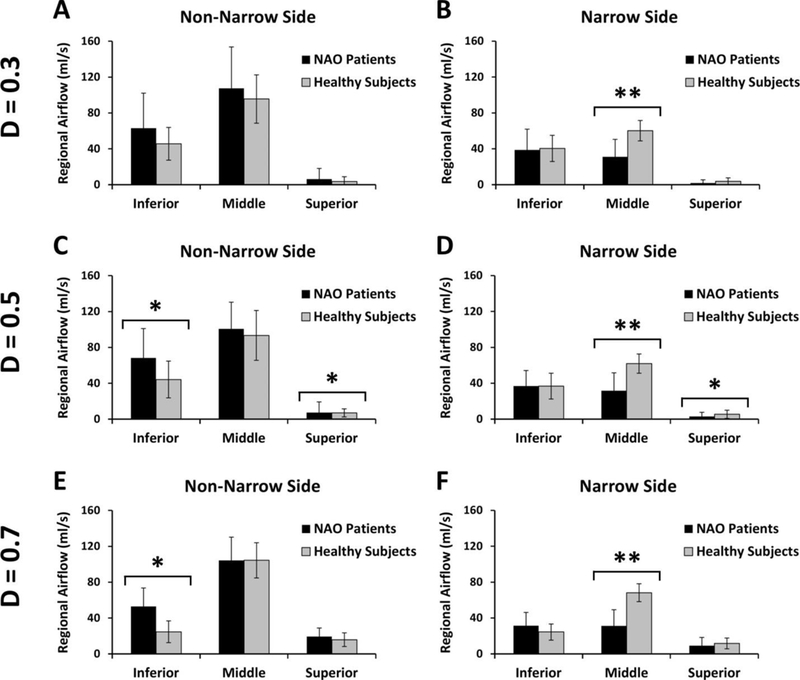
Regional airflow distribution in NAO and healthy cohorts. (A,B) Coronal section D=0.3. (C,D) Coronal section D=0.5. (E,F) Coronal section D=0.7. Single asterisk (*) denotes statistically significant differences at level p < 0.05. Double asterisk (**) denotes statistically significant differences at level p < 0.0002.
Figure A3 –
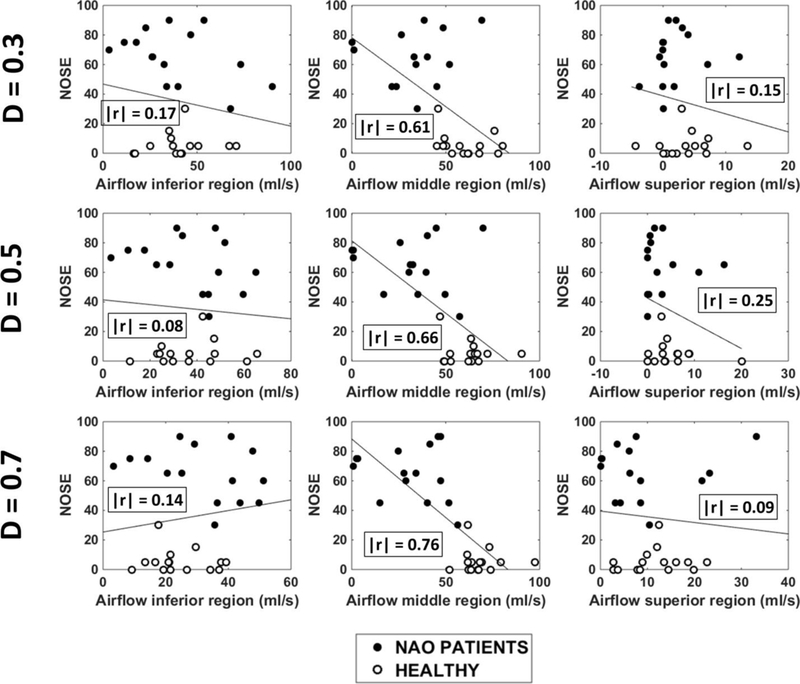
NOSE scores plotted against regional airflow (inferior, middle, and superior) measured unilaterally in the narrow cavity of 15 NAO patients and 15 healthy individuals in three coronal sections (D=0.3, D=0.5, and D=0.7). Abbreviations: D = relative distance from nostrils (see Figure 1); r = Pearson correlation coefficient.
Figure A7 –
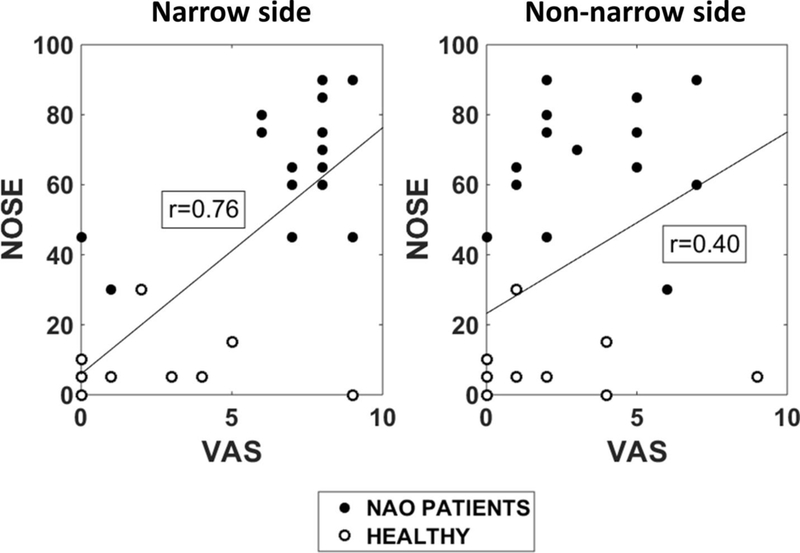
The NOSE score has a stronger correlation with the unilateral VAS score in the narrow side (Pearson r = 0.76) than with the unilateral VAS in the non-narrow side (Pearson r = 0.40). In each subject, the narrow side was defined as the nasal cavity with lesser unilateral airflow based on the CFD simulations.
Limitations of our study include the fact that we did not control for the nasal cycle.29 Both the NAO and healthy cohorts included some patients with asymmetric engorgement of the turbinates due to the nasal cycle. Our results (Figure 8) reveal that nasal cavities with high resistance tend to have less middle airflow, which suggests that intranasal airflow distribution may change during the nasal cycle. Future studies are needed to test this prediction. Another limitation of our study is that NAO symptoms can be caused by multiple anatomic deformities. We did not characterize airflow patterns by anatomic deformity (e.g., deviated septum vs. hypertrophied inferior turbinate). While future studies may consider characterizing airflow patterns by anatomic deformity, multiple anatomic deformities are often found concomitantly in the same patient (Table A1). Thus, we believe there is value in identifying CFD variables that correlate with subjective nasal patency in all-comers with NAO complaints. Finally, another limitation is that the two cohorts were not paired for demographics and an inter-cohort gender discrepancy was noted; however prior studies have indicated that no significant gender difference exists in nasal resistance measurements.45–47
In summary, in a cohort of 15 healthy individuals and 15 NAO patients, we found that NAO patients had a deficit in airflow around the middle turbinate in the narrow cavity, which was strongly correlated with the perception of nasal obstruction. It is unclear whether this implies that mucosal cooling in the region surrounding the middle turbinate is especially important for the sensation of nasal airflow. To the best of our knowledge, menthol-sensitive cold receptors have a uniform distribution on the nasal mucosa.41 However, the high correlation of middle airflow with subjective nasal patency raises an intriguing possibility that the 3-dimensional pattern of cold-receptor stimulation may be important for nasal airflow perception. Further research is required to confirm or refute this hypothesis.
Supplementary Material
Acknowledgements
We are grateful to Dr. Purushottam Laud (Medical College of Wisconsin) for statistics support. We also thank Dr. Julia Kimbell (UNC Chapel Hill) and Dr. Dennis Frank-Ito (Duke University) for discussions on intranasal airflow distribuition.
Funding: Funded by grant R01EB009557 from the National Institutes of Health/National Institute of Biomedical Imaging and Bioengineering.
APPENDIX
Effect of coronal section selected for analysis
Intranasal airflow distribution was studied in three coronal sections, namely at relative distances from nostrils D=0.3, D=0.5, and D=0.7. (The relative distance from nostrils D is defined in Figure 1.) Each section was divided into inferior, middle, and superior regions using horizontal lines through the ventral lamella of the inferior and middle turbinates (Figure A1). This systematic approach was applied to all sections in all patients, except that section D=0.3 did not always include the inferior and/or middle turbinates (e.g., see Patient 2 in Figure A1). In these patients, the coordinates used to split section D=0.5 were also used to split section D=0.3.
In all three coronal sections, NAO patients had less airflow through the middle region than healthy individuals in the narrow side (Figure A2). Also, middle airflow in the narrow side correlated with both NOSE and VAS scores irrespective of the coronal section selected for analysis (Table A2 and Figures A3 and A4). Inferior and superior airflows measured in the narrow side did not correlate with subjective patency scores in any cross-section (Table A2).
Figure A4 –
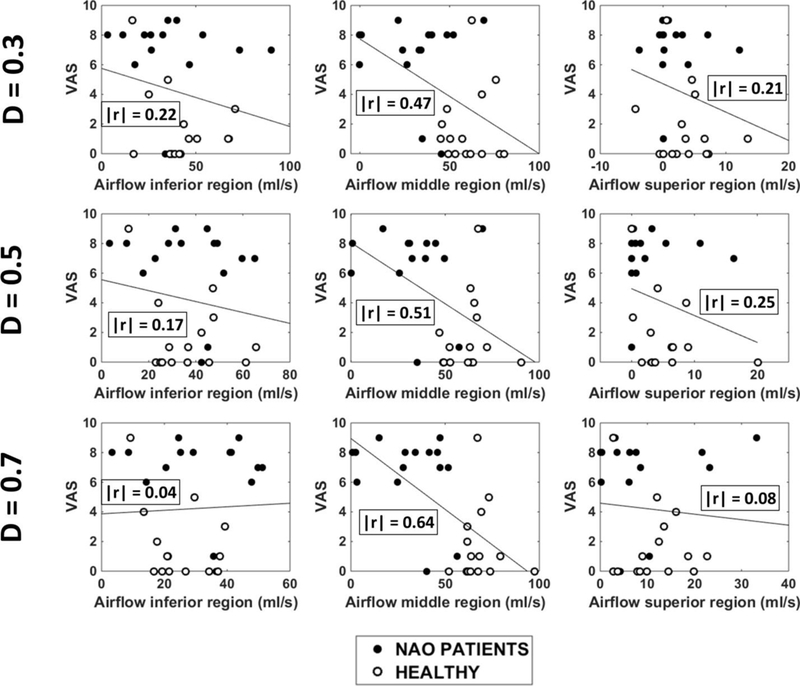
Unilateral VAS scores plotted against regional airflow (inferior, middle, and superior) measured unilaterally in the narrow cavity of 15 NAO patients and 15 healthy individuals in three coronal sections (D=0.3, D=0.5, and D=0.7). Abbreviations: D = relative distance from nostrils (see Figure 1); r = Pearson correlation coefficient.
Altogether, these results strongly suggest that the following conclusions do not depend on the cross-section selected for analysis:
(1) NAO patients have a deficit in middle airflow in the narrow side when compared to healthy individuals (Figure A2);
(2) Subjective nasal patency scores correlate with airflow in the middle region of the narrow side (Table A2 and Figures A3 and A4).
Narrow vs. non-narrow cavity
Our analysis of correlations between subjective and objective measures of nasal patency focused on unilateral measures in the narrowest nasal cavity (Table 2). The finding that inferior flow in the non-narrow side was significantly higher in NAO patients than in healthy subjects (Figure A2) raises the possibility that airflow in the non-narrow side could also contribute to the perception of nasal airflow. To consider this possibility, we also investigated the correlation between subjective scores and regional airflows in the non-narrow side.
A statistically significant correlation was found between the NOSE score and inferior flow in the non-narrow side at section D = 0.7 (Table A2 and Figure A5). However, at sections D=0.3 and D=0.5, the correlation between NOSE and inferior flow in the non-narrow side was not statistically significant (Table A2). Furthermore, VAS score did not correlate with inferior flow in the non-narrow side in any of the 3 coronal sections studied (Table A2 and Figure A6). Therefore, the correlation between subjective scores and inferior flow in the non-narrow side was inconsistent. In contrast, the correlation between subjective scores and middle flow in the narrow side was statistically significant for both NOSE and VAS scores in all 3 coronal sections studied (Table A2).
Figure A5 –
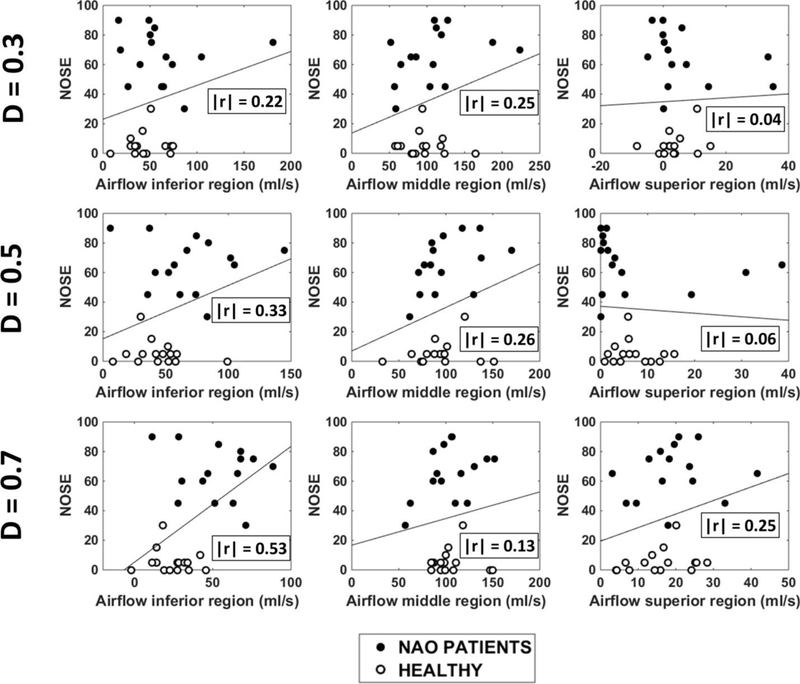
NOSE scores plotted against regional airflow (inferior, middle, and superior) measured unilaterally in the non-narrow cavity of 15 NAO patients and 15 healthy individuals in three coronal sections (D=0.3, D=0.5, and D=0.7). Abbreviations: D = relative distance from nostrils (see Figure 1); r = Pearson correlation coefficient.
Figure A6 –
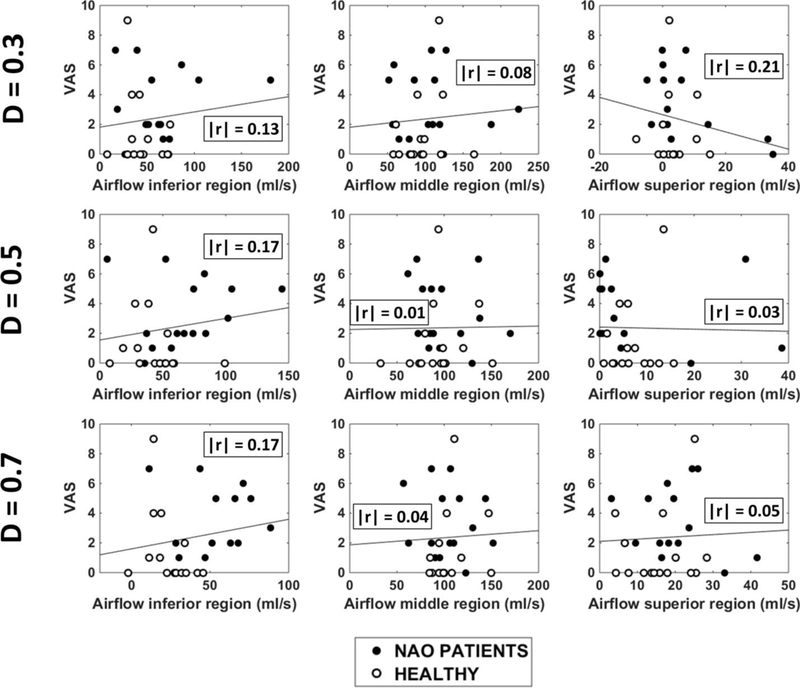
Unilateral VAS scores plotted against regional airflow (inferior, middle, and superior) measured unilaterally in the non-narrow cavity of 15 NAO patients and 15 healthy individuals in three coronal sections (D=0.3, D=0.5, and D=0.7). Abbreviations: D = relative distance from nostrils (see Figure 1); r = Pearson correlation coefficient.
Based on these findings, we believe that the key physiologic measurement responsible for the sensation of nasal obstruction in NAO patients is the airflow limitation in the narrow side. This is further supported by an analysis of the correlation between NOSE and VAS in our sample of 15 NAO patients and 15 healthy subjects. The NOSE survey is a bilateral measurement of NAO symptoms, while a unilateral VAS was used in this study. NOSE had a stronger correlation with VAS in the narrow side (r = 0.76, CI = 0.55 to 0.88, p < 0.0001) than with VAS in the non-narrow side (r = 0.40, CI = 0.05 to 0.66, p = 0.03) (Figure A7). This suggests that the sensation of nasal obstruction, as assessed by the NOSE survey, is more related to airflow in the narrow side than to airflow in the non-narrow side.
Footnotes
Abstract selected for oral presentation at the American Academy of Otolaryngology-Head and Neck Surgery 2016 Annual Meeting, September 18–21, San Diego, CA.
IRB approval: This project was approved by the IRB committee at the Medical College of Wisconsin and informed consent was obtained from each patient.
References
- 1.Teti VP, Akdagli S, Most SP. Cost-effectiveness of Corticosteroid Nasal Spray vs Surgical Therapy in Patients With Severe to Extreme Anatomical Nasal Obstruction. JAMA Facial Plast Surg 2016:e1–7. [DOI] [PubMed] [Google Scholar]
- 2.Kimmelman CP. The problem of nasal obstruction. Otolaryngol Clin North Am 1989;22:253–264. [PubMed] [Google Scholar]
- 3.Kjærgaard T, Cvancarova M, Steinsvåg SK. Does Nasal Obstruction Mean That the Nose Is Obstructed? Laryngoscope 2008;118:1476–1481. [DOI] [PubMed] [Google Scholar]
- 4.Lam DJ, James KT, Weaver EM. Comparison of anatomic, physiological, and subjective measures of the nasal airway. Am J Rhinol 2006;20:463–470. [DOI] [PubMed] [Google Scholar]
- 5.Andre RF, Vuyk HD, Ahmed A, et al. Correlation between subjective and objective evaluation of the nasal airway. A systematic review of the highest level of evidence. Clin Otolaryngol 2009;34:518–525. [DOI] [PubMed] [Google Scholar]
- 6.Zhao K, Blacker K, Luo Y, et al. Perceiving nasal patency through mucosal cooling rather than air temperature or nasal resistance. PloS One 2011;6:e24618. [DOI] [PMC free article] [PubMed] [Google Scholar]
- 7.Dinis PB, Haider H. Septoplasty: long-term evaluation of results. Am J Otolaryngol 2002;23:85–90. [DOI] [PubMed] [Google Scholar]
- 8.Hardcastle PF, White A, Prescott RJ. Clinical and rhinometric assessment of the nasal airway--do they measure the same entity? Clin Otolaryngol Allied Sci 1988;13:185–191. [DOI] [PubMed] [Google Scholar]
- 9.Hardcastle PF, White A, Prescott RJ. Clinical or rhinometric assessment of the nasal airway--which is better? Clin Otolaryngol Allied Sci 1988;13:381–385. [DOI] [PubMed] [Google Scholar]
- 10.Thulesius HL, Cervin A, Jessen M. Can we always trust rhinomanometry? Rhinology 2011;49:46–52. [DOI] [PubMed] [Google Scholar]
- 11.Sundh C, Sunnergren O. Long-term symptom relief after septoplasty. European Archives of Oto-Rhino-Laryngology 2015;272:2871–2875. [DOI] [PubMed] [Google Scholar]
- 12.Roblin DG, Eccles R. What, if any, is the value of septal surgery? Clin Otolaryngol Allied Sci 2002;27:77–80. [DOI] [PubMed] [Google Scholar]
- 13.Dommerby H, Rasmussen OR, Rosborg J. Long-term results of septoplastic operations. ORL J Otorhinolaryngol Relat Spec 1985;47:151–157. [DOI] [PubMed] [Google Scholar]
- 14.Fjermedal O, Saunte C, Pedersen S. Septoplasty and/or submucous resection? 5 years nasal septum operations. J Laryngol Otol 1988;102:796–798. [DOI] [PubMed] [Google Scholar]
- 15.Samad I, Stevens HE, Maloney A. The efficacy of nasal septal surgery. J Otolaryngol 1992;21:88–91. [PubMed] [Google Scholar]
- 16.Septoplasty Illum P. and compensatory inferior turbinate hypertrophy: long-term results after randomized turbinoplasty. Eur Arch Otorhinolaryngol 1997;254 Suppl 1:S89–92. [DOI] [PubMed] [Google Scholar]
- 17.Andre RF, D’Souza AR, Kunst HP, et al. Sub-alar batten grafts as treatment for nasal valve incompetence; description of technique and functional evaluation. Rhinology 2006;44:118–122. [PubMed] [Google Scholar]
- 18.Konstantinidis I, Triaridis S, Triaridis A, et al. Long term results following nasal septal surgery: Focus on patients’ satisfaction. Auris Nasus Larynx 2005;32:369–374. [DOI] [PubMed] [Google Scholar]
- 19.Sedaghat AR, Busaba NY, Cunningham MJ, et al. Clinical assessment is an accurate predictor of which patients will need septoplasty. Laryngoscope 2013;123:48–52. [DOI] [PubMed] [Google Scholar]
- 20.Holmstrom M The use of objective measures in selecting patients for septal surgery. Rhinology 2010;48:387–393. [DOI] [PubMed] [Google Scholar]
- 21.Sullivan CD, Garcia GJ, Frank-Ito DO, et al. Perception of better nasal patency correlates with increased mucosal cooling after surgery for nasal obstruction. Otolaryngology and Head and Neck Surgery 2014;150:139–147. [DOI] [PMC free article] [PubMed] [Google Scholar]
- 22.Kimbell JS, Frank DO, Laud P, et al. Changes in nasal airflow and heat transfer correlate with symptom improvement after surgery for nasal obstruction. Journal of Biomechanics 2013;46:2634–2643. [DOI] [PMC free article] [PubMed] [Google Scholar]
- 23.Zhao K, Jiang J, Blacker K, et al. Regional peak mucosal cooling predicts the perception of nasal patency. Laryngoscope 2014;124:589–595. [DOI] [PMC free article] [PubMed] [Google Scholar]
- 24.Sozansky J, Houser SM. The physiological mechanism for sensing nasal airflow: a literature review. Int Forum Allergy Rhinol 2014;4:834–838. [DOI] [PubMed] [Google Scholar]
- 25.Bailey RS, Casey KP, Pawar SS, et al. Correlation of nasal mucosal temperature with subjective nasal patency in healthy individuals. JAMA Facial Plastic Surgery 2017; in press. DOI: 10.1001/jamafacial.2016.1445 [DOI] [PMC free article] [PubMed] [Google Scholar]
- 26.Zhao K, Jiang J. What is normal nasal airflow? A computational study of 22 healthy adults. Int Forum Allergy Rhinol 2014;4:435–446. [DOI] [PMC free article] [PubMed] [Google Scholar]
- 27.Kimbell JS, Garcia GJ, Frank DO, et al. Computed nasal resistance compared with patient-reported symptoms in surgically treated nasal airway passages: a preliminary report. Am J Rhinol Allergy 2012;26:e94–98. [DOI] [PMC free article] [PubMed] [Google Scholar]
- 28.Rhee JS, Sullivan CD, Frank DO, et al. A systematic review of patient-reported nasal obstruction scores: defining normative and symptomatic ranges in surgical patients. JAMA Facial Plast Surg 2014;16:219–225; quiz 232. [DOI] [PMC free article] [PubMed] [Google Scholar]
- 29.Patel RG, Garcia GJ, Frank-Ito DO, et al. Simulating the nasal cycle with computational fluid dynamics. Otolaryngology and Head and Neck Surgery 2015;152:353–360. [DOI] [PMC free article] [PubMed] [Google Scholar]
- 30.Garcia GJ, Hariri BM, Patel RG, et al. The relationship between nasal resistance to airflow and the airspace minimal cross-sectional area. Journal of Biomechanics 2016;49:1670–1678. [DOI] [PMC free article] [PubMed] [Google Scholar]
- 31.Garcia GJ, Bailie N, Martins DA, et al. Atrophic rhinitis: a CFD study of air conditioning in the nasal cavity. Journal of Applied Physiology 2007;103:1082–1092. [DOI] [PubMed] [Google Scholar]
- 32.Jones AS, Crosher R, Wight RG, et al. The effect of local anaesthesia of the nasal vestibule on nasal sensation of airflow and nasal resistance. Clin Otolaryngol Allied Sci 1987;12:461–464. [DOI] [PubMed] [Google Scholar]
- 33.Fox N EFfect of camphor, eucalyptol and menthol on the vascular state of the mucous membrane. Archives of Otolaryngology 1927;6:112–122. [Google Scholar]
- 34.Burrow A, Eccles R, Jones AS. The effects of camphor, eucalyptus and menthol vapour on nasal resistance to airflow and nasal sensation. Acta Oto-Laryngologica 1983;96:157–161. [DOI] [PubMed] [Google Scholar]
- 35.Eccles R, Lancashire B, Tolley NS. The effect of aromatics on inspiratory and expiratory nasal resistance to airflow. Clin Otolaryngol Allied Sci 1987;12:11–14. [DOI] [PubMed] [Google Scholar]
- 36.Eccles R, Griffiths DH, Newton CG, et al. The effects of menthol isomers on nasal sensation of airflow. Clinical Otolaryngology and Allied Sciences 1988;13:25–29. [DOI] [PubMed] [Google Scholar]
- 37.Clarke RW, Jones AS. Nasal airflow receptors: the relative importance of temperature and tactile stimulation. Clin Otolaryngol Allied Sci 1992;17:388–392. [DOI] [PubMed] [Google Scholar]
- 38.Clarke RW, Jones AS. Nasal airflow sensation. Clin Otolaryngol Allied Sci 1995;20:97–99. [DOI] [PubMed] [Google Scholar]
- 39.Clarke RW, Jones AS. The distribution of nasal airflow sensitivity in normal subjects. J Laryngol Otol 1994;108:1045–1047. [DOI] [PubMed] [Google Scholar]
- 40.Jones AS, Wight RG, Durham LH. The distribution of thermoreceptors within the nasal cavity. Clin Otolaryngol Allied Sci 1989;14:235–239. [DOI] [PubMed] [Google Scholar]
- 41.Meusel T, Negoias S, Scheibe M, et al. Topographical differences in distribution and responsiveness of trigeminal sensitivity within the human nasal mucosa. Pain 2010;151:516–521. [DOI] [PubMed] [Google Scholar]
- 42.Frasnelli J, Heilmann S, Hummel T. Responsiveness of human nasal mucosa to trigeminal stimuli depends on the site of stimulation. Neurosci Lett 2004;362:65–69. [DOI] [PubMed] [Google Scholar]
- 43.Keh SM, Facer P, Yehia A, et al. The menthol and cold sensation receptor TRPM8 in normal human nasal mucosa and rhinitis. Rhinology 2011;49:453–457. [DOI] [PubMed] [Google Scholar]
- 44.Liu SC, Lu HH, Cheng LH, et al. Identification of the cold receptor TRPM8 in the nasal mucosa. Am J Rhinol Allergy 2015;29:e112–116. [DOI] [PubMed] [Google Scholar]
- 45.Rhinomanometry Broms P. III. Procedures and criteria for distinction between skeletal stenosis and mucosal swelling. Acta Otolaryngol 1982;94:361–370. [PubMed] [Google Scholar]
- 46.Vogt K, Jalowayski AA, Althaus W, et al. 4-Phase-Rhinomanometry (4PR)--basics and practice 2010. Rhinol Suppl 2010:1–50. [PubMed] [Google Scholar]
- 47.Morris S, Jawad MS, Eccles R. Relationships between vital capacity, height and nasal airway resistance in asymptomatic volunteers. Rhinology 1992;30:259–264. [PubMed] [Google Scholar]
Associated Data
This section collects any data citations, data availability statements, or supplementary materials included in this article.


