 CuO NPs at 1000 μM for 24 h in the WRL-68 cell induced methylation of CpG island II via ROS on the catalase promoter and downregulate catalase expression at the transcriptional level.
Abstract
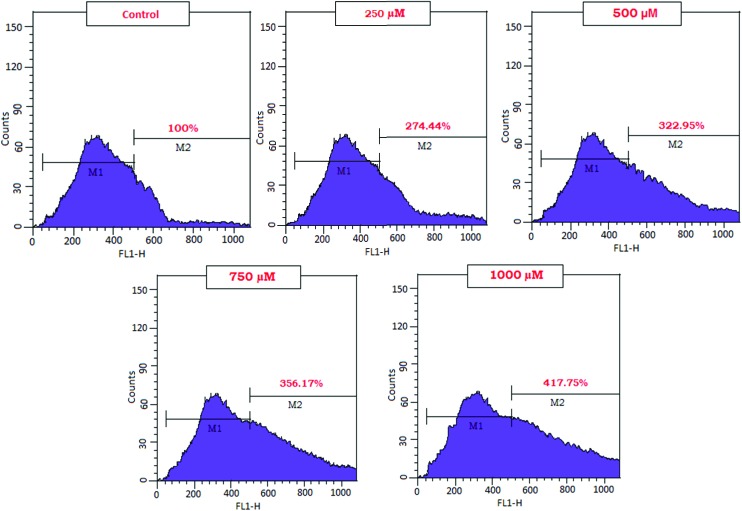
The advent of nanotechnology has led to new applications of copper as antibiotic treatment alternatives, nanocomposite coatings, catalysts, and lubricants among others. However, few studies address the impact of nano-size copper on the molecular mechanism of eukaryotic cells. Therefore, in the present study, the human hepatic cell line (WRL-68) was used to evaluate the molecular mechanism involved in the adverse effect of CuO NPs. CuO NPs were characterized by scanning electron microscopy and dynamic light scattering to confirm their 100 nm size and their purity was determined by Fourier transform infra-red spectroscopy. The side scattered intensity in WRL-68 cells at a CuO NP concentration of 250, 500, 750 and 1000 μM was found to be 108.83%, 126.86%, 189.03% and 250.88% respectively. The reactive oxygen species (ROS) generation at a CuO NP concentration of 1000 μM in WRL-68 cells was 417.75%. Moreover, the ROS induced methylation of CpG island II on the catalase promoter and downregulated catalase expression at the transcriptional level in WRL-68 cells. Furthermore, the activity of the catalase enzyme was found to decrease with an increase in concentration of CuO NPs. Subsequently, the proliferation of the WRL-68 cells was increased on exposure to the CuO NPs as demonstrated by the mitochondrial activity in the MTT assay. Conclusively, it is demonstrated that exposure of CuO NPs at 1000 μM for 24 h in the WRL-68 cell induced methylation of CpG island II via ROS on the catalase promoter and downregulated catalase expression at the transcriptional level. The obtained molecular mechanistic insights described adverse effects related to the CuO NPs.
Introduction
The application of copper and copper based nanoproducts, which are based on the earth abundant and inexpensive copper metal, has generated a great deal of interest in the field of nanomedicine as catalyst supports, drug carriers, and gene delivery systems.1 Exposure to engineered CuO nanoparticles (NPs) can occur dermally or via inhalation. The widespread use and applications such as oral administration through food or drinking water, skin absorption through sunscreen and/or cosmetic application, and injection through medical procedures present a number of potential problems.2 Sandstead (1995) suggested that the safe level of copper in drinking water for humans varies depending on the source, but tends to be pegged at 2.0 mg l–1.3 Heinlaa et al. (2008) suggested that CuO NPs possess greater cytotoxic potential compared to their bulk counterpart and other metal oxide NPs.4 CuO NPs cause significant cell death, as compared with iron oxides, titanium dioxide and silica NPs.5 The cytotoxic effect in the case of Hep-2 cells at a concentration range of 2–50 μg ml–1 of CuO NPs6 and the genotoxic effect at 15 μg ml–1 CuO NPs in A549 cells was reported.7 The reactive oxygen species (ROS) generated by CuO NPs may result in the activation of apoptosis and also in the activation of the MAPK-JNK pathway. This in turn is regulated by an increase in the expression of the p53 and caspase 3 genes. However, CuO NPs may also result in autophagy of the A549 cells as demonstrated by Sun et al., (2012).8 Thus, we put in the effort to explore the effect of ROS generated by CuO NPs at the molecular level.
Catalase is a 240 kDa homotetrameric enzyme and it catalyzes the decomposition of hydrogen peroxide (H2O2). Thus, it plays a key role in protecting cells against ROS production.9 An aberrant methylation of gene promoters can cause epigenetic gene silencing and this plays an essential role in the regulation of chromatin structure formation and gene silencing.10 The present study targeted CpG island II as a promoter sequence for the key antioxidant enzyme catalase and explored its epigenetic regulation in WRL-68 cell on exposure to CuO NPs.
Materials & methods
Copper(ii) oxide NPs were procured from Reinste Nano ventures, New Delhi, India. Minimum Essential Medium (MEM) and FBS were purchased from Invitrogen, Carlsbad, CA, USA.
SEM analysis
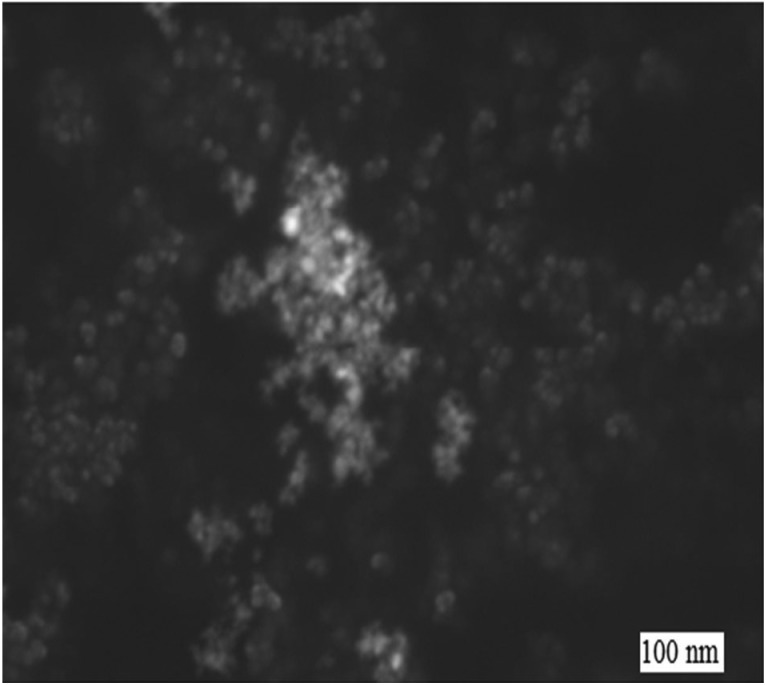
The copper(ii) oxide NPs procured from Reinste Nano ventures, New Delhi, India were analyzed by SEM. The CuO NPs were mounted on aluminium stubs with double-sided tape and silver glue and then sputter coated with platinum or chromium. The CuO NPs were observed using a Zeiss scanning electron microscope DMS 962.
Dynamic light scattering (DLS)
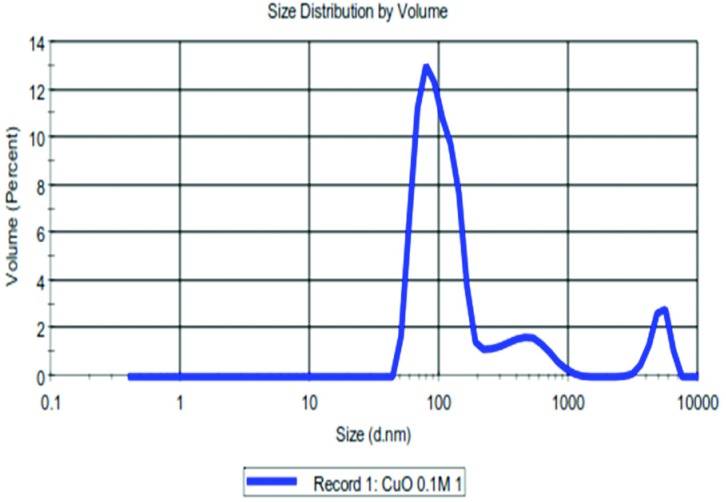
The CuO NPs were suspended in Milli-Q water and culture medium (supplemented with 10% FBS) separately at a final concentration of 1 mM and subjected to probe sonication for 10 min at 30 watt for 2 min pulse on and 1 min pulse off cycles. The size and zeta potential of the CuO NPs were analyzed using dynamic light scattering and phase analysis light scattering techniques in a Zetasizer Nano-ZS equipped with a 4.0 mW, 633 nm laser (model ZEN 3600; Malvern Instruments Ltd, Malvern, UK).
Fourier transform infrared (FT-IR)
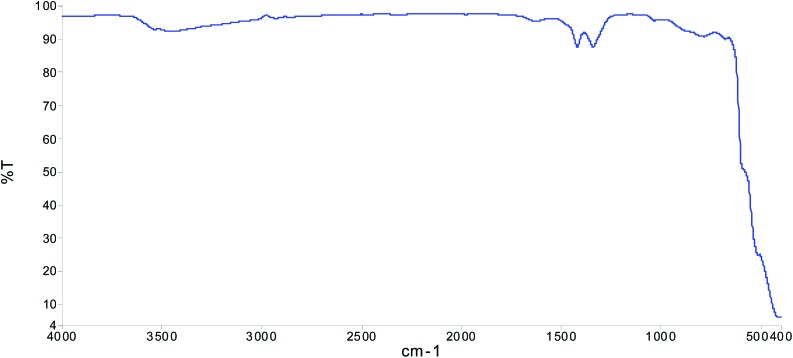
Fourier transform infrared spectra were generated by the absorption of electromagnetic radiation in the frequency range of 400 to 4000 cm–1. The different functional groups in the molecule absorbed at characteristic frequencies. The FTIR spectra were recorded using a Perkin Elimer-spectrum RXI model.
Cell culture
The WRL-68 cells (passage number 42) were procured from NCCS, Pune. The WRL-68 cells were cultured at 37 °C in 5% CO2 in Minimum Essential Medium (MEM) +10% FBS (Invitrogen, Carlsbad, CA, USA). For CuO treatment, the CuO NPs were added in the medium at different doses for 24 h as indicated in the legend.
Estimation of CuO NPs uptake by flow cytometry
The cellular uptake of CuO NPs in the WRL-68 human hepatic cell line was carried out using flow cytometry according to Suzuki et al. (2002).11 The cells were seeded in 6-well cell culture plates at a density of 1.0 × 10⁵ cells per well and after 15–20 h the cells were exposed to concentrations of 250, 500, 750 and 1000 μM CuO NPs for 24 h. The cells were then harvested and collected in a sterile centrifuge tube, which was centrifuged at 900 rpm for 6 min. The supernatant was discarded and the pellet was re-suspended in 500 μl of 1× PBS. The uptake was determined by a flow cytometer equipped with a 488 nm laser.
Measurement of intracellular reactive oxygen species generation
The production of intracellular ROS was measured using 2,7-dichlorofluorescin diacetate (DCFH-DA) as described by Zhao et al. (2011) with some modifications. In brief, the WRL-68 cells were seeded in 6-well plates and allowed to adhere. The treated cells were washed twice with PBS and incubated for 30 min in the dark in a culture medium (without FBS) containing DCFH-DA (10 mM). The control and the treated cells were visualized by use of a fluorescence microscope and the images were obtained at 200 magnification.12
Methylation-specific polymerase chain reaction (MSP)
The methylation status of the catalase promoter was determined by primers designed for MSP using the Methyl Primer Express software (Applied Biosystems). The sequences used as the oligonucleotide primers are provided in ESI Table 1.†
Real-time quantitative PCR
The WRL-68 cells were cultured in 6-well plates and exposed to 1000 μM CuO NPs for 24 h. At the end of exposure, total RNA was extracted from cultured cells using Trizol reagent (Invitrogen) according to the manufacturer's protocol. The integrity of the RNA was visualized on 1% agarose gel using a gel documentation system. The oligonucleotide primer sequences are given in ESI Table 2.† The first strand cDNA was synthesized from 1 mg of total RNA by Reverse Transcriptase using M-MLV (Promega, Madison, WI) and oligo (dT) primers (Promega) according to the manufacturer's protocol. Quantitative real-time PCR (RT-PCRq) was performed using a QuantiTect SYBR Green PCR kit (Qiagen) using an ABI PRISM 7900HT Sequence Detection System (Applied Biosystems) with specific primers designed using Primer Express software (Applied Biosystems). One microliter of template cDNA was added to the final volume of 10 ml of reaction mixture. The real-time PCR cycle parameters included 10 min at 95 °C followed by 40 cycles involving denaturation at 95 °C for 15 s, annealing at 60 °C for 15 s, and elongation at 72 °C for 15 s. All the real-time PCR experiments were performed in triplicate and the data were expressed as the mean of three independent experiments.
Catalase activity assay
The catalase activity was assayed by the Aebi (1984) method. Briefly, 0.1 ml of cell lysates was added to 1.5 ml of freshly prepared 13.2 mM H2O2 in 0.05 M K2HPO4 (pH 7.0) buffer. The rate of decomposition of H2O2 was monitored spectrophotometrically at 240 nm. The catalase activity is expressed as U mg–1 protein.13
MTT assay
MTT assay was done according to the method of Mosmann (1983). The cells (10 000 per well in 85 μl medium) were seeded in a 96 well plate and allowed to adhere overnight. The medium was aspirated and the cells were incubated with CuO NPs (250, 500, 750 and 1000 μM) at 37 °C for 24 h, and then for 4 h with MTT dye (2.5 mg per 0.5 ml in PBS). The reaction mixture was carefully aspirated, and the resulting formazan crystals were solubilized by adding 200 μl dimethylsulphoxide. After 10 min, the absorbance was read at 530 nm in a SYNERGY-HT multiwell plate reader, Bio-Tek (USA) using KC4 software.14
Results
Characterization of CuO NPs
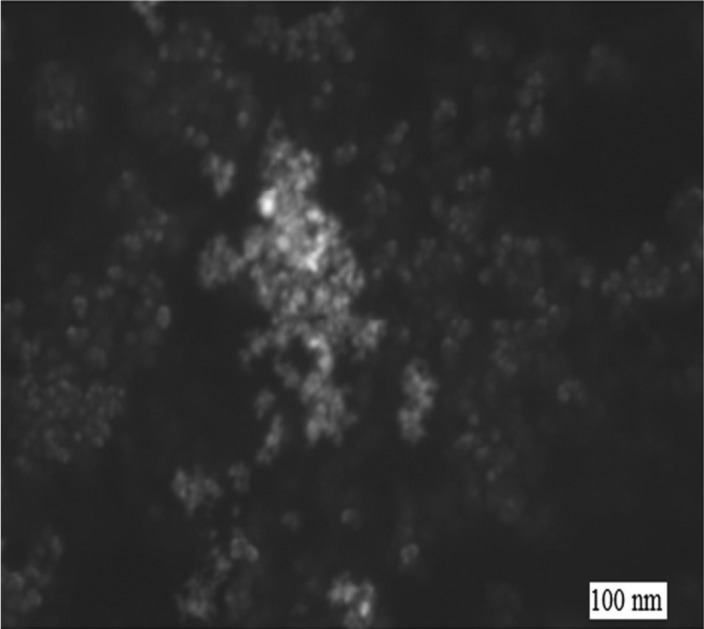
Fig. 1 and Fig. 2 show that the size of the CuO NPs was 100 nm. The FT-IR spectrum (Fig. 3), where the x-axis denotes wavenumber and the y-axis denotes % transmittance of CuO NPs, shows the vibration band at 1384 cm–1 for Cu2+–O2+ stretching.15 Thus, this confirms the purity of the CuO NPs.
Fig. 1. SEM image of the CuO NPs.
Fig. 2. DLS spectrum of the CuO NPs.
Fig. 3. FT-IR spectrum of the CuO NPs. The x-axis denotes wave number (cm–1) and the y-axis denotes % transmittance.
Estimation of the CuO NPs uptake in the WRL-68 cells
The uptake of the CuO NPs in the WRL-68 cells was determined using flow cytometry. The SSC intensity represents the granularity of a cell and the FSC represents the size of the cell. The nanoparticle uptake is considered to increase proportionally with the increase in side scatter intensity of the cell. Table 1 shows the concentration dependent increase in uptake of the CuO NPs attributed to an increase in the intensity of SSC of 108.83%, 126.86%, 189.03% and 250.88%. The result shows an increase in granularity but the size of the cells remains constant.
Table 1. The cellular uptake of the CuO NPs in the WRL-68 cells.
| Concentration | %Forward scatter (FSC) | %Side scatter |
| Control | 100 ± 2.12 | 100 ± 2.82 |
| 250 μM | 101.46 ± 2.56 | 108.83 ± 3.08 |
| 500 μM | 100.72 ± 3.21 | 126.86 ± 2.61 |
| 750 μM | 100.41 ± 2.82 | 189.03 ± 2.56 |
| 1000 μM | 99.89 ± 2.21 | 250.88 ± 2.86 |
Intracellular reactive oxygen species (ROS) measurement
ROS generation plays a key role in the toxicity of NPs in mammalian cells.6,7 Fig. 4 shows an increase in % ROS generation in WRL-68 cells on treatment with an increased concentration of CuO NPs.
Fig. 4. Estimation of ROS generated by the CuO NPs in the WRL-68 cells. The WRL-68 cells were exposed to concentrations of 250 μM, 500 μM, 750 μM, and 1000 μM CuO NPs for 24 h.
MSP analysis and RT-PCR
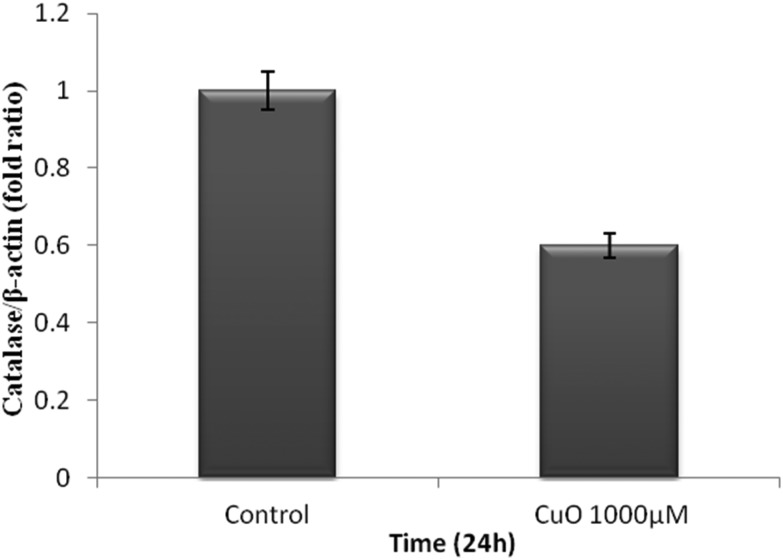
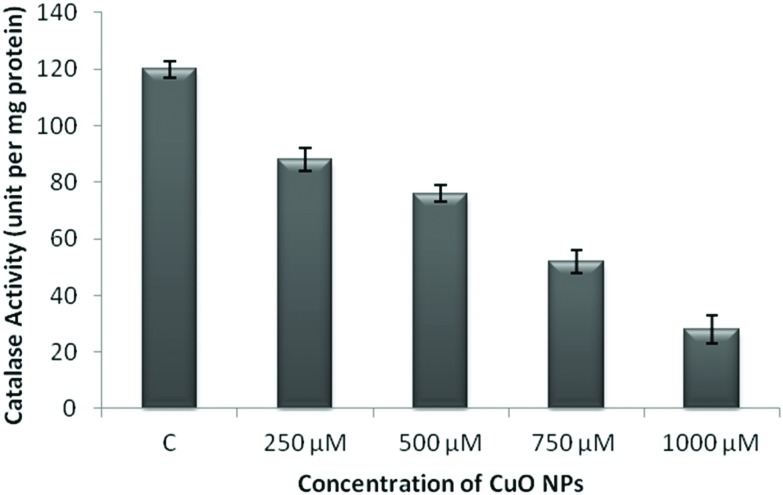
The WRL-68 cells were treated with 1000 μM CuO NPs for 24 h. The effect of the ROS generated by the CuO NPs on the methylation status of the catalase promoter was analyzed using MSP analysis (Fig. 5). We specifically selected the CpG island II region located in the catalase promoter. The methylation of CpG island II was observed at 24 h. RT-PCR was performed within the same cells and demonstrated that messenger RNA (mRNA) (Fig. 6) expression was also found to be reduced as compared to that of the control. The catalase enzyme activity was determined in order to validate the results obtained from RT-PCR. Fig. 7 shows a decrease in the activity of the catalase enzyme with an increase in the concentration of CuO NPs.
Fig. 5. Methylation status of the catalase promoter in the WRL-68 human hepatic cell lines. The WRL-68 cells were treated with 1000 μM CuO for 24 h, after which MSP was performed using genomic DNA isolated from these cells. The genomic DNA was isolated after serum starvation from the WRL-68 human hepatic cell lines. PCR was performed with primers specifically designed to amplify the DNA sequence of the catalase promoter CpG island II; SM, size marker; U, unmethylated (control) DNA; M, methylated DNA.

Fig. 6. Effect of the CuO NPs on mRNA expression in the WRL-68 cell lines. mRNA expression was assessed by RT-PCR. The experiments were performed in triplicate and the data were expressed as the mean of three independent experiments. The P value was calculated, which was >0.05.
Fig. 7. Catalase activity in the WRL-68 cell lines on exposure to the CuO NPs. The catalase activity was measured using cell lysates of the cells. The WRL-68 cells were exposed to concentrations of 250 μM, 500 μM, 750 μM, and 1000 μM of CuO NPs for 24 h. The experiments were performed in triplicate and the data were expressed as the mean of three independent experiments.
Effect of CuO NPs exposure on proliferation of WRL-68 cells
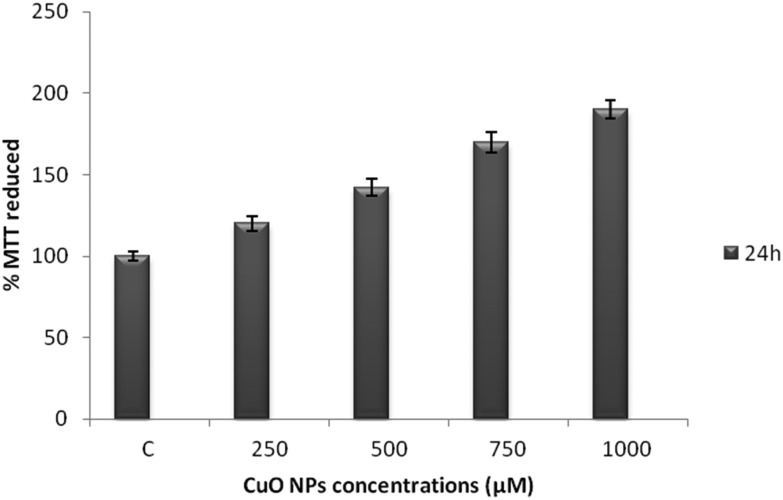
The epigenetic regulation of an antioxidant enzyme may subsequently result in an increase in cell proliferation.16 The proliferation of the WRL-68 cells was found to increase with an increase in the concentration of the CuO NPs as shown inFig. 8.
Fig. 8. Effect of the CuO NPs on cell proliferation. The WRL-68 cells were exposed to concentrations of 250 μM, 500 μM, 750 μM, and 1000 μM CuO NPs for 24 h. The experiments were performed in triplicate and the data were expressed as the mean of the three independent experiments.
Discussion
Copper constitutes an important class of environmental contaminants that have been known to influence gene expression by either binding directly in the target gene promoters or via ROS. Recent research suggests that copper can also influence gene expression through epigenetic mechanisms; this adds a new twist to the complexity of metal-mediated gene expression.17 It was reported that SiO2 NPs may induce epigenetic effects in HaCaT cells. Moreover, epigenetic effects of AuNPs have also been observed in maternally exposed fetal lungs. Similar epigenetic effects of Fe2O3NPs, cadmium telluride quantum dots (CdTe QDs) and multi-wall carbon nanotubes (MW-CNTs) in treated in vivo tissue were also reported.18
Here, we showed that the ROS generated by CuO NPs may down regulate the expression of catalase at the transcriptional level in the WRL-68 cells. We have determined that 417.75 percent of ROS was generated with 1000 μM CuO NPs. We thus confirmed that exposure to ROS generated by the CuO NPs is significantly associated with the catalase downregulation and the methylation of the catalase promoter in the WRL-68 cells. Moreover, we also reported that HEp-2 cells exhibited reduced catalase enzyme activity and also blocked the cellular antioxidant defences on exposure to the CuO NPs.19 The CuO NPs may also induce apoptosis via the ROS (Siddiqui et al., 2013; Pereira et al., 2016). Lu et al. (2016) have suggested that exposure of CuO NPs at doses of 0.5 and 30 μg mL–1 for 24 h may lead to the epigenetic alteration of LINE-1 and Alu/SINE, in human small airway epithelial cells (SAEC) via ROS.6,20,21 These studies have supported our finding that differences in ROS generation may correlate with the decreased expression of catalase enzyme and an increase in cell proliferation. Downregulation of catalase can result in inhibition of the defence mechanism of a WRL-68 cell.22 We can assume that the greater the increase in ROS stress, the more extensive the methylation of the catalase promoter. Many studies have shown that catalase expression may be regulated by aberrant methylation during the progression of tumors and that catalase activity is attenuated during malignant progression.23,24 It is well known that there is an epigenetic relationship between ROS and the methylation status of the catalase promoter in tumor tissues. In the present study, we confirmed this relationship in normal human hepatic WRL-68 cell lines. Moreover, this is the first study to validate that ROS generated by CuO NPs are the cause for methylation of the catalase promoter in cases of human WRL-68 cells. It was reported that 3.3% of the catalase promoter sequence is hypermethylated by the ROS in HCC. The discrepancy in the methylation status may vary depending upon the promoter sites (Ding et al., 2004).24 The study also suggests that the methylation of CpG island II interferes with the binding of transcriptional activators to the promoter, thereby reducing the level of transcription. Several transcriptional activators bind to the catalase promoter.25 This finding implies that the cells probably lose their defense mechanism against ROS, which facilitates the progression of cancer. Due to the reduced capacity to eliminate ROS, the ROS levels are increased. This process is accompanied by significant intracellular changes, such as reduction in the E-cadherin levels.25 In this study, we did not investigate whether ROS directly caused methylation of the catalase promoter in the WRL-68 cells. Further studies should focus on identifying the putative ROS-mediated pathway that affects DNA methylation. Nevertheless, our results strongly suggest that ROS affect the methylation status of the catalase promoter during carcinogenesis. Thus, we propose the presence of a functional pathway involving ROS-induced epigenetic changes by the CuO NPs in which persistently elevated levels of ROS induce methylation of the CpG island II of the catalase promoter in the WRL-68 cells. These observations point towards the need to understand the molecular mechanism involved in chronic exposure to CuO NPs and develop more refined tools to propagate safe copper based nanoproducts.
Conflict of interest
There are no conflicts of interest to declare.
Supplementary Material
Acknowledgments
The authors sincerely acknowledge ICMR, New Delhi, India, and the Centre for Nanotechnology Research and Applications, GICT for financial support. The DBLS manuscript number is DBLS 68.
Footnotes
†Electronic supplementary information (ESI) available. See DOI: 10.1039/c6tx00416d
References
- Szymański P., Frączek T., Markowicz M., Mikiciuk-Olasik E. BioMetals. 2012;25:1089–1112. doi: 10.1007/s10534-012-9578-y. [DOI] [PMC free article] [PubMed] [Google Scholar]
- Yao Y., Costa M. J. Mol. Genet. Med. 2013;7:86. [Google Scholar]
- Sandstead H. H. Am. J. Clin. Nutr. 1995;61:621S–624S. doi: 10.1093/ajcn/61.3.621S. [DOI] [PubMed] [Google Scholar]
- Heinlaan M., Ivask A., Blinova I., Dubourguierb H. C., Kahr A. Chemosphere. 2008;71:1308–1316. doi: 10.1016/j.chemosphere.2007.11.047. [DOI] [PubMed] [Google Scholar]
- Karlsson H. L., Gustafsson J., Cronholm P., Moller L. Toxicol. Lett. 2009;188:112–118. doi: 10.1016/j.toxlet.2009.03.014. [DOI] [PubMed] [Google Scholar]
- Siddiqui M. A., Alhadlaq H. A., Ahmad J., Al-Khedhairy A. A., Musarrat J., Ahamed M. PLoS One. 2013;5:e69534. doi: 10.1371/journal.pone.0069534. [DOI] [PMC free article] [PubMed] [Google Scholar]
- Akhtar M. J., Kumar S., Alhadlaq H. A., Alrokayan S. A., Abu-Salah K. M., Ahamed M. Toxicol. Ind. Health. 2016;32:809–821. doi: 10.1177/0748233713511512. [DOI] [PubMed] [Google Scholar]
- Sun T., Yan Y., Zhao Y., Guo F., Jiang C. PLoS One. 2012;7:e43442. doi: 10.1371/journal.pone.0043442. [DOI] [PMC free article] [PubMed] [Google Scholar]
- Gupta A., Butts B., Kwei K. A., Dvorakova K., Stratton S. P., Briehl M. M., Bowden G. T. Cancer Lett. 2001;173:115–125. doi: 10.1016/s0304-3835(01)00656-5. [DOI] [PubMed] [Google Scholar]
- Zhu W. G., Srinivasan K., Dai Z. Mol. Cell. Biol. 2003;23:4056–4065. doi: 10.1128/MCB.23.12.4056-4065.2003. [DOI] [PMC free article] [PubMed] [Google Scholar]
- Suzuki T., Park H., Lennarz W. J. FASEB J. 2002;16:635–641. doi: 10.1096/fj.01-0889rev. [DOI] [PubMed] [Google Scholar]
- Zhao J., Wang Z., Liu X., Xie X., Zhang K., Xing B. J. Hazard. Mater. 2011;15:304–310. doi: 10.1016/j.jhazmat.2011.09.094. [DOI] [PubMed] [Google Scholar]
- Aebi H. Methods Enzymol. 1984;105:121–126. doi: 10.1016/s0076-6879(84)05016-3. [DOI] [PubMed] [Google Scholar]
- Mosmann T. J. Immunol. Methods. 1983;16:55–63. doi: 10.1016/0022-1759(83)90303-4. [DOI] [PubMed] [Google Scholar]
- Sedaghat S., Shameli K., Shahbazi S. Int. J. Bio-Inorg. Hybd. Nanomat. 2014;3:11–16. [Google Scholar]
- Cheng T. F., Choudhuri S., Muldoon-Jacobs K. J. Appl. Toxicol. 2012;32:643–653. doi: 10.1002/jat.2717. [DOI] [PubMed] [Google Scholar]
- Mytych J., Wnuk M. J. Biomater. Nanobiotechnol. 2013;4:53–63. [Google Scholar]
- Fahmy B., Cormier S. A. Toxicol. In Vitro. 2009;23:1365–1371. doi: 10.1016/j.tiv.2009.08.005. [DOI] [PMC free article] [PubMed] [Google Scholar]
- Pereira T. C., Campos M. M., Bogo M. R. J. Appl. Toxicol. 2016;36:876–885. doi: 10.1002/jat.3303. [DOI] [PubMed] [Google Scholar]
- Lu X., Miousse I. R., Pirela S. V., Melnyk S., Koturbash I., Demokritou P. Nanotoxicology. 2016;10:140–150. doi: 10.3109/17435390.2015.1025115. [DOI] [PMC free article] [PubMed] [Google Scholar]
- Lim S. O., Gu J. M., Kim M. S. Gastroenterology. 2008;135:2128–2140. doi: 10.1053/j.gastro.2008.07.027. [DOI] [PubMed] [Google Scholar]
- Kwei K. A., Finch J. S., Thompson E. J., Bowden G. T. Neoplasia. 2004;6:440–448. doi: 10.1593/neo.04127. [DOI] [PMC free article] [PubMed] [Google Scholar]
- Sato K., Ito K., Kohara H., Yamaguchi Y., Adachi K., Endo H. Mol. Cell. Biol. 1992;12:2525–2533. doi: 10.1128/mcb.12.6.2525. [DOI] [PMC free article] [PubMed] [Google Scholar]
- Ding S., Gong B. D., Yu J., Gu J., Zhang H. Y., Shang Z. B., Fei Q., Wang P., Zhu J. D. World J. Gastroenterol. 2004;10:3433–3440. doi: 10.3748/wjg.v10.i23.3433. [DOI] [PMC free article] [PubMed] [Google Scholar]
- Nenoi M., Ichimura S., Mita K., Yukawa O., Cartwright I. L. Cancer Res. 2001;61:5885–5894. [PubMed] [Google Scholar]
Associated Data
This section collects any data citations, data availability statements, or supplementary materials included in this article.


