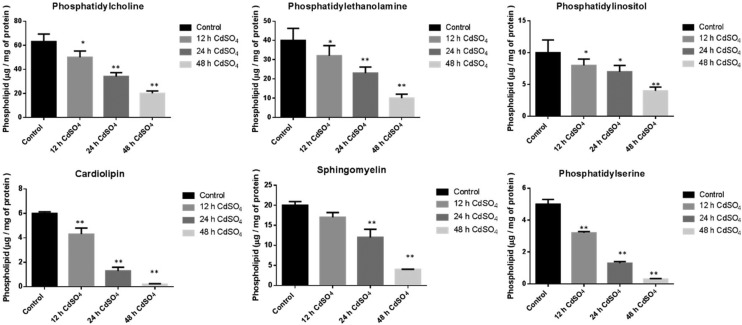
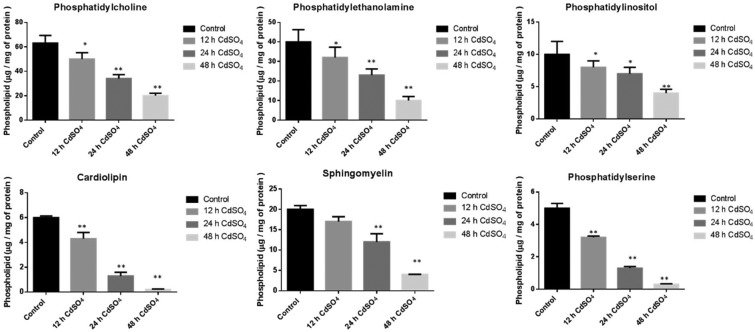
 Cadmium exposure significantly reduced Phospholipids in a time dependent manner.
Abstract
Cadmium (Cd) is a heavy metal that has received considerable environmental and occupational concern. Cd causes toxic effects due to its accumulation in a variety of tissues, including the kidney, liver and the nervous system (CNS); however, the exact mechanism is poorly understood. In the present study, we tried to explore the impact of acute cadmium exposure on rat brain phospholipids (PLs). Cd exposure significantly reduced PLs in a time dependent manner and the reduction was due to the activation of the Phospholipase A2 enzymes (sPLA2, cPLA2). The release of arachidonic acid from PLs increased during inflammatory conditions by PLA2s. The mRNA expression of cyclooxygenase2 (COX2) and subsequently the pro-inflammatory cytokines, namely, Interleukin 1 (IL-1) and IL-6, were up regulated; however, the expression of anti-inflammatory cytokine IL-10 was reduced in a time dependent manner. The expression of the Tumor necrosis factor alpha (TNF-α), Inducible nitric oxide synthase (iNOS) and Interferon gamma (INF-γ) also experienced increases in the expression. Likewise the mRNA expression of the pro-apoptotic factor, Bcl-2-associated X protein (Bax), was elevated, whereas anti-apoptosis B-cell lymphoma 2 (Bcl2) was down regulated. This present study might help to decipher the effects of cadmium toxicity on rat brain.
1. Introduction
Cadmium is a toxic-heavy metal that accumulates in the environment due to anthropogenic factors. The acute exposure of cadmium produced toxic effects in various organs such as the brain, lungs, liver and testes, whereas chronic exposure resulted in anemia, osteoporosis, renal dysfunction and bone fracture.1,2 Clinical data have shown that cadmium exposure causes neurological disorders such as learning disabilities and hyperactivity in children,3,4 olfactory dysfunction, defects in attention and neurobehavioral defects.3,5 There is increasing evidence to demonstrate that Cd is a potential etiological element in neurodegenerative diseases such as Alzheimer's disease, amyotrophic lateral sclerosis and Parkinson's disease.
The brain is the most lipid-rich organ in the body with gray matter containing 40% lipid (as % of dry weight) and white matter contains 65% lipid, largely reflecting myelin enrichment which itself is 78% lipid.6–8 The brain functioning depends on lipid homeostasis. The lipids in the brain are altered during several neurological disorders, including schizophrenia, bipolar disorders, neurodegenerative diseases such as Huntington diseases, Alzheimer's, Parkinson's, and Niemann-Pick.9 Alternation of lipid metabolism was suggested to be involved in the development of Alzheimer's disease (AD),10–12 and phospholipids13–15 play an important role in the interaction of Aβ and the lipid membrane under pathogenesis of AD. In addition, it has been shown that Aβ modulates cholesterol metabolism in the plasma membrane. These lines of evidence indicate that Aβ interacts with the neuronal membrane, preferentially with cholesterol, disrupting its lipid environment, leading to neuronal dysfunction and death.
Full-fledged functioning of the brain mitochondria depends on its phospholipid composition. The brain mitochondrial membrane has an asymmetrical distribution of phospholipids. These phospholipids contain a high content of polyunsaturated fatty acids (PUFAs).16 The neuronal tissues are enriched with phospholipids that are composed of long PUFAs, mainly docosahexaenoic acid (DHA) and arachidonic acid (AA). The neuronal synapses have a peak concentration of PUFAs, mainly AA and DHA,17 and are involved in phospholipid-mediated signal transduction. Adrenic and oleic acid concentrations are higher in the myelin sheath. During myelinogenesis in the brain, plasmalogens are the major lipids.18 The brain contains a highly diversified composition of molecular species of phospholipids and also the mitochondria-specific phospholipid, cardiolipin (CL). The peroxidation of this cardiolipin yields a diverse range of oxygenated CL products, resulting in neuronal death.19
Phospholipid activities are dependent on acyltransferases and phospholipases. In the current study, we focused on phospholipases. These proteins are soluble, extracellular enzymes that have a high disulfide content, low molecular mass (∼14 kDa) and require milli molar levels of Ca2+ for catalytic activities.20,21 The phospholipase A2 hydrolyses the membrane glycerophospholipids at the sn-2 position, liberating lysophospholipids and free fatty acids.22 Reported evidence has shown that there are 26 genes that encode various types of PLA2 and are classified based on their biochemical characteristics, properties, sub cellular distributions and functions.23–25 These have also been identified in humans. Phospholipases A2 (PLA2s) are ubiquitous in nature and have a vital role in numerous biological processes such as membrane remodeling, regulation of lipid metabolism and signal transduction.24 They also generate pro inflammatory lipid mediators such as prostaglandins and leukotrienes.26 Overproduction of the lipid mediators result in various diseases and tissue disorders, and it is important to understand the functions of PLA2 during Cd exposure.
Brain toxicity and the dependence of phospholipids and phospholipases are reported; however, the exact phospholipid mediated molecular mechanisms are yet to be elucidated. Our study focuses on Cd-induced PLA2 alterations and its effect on pro-inflammatory cytokines in rat brains.
2. Materials and methods
Chemicals
Cadmium sulfate (HPLC grade) was obtained from M/S Merck specialties Private Limited, Mumbai, India. Combined analytical data indicated a purity of greater than 99%. All chemicals used in this study were of analytical grade.
Animals
Male albino rats of the Wistar strain, 150–200 g of body weight, were purchased from the Central Animal Facility, Indian Institute of Science, Bangalore, India, and housed under hygienic and standard environmental conditions (temperature: 24 ± 1 °C, light/dark cycle: 12/12 h) in the animal house of Bharathidasan University, Tiruchirappalli, India. The rats were fed with a standard pellet diet (Sai Durga Feeds, Bangalore, India) and water ad libitum. Experimental animals were used after obtaining prior permission from the University and Institutional legislation as regulated by the committee for the Purpose of Control and Supervision of Experiments on Animals (CPCSEA), the Ministry of Social Justice and Empowerment, and the Government of India (BDU/IAEC/2014/NE/06/Dt.18.03.2014).
Experimental design
After the acclimatizing period, animals were randomly divided into four different groups of 3 animals each. Cadmium sulfate was administered intra-peritoneal (i.p.). The first group (Group 1) served as a control and received physiological saline via i.p. Group 2, Group 3 and Group 4 were injected with CdSO4 at a dose level of 3 mg per kg body weight 12, 24 and 48 h, respectively, prior to experimental sacrifice.27 CdSO4 was administered in the morning to non-fasted rats. Before sacrificing, the animals were fasted overnight and euthanized under anesthesia. After 12, 24 and 48 h of CdSO4 administration, the animals were euthanized and brain samples were collected.
Extraction and separation of lipids from brain mitochondria
The total lipids were extracted from the mitochondria according to Folch et al., (1957).28 Briefly, mitochondria was minced with 10 ml of chloroform/methanol (2 : 1, v/v) and vortexed vigorously. The homogenate was centrifuged at 10 000 rpm for 10 minutes. To the removed organic phase, 0.2 ml of acidified water (0.02% phosphoric acid) was added and vortexed vigorously. Chloroform extracts containing total lipids were evaporated to dryness under reduced pressure, dissolved in the required volume of chloroform and subjected to thin layer chromatography (Silica gel G, Merck). The plate was developed with chloroform/methanol/acetone/acetic acid/water (50 : 10 : 20 : 15 : 5 v/v) solvent system. Each spot was located by brief staining with iodine vapor, scraped into a clean glass test tube and the amount of inorganic phosphorous was determined. Neutral lipids were separated using a different solvent system, i.e., petroleum ether : diethyl ether : acetic acid (70 : 30 : 1).
Determination of phosphorus from phospholipid
The mass of phospholipids separated by TLC was quantified using the method of Rouser et al., 1970.29 The scraped spots were digested with 0.65 ml of 70% perchloric acid in a borosilicate glass tube at 180 °C for 1 h. After digestion, 3.3 ml of distilled water, 0.5 ml of 2.5% ammonium molybdate solution, and 0.5 ml of 10% ascorbic acid were added to the tube. The tubes were heated in a boiling water bath for 10 min and then centrifuged at 2000 rpm for 10 min. The samples were transferred to a cuvette and the optical density was read at 800 nm.
Isolation of RNA
RNA was isolated by the Trizol method (BRL) according to the protocol from the manufacturer. Briefly, 50–100 mg of brain tissue was added to 1 ml Trizol and mixed well. The tissue was minced with the help of a polytron, and lysates were suspended several times by passing through a pipette. Chloroform (0.2 ml) was added, and the samples were shaken vigorously for 15 s and maintained at room temperature (RT) for 15 min. Then, the mixture was centrifuged at 12 000g for 15 min at 4 °C. The aqueous phase was transferred to a fresh tube, and isopropanol (0.5 ml) was added, mixed and incubated at room temperature for 10 min. RNA was pelleted by centrifugation, washed with ethanol (75%), pelleted, air dried and suspended in DEPC-treated water and its concentration was determined by spectrophotometry at A260.
Reverse transcriptase polymerase chain reaction
The synthesis of cDNA was performed using the total RNA obtained from the brain tissue. Gene specific primers were used for amplification of the sPLA2-II A, sPLA2-V, cPLA2α, iPLA2α and β-Actin cDNA (primer list in Table 1). PCR was subjected to 30 cycles at 94 °C for 30 s, 60° for 30 s (for sPLA2-V 62 °C for 30 s) and 72 °C for 30 s, followed by a final extension cycle at 72 °C for 5 min. The RT-PCR products were analyzed by 2% agarose gel electrophoresis. To ensure RNA quality, all preparations were subjected to analysis for β-Actin expression. The semi quantitatively analyzed RT-PCR results were scanned for gel images and the intensity of each PCR product was measured using BIO-RAD quantity one software version 4.6.9.30 gel documentation.
Table 1. List of primer sequence using RT-PCR analysis.
| S. no. | Gene name | Primer sequence |
| 1 | PLA2 G-II | FW-5′ ATG AAG GTC CTC CTG TTG CTA G 3′ |
| RW-5′ TCA GCA ACT GGG CGT CTT CCC TT 3′ | ||
| 2 | PLA2 G-IV | FW-5′ AGTGGTTCTACGTGCCACCA 3′ |
| RW-5′ GTACCATGTGGAGCCGGACA 3′ | ||
| 3 | PLA2 G-V | FW-5′ ATG AAG CGC CTC CTC ACG CTG 3′ |
| RW-5′ AGA GGA AGG CAG ATC CAA GAC CT 3′ | ||
| 4 | PLA2 G-VI | FW-5′ CAGCACCTGACGGACCTCAT 3′ |
| RW-5′ ACGTCACAGCCCCTCTTCAG 3′ | ||
| 5 | COX2 | FW-5′ GCTTGGCTTGTGACTTTGGC 3′ |
| RW-5′ TGTCAGAACCCCCTCCAATTC 3′ | ||
| 6 | IL-1 | FW-5′ TGTCTGACCCATGTGAGCTG 3′ |
| RW-5′ CAGGGAGGGAAACACACGTT 3′ | ||
| 7 | IL-6 | FW-5′ CACTTCACAAGTCGGAGGCT 3′ |
| RW-5′ AGCACACTAGGTTTGCCGAG 3′ | ||
| 8 | IL-10 | FW-5′ GCTCAGCACTGCTATGTTGC 3′ |
| RW-5′ GTAGATGCCGGGTGGTTCAA 3′ | ||
| 9 | TNF-α | FW-5′ CGGCTTCTAAACAAGCCCTTT 3′ |
| RW-5′ CCGGGGTTATGTACGCTTGA 3′ | ||
| 10 | iNOS | FW-5′ ATTCCCAGCCCAACAACACA 3′ |
| RW-5′ TTGGACCACTGAATCCTGCC 3′ | ||
| 11 | INF-γ | FW-5′ GGATCCATGAGTGCTACACG 3′ |
| RW-5′ GGCACACTCTCTACCCCAGA 3′ | ||
| 12 | Bax | FW-5′ AGAGGATGGCTGGGGAGAC 3′ |
| RW-5′ GTGGGCGTCCCGAAGTAG 3′ | ||
| 13 | Bcl2 | FW-5′ GAGGGGCTACGAGTGGGATA 3′ |
| RW-5′ GCATGCTGGGGCCATATAGT 3′ | ||
| 14 | PLD1 | FW-5′ CTGATAGAAAATCTCGACACCCG 3′ |
| RW-5′ AGTTGCTTCCTCCTGCCAAAG 3′ | ||
| 15 | PLD2 | FW-5′ AGGGCTCCTCCCTTGGACTTA 3′ |
| RW-5′ TGCCTCTCGGGCTGGAGAAT 3′ | ||
| 16 | β-Actin | FW-5′ CAT CCA GGC TGT GCT GTC CCT 3′ |
| RW-5′ TGC CAA TAG TGA TGA CCT GGC 3′ |
Western blot analysis
Brain tissue proteins were prepared with help of a lysis buffer (50 mM Tris-HCl, pH 7.4, 150 mM NaCl, 5 mM EDTA, 1 mM PMSF, and protease inhibitor cocktail). Total protein (60 mg) was subjected to SDS-PAGE. For immunoblot analyses, proteins were transferred to a nitrocellulose membrane at 120 V for 2 h and the membrane was incubated with a primary antibody (1 : 1000 dilution) for 2 h, followed by an ALP-conjugated goat anti-rabbit IgG (1 : 2500) for 1 h. The membrane was treated with a BCIP/NBT substrate system. The Image J software was used to quantify the band intensity.
Statistics
Data were analyzed using the programs of the Graph Pad Prism 6.0 software package for Windows. All the values reported in the study were the mean of three replicates. Statistical analysis was carried out by One way ANOVA. Values are statistically significant at ***P < 0.001, **P < 0.01, and *P < 0.05.
3. Results
Effect of cadmium on the mitochondrial phospholipids in the rat brain
The Cd exposed rat brain mitochondrial major phospholipids (PLs) were significantly decreased upon Cd treatment. The levels of phosphatidylcholine (PC = 13%, 46% and 68%), phosphatidylethanolamine (PE = 20%, 42% and 75%), phosphatidylinositol (PI = 20%, 30% and 60%), phosphatidylserine (PS = 36%, 74% and 94%) and sphingomyelin (SM = 15%, 40% and 80%) was decreased in a time dependent manner (12, 24 and 48 h) compared to the control saline treated group. The mitochondrial unique phospholipid cardiolipin, present in the inner mitochondrial membrane (IMM), showed a significant reduction (28%, 78% and 96%) upon Cd treatment (Fig. 1).
Fig. 1. Effect of cadmium on brain mitochondrial phospholipid content: animals were treated with CdSO4 (3 mg per kg body weight) and control animals were treated with normal saline. Lipids were isolated from mitochondria and then extracted and resolved on silica TLC. The phospholipids were separated using chloroform : methanol : ammonia (65 : 25 : 5, v/v) in the first dimension and chloroform : methanol : acetone : acetic acid : water (50 : 10 : 20 : 15 : 5, v/v) in the second dimension. The Rf value of standard phospholipids was used to compare the Rf values of unknown phospholipid spots. All experiments were done independently and performed in triplicates. Cd and saline treated control cells were compared, and data were indicated in mean ± SD, with a statistical significance of *p < 0.05, **p < 0.01.
Cadmium does not affect PC biosynthetic genes in rat brain
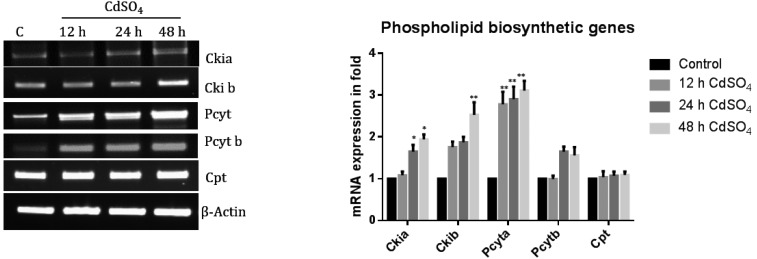
Cadmium treated at different time intervals depicted an up-regulation of the PC biosynthetic genes Cki1a, Cki1b, Pcyta and Pcytb. The CPT gene mRNA expression level was not altered with the cadmium treatment (Fig. 2). Hence, the PC reduction observed was not due to a defect in the PC biosynthesis. PC is major cellular PLs content compare to all other PLs.
Fig. 2. The mRNA expression levels of PC biosynthetic genes in rat brain. The mRNA expression levels of PC biosynthetic genes, namely, Ckia, Ckib, Pcyta, Pcytb and Cpt, were analyzed using Reverse Transcriptase PCR. Gene specific primers were designed used for synthesizing the cDNA. The loading control used was actin. The band intensity was measured by Image one software. The expression was calculated as a ratio (specific gene expression/actin gene expression) to normalize the value. The expression of the wild type cells grown under control conditions was taken as one. Control cells were compared with other groups. The data shown were the mean ± SD from three independent experiments with a statistical significance of **P < 0.01, *P < 0.05.
Reduction of phospholipids is due to enhanced phospholipase A2
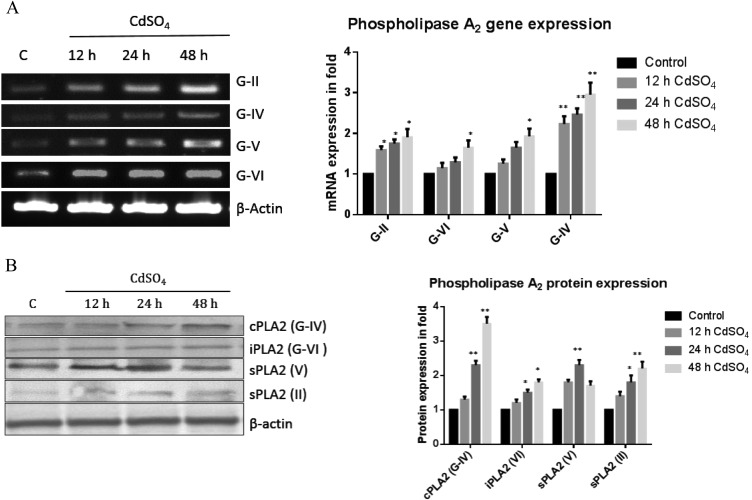
In the present experiment, we also observed an increase in the mRNA expression of PLA2s, namely, G-II (1.5, 1.6 and 1.9), G-IV (1.2, 1.3 and 1.6 fold), G-V (1.2, 1.6 and 1.9 fold) and G-VI (2.1, 2.3 and 3 fold), with Cd exposure compared to the control group (Fig. 3). The expression patterns of a few PLA2s were confirmed by western blot analysis and we found the PLA2 protein expression was up regulated.
Fig. 3. Transcription and translation levels of phospholipase A2. (A) Total RNA was isolated using Trizol reagent and cDNA was constructed using Reverse Transcriptase. Rat phospholipase genes (G-II, IV, V, and VI) were amplified using specific primer sequences. The expression ratio of the specific genes/actin under control conditions was taken as one. (B) The protein expression was studied for the phospholipases A2 (cPLA2, iPLA2, sPLA2 (II)) and sPLA2 (IV) using a specific primary antibody (1 : 500). The band intensity was measured by the Image one software. The data shown were mean ± SD from six independent experiments each conducted in triplicates. Control cells were compared with other groups with a statistical significance of *p < 0.05 and **p < 0.01.
Phospholipid reduction is not due to PLD activation under cadmium exposure
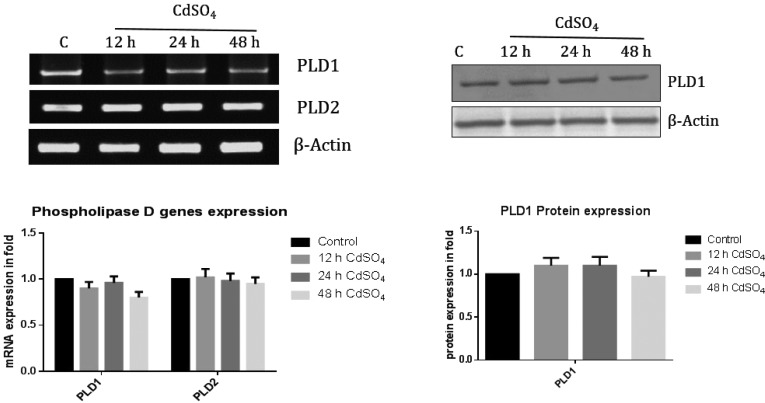
The mRNA expression of PLD1 and PLD2 was not altered under cadmium exposure at different time points (Fig. 4) and was further confirmed by protein expression. Therefore, we strongly confirm that the reduction of PL content is due to activation of PLA2.
Fig. 4. The mRNA and protein levels of phospholipase D. Total RNA was isolated using Trizol reagent and cDNA was constructed by using Reverse Transcriptase. Rat phospholipase D genes (D1 and D2) were amplified using specific primer sequences. Expression levels were calculated and the ratio (mRNA expression of specific gene/actin) denoted. Phospholipase D1 specific primary antibody (1 : 500) was used. Band intensity was measured by the Image one software. The data shown were mean ± SD from six independent experiments each conducted in triplicates. Control cells were compared with other groups with a statistical significance of *p < 0.05 and **p < 0.01.
Cyclooxygenase pathway was activated by phospholipase A2 under cadmium toxicity
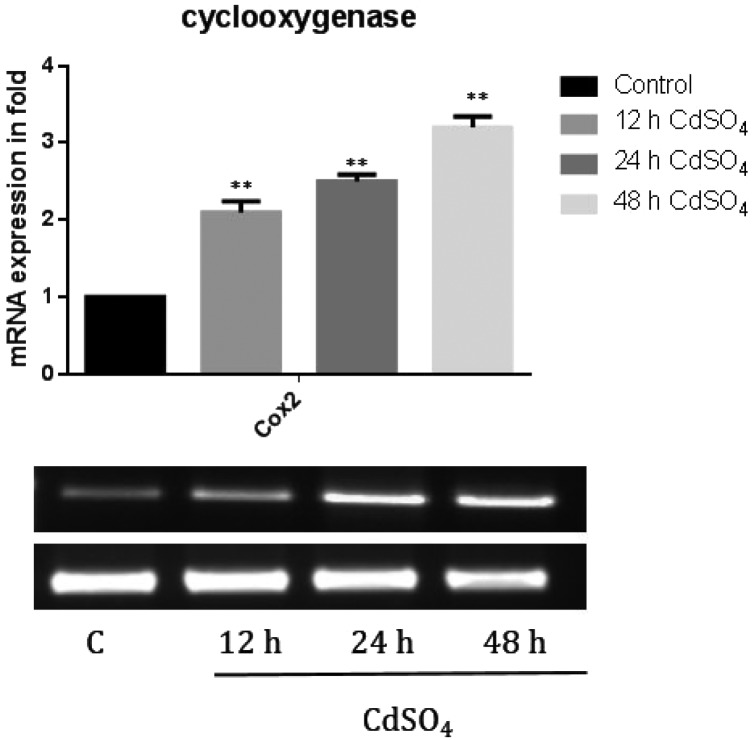
We further analyzed the COX2 mRNA expression. The membrane phospholipids are hydrolyzed at the sn-2 position with the release of unsaturated fatty acids, mainly arachidonic acid (n6, 20:4) that forms eicosanoids. The gene expression of COX-2 (2.1, 2.5 and 3 fold) (Fig. 5) levels was significantly increased in a time dependent manner under cadmium treatment. This induced the mRNA expression of pro inflammatory cytokine, implying its role in inflammation and cell growth regulation.
Fig. 5. The mRNA expression level of cyclooxygenase. Briefly, the total RNA was isolated using Trizol reagent and cDNA was constructed using the Reverse Transcriptase enzyme. The mRNA expression of the cyclooxygenase gene was studied using a semi RT-PCR method. The mRNA expression of COX2 was calculated (mRNA expression of specific gene/actin). The band intensity was measured using the Image one software. The data shown were mean ± SD from six independent experiments. The statistical significance of *p < 0.05 and **p < 0.01 in control cells were compared with other groups.
Gene expression: up-regulation of pro-inflammatory and down regulation of anti-inflammatory
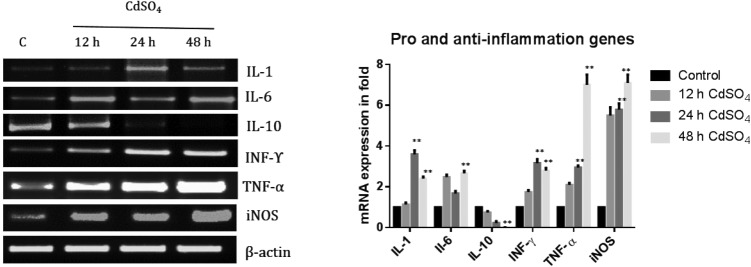
Next, the mRNA expression of the pro-inflammatory genes (IL-1, IL-6, TNF-α, INF-γ and iNOS) and anti-inflammatory gene (IL-10) were analyzed. The mRNA expression increased in the IL-1 (0.4, 2.26 and 1.4 fold) gene, IL-6 (1.4, 0.68 and 1.67 fold) gene, and INF-γ gene (0.74, 2.16 and 1.80 fold), whereas with the TNF-α (1.1, 1.95 and 6 fold) gene and the iNOS gene (4.5, 4.79 and 6.1 fold) (Fig. 6), the increase was in a time dependent manner. The anti-inflammatory cytokine (IL-10) mRNA level was significantly decreased (0.3, 0.7 and 0.9 fold) under cadmium treatment (Fig. 6).
Fig. 6. Effect of Cd on the mRNA expression levels of the pro and anti-inflammatory genes. The total RNA was isolated using Trizol reagent and cDNA was constructed using Reverse Transcriptase. The mRNA expression of pro (IL-1, IL-6, TNF-α, iNOS and INF-γ) and anti-inflammatory genes (IL-10). The rat brains were amplified using specific primer sequences. The gene expression was calculated (mRNA expression of specific gene/actin). The band intensity was measured using the Image one software. The data shown were mean ± SD from six independent experiments. Control cells were compared with other groups with a statistical significance of *p < 0.05 and **p < 0.01.
Brain anti and pro-apoptotic factors were altered under cadmium treatment
The levels of anti-apoptotic factor Bcl-2 were significantly reduced, whereas the pro-apoptotic factor Bax was dramatically increased (Fig. 7) in a time dependent manner under cadmium exposure.
Fig. 7. Anti and pro-apoptotic gene mRNA expression levels. The RNA was isolated and cDNA was constructed by using Reverse Transcriptase. Rat anti (Bcl2) and pro-apoptotic genes (Bax) were amplified using specific primer sequences. Expression was calculated as the ratio of the mRNA expression of a specific gene/actin. The band intensity was measured using Image one software. The data shown were mean ± SD from six independent experiments. Control cells were compared with other groups with a statistical significance of *p < 0.05 and **p < 0.01.
4. Discussion
Cadmium (Cd) is a toxic heavy metal having a long biological half-life and is found in the environment. Industrial and anthropogenic factors lead to an increased level of this non-biodegradable metal in the environment.1 Chronic exposure to Cd leads to renal dysfunction, anemia, osteoporosis, and bone fractures, whereas its acute exposure produced toxicities in the lung, liver, testes, and brain.1,2 Cadmium induced neurotoxicity has been reported; however, its impact on lipid metabolism is yet to be elucidated. Our current study addressed the cadmium induced toxicity on rat brain phospholipids. Cellular membranes are composed of glycerophospholipids [phosphatidylcholine (PC), phosphatidylethanolamine (PE), phosphatidylserine (PS) and phosphatidylinositol (PI)], sphingolipids [sphingomyelin (SM), ceramide and gangliosides], cholesterol and cholesterol esters, acylglycerols, and fatty acids. The phospholipid bilayer and its associated lipids support the membrane-bound proteins for their proper functioning and also act as a permeability barrier.30 Primarily, we investigated the PL profile in the brain, and all the phospholipid contents were significantly decreased upon Cd exposure. PLs play a major role in mitochondrial structure and function. Decreased amounts of PLs may lead to adverse effects on mitochondrial function. Two major group of genes are mainly responsible for alteration of phospholipid metabolism, namely, biosynthesis and degradation pathway genes. Under Cd exposure, the PC biosynthetic genes (Ckia, Ckib, Pcyta and Pcytb) were up-regulated (Fig. 2), indicating that PC reduction was not due to a reduction in biosynthesis. Furthermore, we analyzed the PLA2s to see if the PL reduction was due to the increased degradation by PLA2s under cadmium exposure. Previous reports in our lab have shown that exposure to toxic substances enhanced the phospholipid degradation pathway.27,31,32 Hence, we measured the PL degradation genes, namely, PLA2 and PLD. The PLA2s mRNA and protein expression were significantly increased, particularly the cPLA2 enzyme was increased significantly. cPLA2 is mainly involved in the release of arachidonic acid at the sn-2 position of PLs, and the protein expression was significantly increased. The abovementioned results clearly show that the reduction in PLs is due to the activation of PLA2 upon cadmium exposure in rat brains. Next, we explored the role of PLD in rat brains under cadmium exposure. Two major groups (PLA2 and PLD) are mainly involved in the degradation of PLs. The two mammalian phosphatidylcholine (PC)-selective phospholipases D (PLD) remove the choline head group from PC to produce phosphatidic acid (PA). PA in turn stimulates phosphatidylinositol (4) phosphate 5-kinases, required for certain membrane fusion or fission events. PA is also an important precursor for diacylglycerol (DAG) formation. However, in the current study, the mRNA expression of PLD1 and PLD2 remained unaltered upon Cd exposure. Collectively from the abovementioned results, we conclude that during Cd exposure, the decreased amount of PLs is mainly due to the activation of PLA2 enzymes. From these results, we can strongly conclude that the decrease in PLs is due to enhanced PLA2 pathway activations. PLs have a vital role in maintaining the cellular membrane homeostasis and membrane fluidity. Alteration of PLA2 modifies the PL composition and thereby impact the physical properties (such as fluidity) of cellular membranes. The amyloid precursor protein (APP) is involved in Alzheimer's disease (AD) and is a trans-membrane protein. The membrane composition and the membrane fluidity is of great importance in maintaining its structure and function.32 Several works33–36 have shown that the increased expression of PLA2 activity in the brain and central nervous system can be correlated with the progression of AD. As such, there is a strong consensus of the importance of lipid and glycerophospholipid pathways in AD pathology.37 Alterations in the reaction cascades of PLD enzymes result in aberrant phosphatidic acid (PA) signaling and have been linked to neurodegenerative processes with activation of PLA2-family enzymes by the amyloid beta peptide in neurons, releasing secondary lipid messengers such as AA.38
Non-steroidal anti-inflammatory drugs (NSAIDs) target cyclooxygenases and act on their active site. The enzyme cyclooxygenase-2 (COX-2) is rapidly and transiently up-regulated by a large variety of signals and has implications in pathological conditions such as inflammation and tumor genesis. COX-2 gene expression was up regulated in our study (Fig. 4) under cadmium toxicity in rat brains. COX-2-derived PGE2 is an important pro-inflammatory mediator. The gene expression of pro-inflammatory cytokines IL-1 and IL-6 was dramatically elevated under cadmium exposure (Fig. 5) and the anti-inflammatory gene IL-10 level was reduced in a time dependent manner. There is substantial data from both animal models and clinical studies showing that cytokines IL-1, IL-6 and TNF-α get up-regulated after a stroke. Although the role of cytokines in stroke pathology remains controversial, the majority of studies support their deleterious effects, at least in the early phase of stroke injury. Depending on the concentration, the target cell, the activating signal, and the timing and sequence of action, the function of cytokines decide whether to mediate pro-survival or pro-apoptotic signaling. A number of studies have demonstrated that TNF-α and IL-1 modulate phospholipid and sphingolipid metabolism by up-regulating the degradation pathway enzymes, phospholipases and SMases, and down-regulating biosynthetic related enzymes of phospholipid/sphingolipids. Many studies were conducted in cell lines that were not of CNS origin. The release of AA during ischemia may be one of the initial events that up-regulate cytokine expression.
Based on previous results, next, we planned to study the expression patterns of pro and anti-apoptosis genes. The Bcl2 family (comprising death agonists and antagonists) is important in determining the resistance of a cell to apoptosis. Several signaling pathways are involved during the cytokine mediated cell death, and the exact induction pathway of apoptosis is yet to be elucidated. It is still not clear whether cell death induced by the pro-inflammatory cytokines is due to apoptosis or necrosis or both. In rat brains, the apoptosis gene expression of the BAX level was up-regulated, and the Bcl2 level was down regulated.
Finally, there was a reduction in phospholipid concentration and subsequent increase in the PLA2 expression during Cd toxicity. The activation of COX2 in turn activated the pro-inflammatory cytokines IL1 and IL6 in rat brains during cadmium toxicity. These findings may help us in elucidating the molecular mechanism underlying the brain dysfunction produced during cadmium exposure.
Acknowledgments
The authors would like to thank Dr Natarajaseenivasan, Professor, Department of Microbiology, BDU for generously providing his facility. Financial support was given by the Bharathidasan University (BDU), Tiruchirappalli, and the instrumentation facility by the Department of Science & Technology (DST) under DST-FIST and DST-PURSE programs are also gratefully acknowledged.
References
- Goering P. L., Waalkes M. P., Klaassen C. D. Handb. Exp. Pharmacol. 1995;115:189–213. [Google Scholar]
- Klaassen C. D., Liu J., Choudhuri S. Rev. Pharmacol. Toxicol. 1999;39:267–294. doi: 10.1146/annurev.pharmtox.39.1.267. [DOI] [PubMed] [Google Scholar]
- Baxter L. C., Sparks D. L., Johnson S. C., Lenoski B., Lopez J. E. J. Alzheimer's Dis. 2006;9:253–260. doi: 10.3233/jad-2006-9304. [DOI] [PubMed] [Google Scholar]
- Marlowe M., Cossairt A., Moon C., Errera J., MacNeel A. J. Abnorm. Child Psychol. 1985;13:185–198. doi: 10.1007/BF00910641. [DOI] [PubMed] [Google Scholar]
- Pihl R., Parkes M. Science. 1977;198:204–206. doi: 10.1126/science.905825. [DOI] [PubMed] [Google Scholar]
- Johnson A. C., McNabb A. R., Rossiter R. J. Biochem. J. 1948;43:573–577. doi: 10.1042/bj0430573. [DOI] [PMC free article] [PubMed] [Google Scholar]
- O'Brien J. S., Sampson E. L. J. Lipid Res. 1965;6:537–544. [PubMed] [Google Scholar]
- Sastry P. S. Prog. Lipid Res. 1985;24:69–176. doi: 10.1016/0163-7827(85)90011-6. [DOI] [PubMed] [Google Scholar]
- Adibhatla R. M., Hatcher J. F. Future Lipidol. 2007;2:403–422. doi: 10.2217/17460875.2.4.403. [DOI] [PMC free article] [PubMed] [Google Scholar]
- Corder E. H., Saunders A. M., Strittmatter W. J., Schmechel D. E., Gaskell P. C., Small G. W., Roses A. D., Haines J. L., Pericak-Vance M. A. Science. 1993;261:921–923. doi: 10.1126/science.8346443. [DOI] [PubMed] [Google Scholar]
- Saunders A. M., Strittmatter W. J., Schmechel D., George-Hyslop P. H., PericakVance M. A., Joo S. H., Rosi B. L., Gusella J. F., Crapper-MacLachlan D. R., Alberts M. J., Hulettte C., Crain B., Goldgaber D., Roses A. D. Neurology. 1993;43:1467–1472. doi: 10.1212/wnl.43.8.1467. [DOI] [PubMed] [Google Scholar]
- Strittmatter W. J., Saunders A. M., Schmechel D., Pericak-Vance M., Enghild J., Salvesen G. S., Roses A. D. Proc. Natl. Acad. Sci. U. S. A. 1993;90:1977–1981. doi: 10.1073/pnas.90.5.1977. [DOI] [PMC free article] [PubMed] [Google Scholar]
- Ahyayauch H., Raab M., Busto J. V., Andraka N., Arrondo J. L., Masserini M., Tvaroska I., Goni F. M. Biophys. J. 2012;103:453–463. doi: 10.1016/j.bpj.2012.06.043. [DOI] [PMC free article] [PubMed] [Google Scholar]
- Qiang W., Yau W. M., Schulte J. Biochim. Biophys. Acta. 2015;1848:266–276. doi: 10.1016/j.bbamem.2014.04.011. [DOI] [PubMed] [Google Scholar]
- Terzi E., Holzemann G., Seelig J. J. Mol. Biol. 1995;252:633–642. doi: 10.1006/jmbi.1995.0525. [DOI] [PubMed] [Google Scholar]
- Zerouga M., Jenski L. J., Stillwell W. Biochim. Biophys. Acta. 1995;1236:266–272. doi: 10.1016/0005-2736(95)00058-b. [DOI] [PubMed] [Google Scholar]
- Sun G. Y., Sun A. Y. Biochim. Biophys. Acta. 1972;280:306–315. doi: 10.1016/0005-2760(72)90098-7. [DOI] [PubMed] [Google Scholar]
- MartInez M. Brain Res. 1986;364:220–232. doi: 10.1016/0006-8993(86)90834-6. [DOI] [PubMed] [Google Scholar]
- Paradies G., Petrosillo G., Paradies V., Ruggiero F. M. Free Radicals Biol. Med. 2010;48:1286–1295. doi: 10.1016/j.freeradbiomed.2010.02.020. [DOI] [PubMed] [Google Scholar]
- Dennis E. A. J. Biol. Chem. 1994;269:13,057–13,060. [PubMed] [Google Scholar]
- Verheij H. M., Slotboom A. J., de Haas G. H. Rev. Physiol., Biochem. Pharmacol. 1981;91:92–203. doi: 10.1007/3-540-10961-7_3. [DOI] [PubMed] [Google Scholar]
- Murakami M., Kudo I. Adv. Immunol. 2001;77:163–194. doi: 10.1016/s0065-2776(01)77017-4. [DOI] [PubMed] [Google Scholar]
- Six D. A., Dennis E. A. Biochim. Biophys. Acta. 2000;1488:1–19. doi: 10.1016/s1388-1981(00)00105-0. [DOI] [PubMed] [Google Scholar]
- Schaloske R. H., Dennis E.E. A.A. Biochim. Biophys. Acta. 2006;1761:1246–1259. doi: 10.1016/j.bbalip.2006.07.011. [DOI] [PubMed] [Google Scholar]
- Burke J. R., Davern L. B., Gregor K. R., Owczarczak L. M. Biochem. Biophys. Res. Commun. 1999;260:232–239. doi: 10.1006/bbrc.1999.0887. [DOI] [PubMed] [Google Scholar]
- Glaser J. P. Front Health Serv. Manage. Fall. 1995;12:50–52. [PubMed] [Google Scholar]
- Sivaprakasam C., Nachiappan V. Environ. Toxicol. 2016;10:1176–1184. doi: 10.1002/tox.22124. [DOI] [PubMed] [Google Scholar]
- Folch J. M., Lees M., Sloane Stanley G. H. J. Biol. Chem. 1957;226:497–509. [PubMed] [Google Scholar]
- Rouser G., Fleischer S., Yamamoto A. Lipids. 1970;5:494–496. doi: 10.1007/BF02531316. [DOI] [PubMed] [Google Scholar]
- Sabarirajan J., Vijayaraj P., Mary S., Vasanthi N. J. Appl. Toxicol. 2013;33:418–425. doi: 10.1002/jat.1752. [DOI] [PubMed] [Google Scholar]
- Vijayaraj P., Sivaprakasam C., Vishnu Varthini L., Mary S., Vasanthi N., Maxfield F. R., Tabas I. Toxicol. in Vitro. Nature. 2014;2005;28438:1097–1105. 612–621. doi: 10.1016/j.tiv.2014.05.001. [DOI] [PubMed] [Google Scholar]
- Lee J. C., Simonyi A., Sun A. Y., Sun G. Y. J. Neurochem. 2011;116:813–819. doi: 10.1111/j.1471-4159.2010.07033.x. [DOI] [PMC free article] [PubMed] [Google Scholar]
- Colangelo V., Schurr J., Ball M. J., Pelaez R. P., Bazan N. G., Lukiw W. J. J. Neurosci. Res. 2002;70:462–473. doi: 10.1002/jnr.10351. [DOI] [PubMed] [Google Scholar]
- Gattaz W. F., Cairns N. J., Levy R., Forstl H., Braus D. F., Maras A. Eur. Arch. Psychiatry Clin. Neurosci. 1996;246:129–131. doi: 10.1007/BF02189113. [DOI] [PubMed] [Google Scholar]
- Ross B. M., Moszczynska A., Erlich J., Kish S. J. J. Neurochem. 1998;70:786–793. doi: 10.1046/j.1471-4159.1998.70020786.x. [DOI] [PubMed] [Google Scholar]
- Talbot K., Young R. A., Jolly-Tornetta C., Lee V. M., Trojanowski J. Q., Wolf B. A. Neurochem. Int. 2000;37:17–31. doi: 10.1016/s0197-0186(00)00006-1. [DOI] [PubMed] [Google Scholar]
- Di Paolo G., Kim T. W. Nat. Rev. Neurosci. 2011;12:284–296. doi: 10.1038/nrn3012. [DOI] [PMC free article] [PubMed] [Google Scholar]
- Sanchez-Mejia R. O., Mucke L. Biochim. Biophys. Acta. 2010;1801:784–790. doi: 10.1016/j.bbalip.2010.05.013. [DOI] [PMC free article] [PubMed] [Google Scholar]


