Abstract
The ability to measure the orbital angular momentum (OAM) distribution of vortex light is essential for OAM applications. Although there have been many studies on the measurement of OAM modes, it is difficult to quantitatively and instantaneously measure the power distribution among different OAM modes, let alone measure the phase distribution among them. In this work, we propose an OAM complex spectrum analyzer that enables simultaneous measurements of the power and phase distributions of OAM modes by employing the rotational Doppler effect. The original OAM mode distribution is mapped to an electrical spectrum of beat signals using a photodetector. The power and phase distributions of superimposed OAM beams are successfully retrieved by analyzing the electrical spectrum. We also extend the measurement technique to other spatial modes, such as linear polarization modes. These results represent a new landmark in spatial mode analysis and show great potential for applications in OAM-based systems and optical communication systems with mode-division multiplexing.
Keywords: mode analysis, orbital angular momentum, rotational Doppler effect
Introduction
Vortex light carries orbital angular momentum (OAM) characterized by exp(ilθ), where θ is the angular coordinate and l is the topological charge (TC)1. OAM beams have been widely used in a variety of interesting applications, such as micromanipulation2, 3, probing of the angular velocity of spinning microparticles or objects4, 5, quantum information6, 7 and optical communication8, 9. Obviously, the TC is a basic physical parameter with which to characterize OAM light. The ability to distinguish different OAM modes is essential in an OAM-based optical system. Various interference methods have been developed to convert OAM modes into identifiable intensity patterns, such as holographic detection with plasmonic photodiodes10 and the generation of diffraction patterns using various apertures11, 12, 13, 14, 15. In these schemes, the superposition states of the OAM modes are difficult to distinguish. To distinguish these states, a common approach is to convert the unknown OAM modes into the fundamental mode (TC=0) using a spatial light modulator (SLM) and then to calculate the power ratio of each mode after mode filtering16, 17, 18. This approach requires the power of each OAM mode to be measured one by one or requires the use of multiple photodetectors, and thus, it is either time consuming or cumbersome. Another common approach is to sort the superposition states into different spatial locations, using methods such as a transformation from Cartesian to log-polar coordinates19, 20, 21, 22 or interferometric methods based on a rotation device23, 24, 25. These techniques require photodetector arrays to detect the separated OAM states, and it is difficult to measure a large number of superposition states within a finite diffraction space. Some progress has also been made in measuring the power spectrum by mapping the OAM spectrum into the time domain26, 27, 28, but the measured range and phase detection capabilities are limited. In light of the shortcomings of the state-of-the-art measurement techniques, it is desirable to develop an OAM complex spectrum analyzer that enables instantaneous and accurate measurements of the OAM mode distribution of light, similar to the function of an optical spectrum analyzer in characterizing a frequency distribution. An OAM complex spectrum analyzer is defined as a device that can simultaneously measure the power and phase distributions of OAM components. In 2014, the complex probability amplitudes of OAM states were successfully measured at the single-photon level through sequential weak and strong measurements29. However, OAM complex spectrum analyzers for use in classical information systems have received little attention and have yet to be achieved. In recent years, a novel transversal Doppler effect (rotational Doppler effect) associated with the transverse helical phase has been demonstrated, and Doppler velocimetry for rotating objects has been developed based on this effect30. This effect shows great potential for use in developing an OAM complex spectrum analyzer.
In this article, we demonstrate a prototype of an OAM complex spectrum analyzer that employs the rotational Doppler effect. The system consists of unknown input OAM beams, a strong reference light, a spinning object, a mode filter and a photodetector. The original OAM mode distribution is mapped to an electrical spectrum of beat signals detected by the photodetector. The OAM power spectrum is measured with an inherent disturbance signal in the initial measurement. However, this disturbance signal can be fully eliminated via subtraction of the initial measurement from another constant-disturbance measurement. System calibration is also discussed, in which the input modes are mapped to beat signals with unequal efficiencies; meanwhile, the phase distribution of the OAM modes can also be acquired via calibration. Similar to an optical spectrum analyzer, our scheme shows significant potential for use in OAM complex spectral analysis and measurement for OAM-based systems and optical communication systems with mode-division multiplexing.
Materials and methods
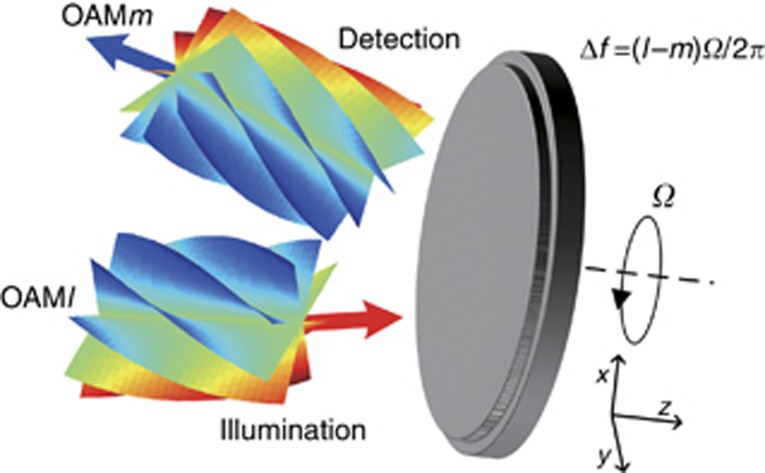
When OAM light illuminates a spinning object with a rotation speed of Ω, as shown in Figure 1, the scattered light will exhibit a frequency shift that is related to the change in TC. The reduced Doppler shift is given by4
Figure 1.
Schematic diagram of the rotational Doppler effect. When an OAM mode illuminates a spinning object, the scattered light experiences a frequency shift.
where l is the TC of the incident light and m is the TC of the scattered light. To maintain the conservation of angular momentum, the spinning object should have a helical phase component of exp[i(m − l)θ] (ref. 31). Equation (1) suggests that the reduced frequency shift depends on the TCs of the incident and scattered light and on the rotation speed. In other words, we can retrieve information regarding the OAM modes of the incident light by measuring the frequency shift of the scattered light at a certain rotation speed. This step is key to realizing an OAM complex spectrum analyzer. In our recent work31, we proposed a model to sufficiently investigate the optical rotational Doppler effect based on a modal expansion method. Here, we present a simple derivation based on this model to explain how the effect can be used to measure the OAM complex spectrum. For simplicity, we ignore the difference along the radial direction; thus, the modulation function of the spinning object can be expressed in the form of a Fourier expansion as follows:
where n is an integer index and t denotes the time. Assume that the input light consists of numerous unknown OAM modes expressed as  , whose TCs range from l1 to lN, where f is the frequency of the light and Bs is the complex amplitude of the corresponding mode. We introduce a reference light, expressed as γB0exp(−i2πft)exp(il0θ), that illuminates the spinning object simultaneously with the input light, where γ is a parameter that is used to tune the power of the reference light. The light scattered by the spinning object can be deduced as follows:
 |
From Equation (3), we can see that all of the incident modes are converted by the spinning objects into a series of identical OAM modes that experience different Doppler frequency shifts, which vary linearly with respect to the TCs of the incident modes. After transmission over a certain distance, only one OAM mode (assume that this mode is OAMm; in general, it is OAM0) is selected via mode filtering and is then collected by a photodetector. Because of the beat effect, the collected temporal intensity can be derived as
 |
where  . The collected intensity expressed in Equation (4) consists of three terms, namely, a direct current term, cross-beat signals among the input modes (called the disturbance signal in a real measurement), and beat signals between the input light and the reference light. If the power of the reference light is much greater than that of the input light, the disturbance signal can be ignored. Hence, the alternating current (AC) intensity can be approximately expressed as
 |
If lp − l0 (p = 1, 2,…N) does not change in sign, then there is a one-to-one mapping between the OAM modes and the frequencies; the coefficients are related to the corresponding complex amplitudes, and thus, a type of OAM mode analyzer can be designed. If all coefficients An and B0 are known, then the OAM complex spectrum can be obtained through spectral analysis. Note that  is a value calculated by means of a complex integral when considering the difference along the radial direction and is not equal to the phase of the input OAM mode. Luckily,
  always has a fixed deviation relative to one of the input OAM modes, which can be calibrated by means of a pre-measurement; thus, the phase distribution of the input OAM modes can also be retrieved via system calibration.
In a real system, the disturbance signal will introduce some measurement errors regardless of its magnitude. In fact, the disturbance signal from the cross terms can be removed by changing the power of the reference light and then repeating the measurement. The subtraction of the AC signals in such a double measurement is expressed as
 |
Therefore, by performing a measurement using a strong reference light (called the initial measurement), we can measure the OAM power spectrum with an inherent disturbance signal. By then subtracting this initial measurement from another measurement obtained after changing the power of the reference light (called a constant-disturbance measurement), the inherent disturbance signal can be eliminated completely.
To evaluate the measurement accuracy, we define the measurement error as
 |
where {Bs|s = 1, 2,…N} are the theoretical OAM complex spectral components and {Cs|s = 1, 2,…N} are the experimental spectral components.
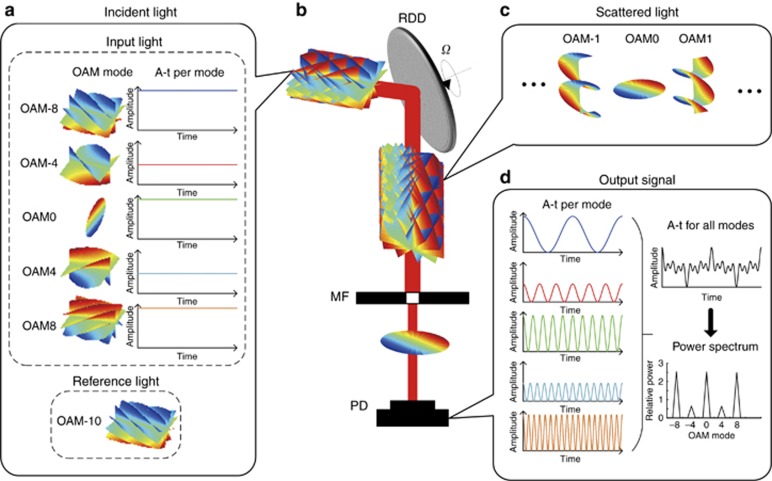
Figure 2b shows a diagram of the proposed OAM complex spectrum analyzer, which consists of the input light to be measured, a strong reference light, a rotational Doppler device, a mode filter and a photodetector. The input light contains numerous unknown OAM modes within a certain finite-dimensional Hilbert space. For simplicity of description, we assume that the TCs of the input OAM modes are within the range of −8 to 8, as shown in Figure 2a. We also introduce a strong coaxial reference light whose TC is outside the range of the TCs of the input OAM light. Here, we assume that the reference light is OAM-10 (TC=−10). When the input modes and the reference mode simultaneously illuminate a spinning object, the modes will experience different Doppler frequency shifts. The scattered light will thus contain many OAM modes, including the fundamental mode (OAM0) and other high-order modes, as illustrated in Figure 2c. The Doppler frequency shift is linear with respect to the input TC because only the fundamental mode is selected by the mode filter. The frequency differences will result in various beat signals, which are detected by the photodetector. The intensity of the reference light is much stronger than that of the input light; thus, the beat signals among the input modes can be ignored, and we need to consider only the beat signals between the input light and the reference light. As shown by the amplitude–time (A–t) curves presented in Figure 2d, OAM-8 and the reference mode OAM-10 will result in a beat signal at twice the speed of rotation. Similarly, the frequencies of the other beat signals will be proportional to the differences in TC between the input modes and the reference mode. Thus, the input OAM modes will be successfully mapped to the beat frequencies, and the amplitude of each beat signal will be proportional to that of the corresponding input OAM mode. Finally, we can obtain the OAM power spectrum through a Fourier transform of the total intensity collected by the photodetector. We should note that because only OAM0 is collected by the photodetector, the overall efficiency of this scheme is quite low. Even so, this drawback does not affect the measurement accuracy because a high-sensitivity photodetector can be used.
Figure 2.
Diagram of the OAM complex spectrum analyzer. (a) The incident light is composed of the input light and a reference light. Input light: the three-dimensional color images represent the spiral phase structures of the OAM modes, and the A–t curves present the dependency of the amplitude on time. Reference light: the reference light is chosen to be an OAM mode that lies outside the range of the input light. (b) Schematic representation of the OAM complex spectrum analyzer. The device consists of three components. A rotational Doppler device is used to realize Doppler shifts based on the rotational Doppler effect, and a mode filter is used to select OAM0. Hence, each mode is converted into OAM0 with a frequency shift that varies linearly with respect to the TC. Each input mode will beat with the strong reference mode, resulting in a beat signal, and the beat frequency will also vary linearly with respect to the TC. A photodetector is employed to measure the beat signals. (c) The scattered light is composed of numerous OAM modes. (d) The output signals are received by the photodetector. The first column presents the beat signals between the reference mode and the various input modes. The beat frequency varies linearly with respect to the TC of the input mode, and the amplitude is proportional to that of the input mode. The total intensity is chaotic, but the power spectrum, which can be obtained through a Fourier transform of the total intensity collected by the photodetector, is consistent with the input OAM power spectrum. MF, mode filter; PD, photodetector; RDD, rotational Doppler device.
Results and discussion
Experimental setup
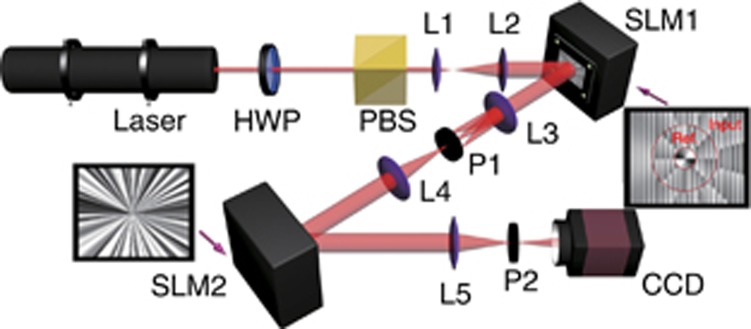
We designed a proof-of-principle experiment to demonstrate the proposed scheme. Figure 3 shows the experimental setup. The light emitted from a He–Ne laser (wavelength of 633 nm) is expanded with two lenses (L1 and L2) and then illuminates SLM1. A half-wave plate and a polarization beam splitter are used to select the horizontal polarization to match the operating polarization of the SLM and to tune the input power. SLM1 is divided into three parts, as shown in the inset. The outer region is fixed and is used to generate the input OAM modes to be measured, the middle region is used to introduce the reference light, and the innermost radius defining the inner region is adjusted to tune the power of the reference light. Only the input light (outer region) and the reference light (middle region) are diffracted to first order by adding a grating in these two areas. The first-order diffracted beam is selected using a pinhole (P1) and then illuminates the spinning object (SLM2). The pattern of SLM2 is rotated to scan the azimuth. Subsequently, the fundamental mode (OAM0) is selected by another pinhole (P2), and then a charge-coupled device (CCD) is used to determine the light intensity. Lenses (L3, L4 and L5) are employed to tune the optical path.
Figure 3.
Experimental setup for the measurement of an OAM complex spectrum. The light emitted from the laser illuminates SLM1 to generate the input light and the reference light, and the first-order diffracted light is then selected using a pinhole (P1). Next, the light is directed onto a spinning object (SLM2), and OAM0 is selected from the scattered light using another pinhole (P2). Finally, a CCD is used to calculate the total light intensity of OAM0.
Measurement of OAM modes
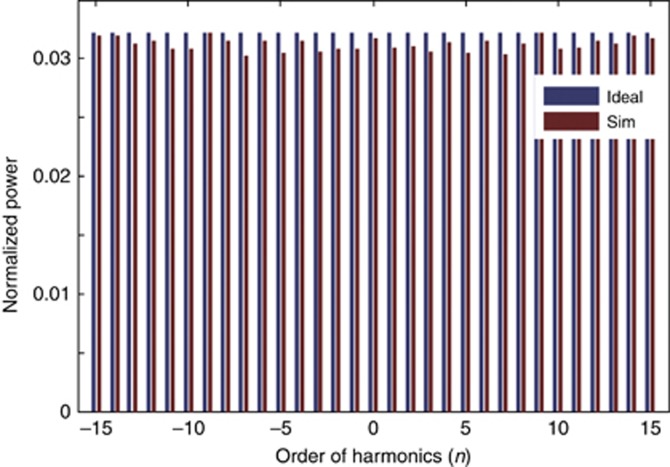
To achieve well-proportioned mapping from the OAM modes to the electrical spectrum, the spinning object characterized by Equation (2) should have a uniform power distribution for each helical phase function. This effect can be implemented using a phase-only element with an iterative algorithm32, 33. Here, an SLM (SLM2) is employed to emulate the spinning object. Assume that the TCs of the input OAM modes are limited to a range of −8 to 8 and that the reference light is chosen to be OAM-10. In this case, for the spinning object, an even Fourier expansion of the modulation function ranging from −15 to 15 satisfies the requirement, as shown in Figure 4. The blue bars represent the ideal power weight of each helical phase component, and the red bars represent the theoretical results obtained using an iterative algorithm. We can see that an approximately even Fourier expansion ranging from −15 to 15 is achieved.
Figure 4.
Fourier harmonic distributions of the spinning object. The blue bars represent the ideal distribution, and the red bars represent the theoretical distribution obtained using an iterative algorithm. Sim, simulation.
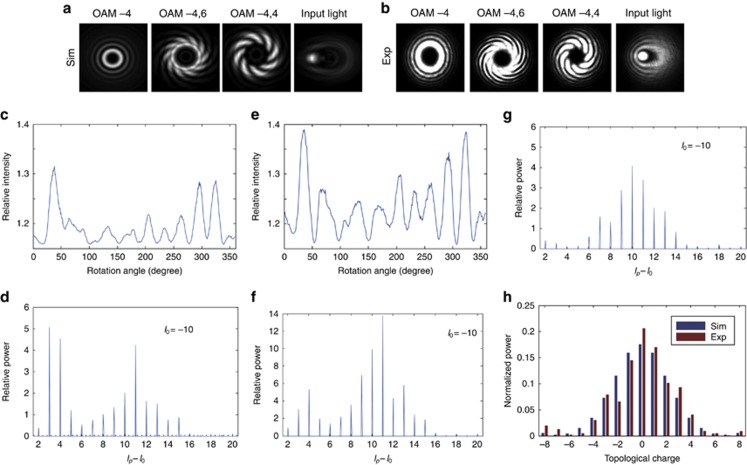
We first measured several patterns of different OAM states. Figure 5a and 5b shows the simulated far-field patterns and experimental results, respectively, for OAM-4, OAM-4 mixed with OAM6, OAM-4 mixed with OAM4 and a Gaussian distribution of OAM modes. The experimental patterns are consistent with the simulated results. In our experiment, we set the OAM mode distribution of the input light to the same Gaussian distribution shown as the blue bars in Figure 5h. In the initial measurement, we ensured that the power of the reference light was higher than that of the input light by tuning the radius of the inner region of SLM1. The intensity determined by the CCD as a function of the rotation angle is shown in Figure 5c. We then calculated the power spectrum by means of a Fourier transform of the periodic signal collected by the CCD, as shown in Figure 5d. We can see that the measured OAM power spectrum is roughly consistent with the theoretical predictions but still exhibits significant deviations, especially in the small-mode region. The measurement errors are 0.077±0.003 (corresponding to a range of 0.074–0.080). The errors primarily arise from the neglected disturbance signal, namely, the cross terms in Equation (5). According to our theoretical model, this disturbance signal can be suppressed by increasing the power of the reference light. In a subsequent constant-disturbance measurement, we increased the power of the reference light by reducing the radius of the inner region of SLM1 to zero; the resulting received intensity and the corresponding power spectrum are shown in Figure 5e and 5f, respectively. The measurement errors are reduced to 0.037±0.001. It is clear that the deviations observed in this measurement are smaller, especially in the small-mode region. This finding demonstrates that the inherent disturbance signal from the cross terms in Equation (5) can indeed be ignored when the power of the reference light is much greater than the power of the input light. More importantly, in theory, the cross terms can be completely removed by subtracting the initial measurement from the constant-disturbance measurement, as shown in Equation (6). The measured power spectrum after intensity subtraction is shown in Figure 5g. As expected, the measurement errors are greatly decreased, to 0.017±0.002, and the deviations are strongly suppressed. The final experimental results and the theoretical predictions of the mode distribution are presented in Figure 5h. One can see that the experimental results agree well with the theoretical predictions.
Figure 5.
Experimental data for the measurement of a Gaussian distribution in the OAM basis. The (a) simulated patterns and (b) experimental results for OAM-4, OAM-4 mixed with OAM6, OAM-4 mixed with OAM4, and a Gaussian distribution of OAM modes. (c, d) The measured intensity over one period and the calculated OAM power spectrum obtained by introducing a reference light with TC=−10; in this case, the inherent disturbance signal from the neglected cross terms is obvious. (e, f) The results obtained after increasing the power of the reference light, which demonstrate that the cross terms can be suppressed by increasing the power of the reference light. (g) The OAM power spectrum obtained from a double measurement. The power spectrum for the double measurement has the lowest observed deviation. (h) The final experimental results compared with the theoretical results. Exp, experiment; Sim, simulation.
System calibration for a general spinning object
Although the measured power spectrum shows good consistency with the expected distribution, we still observe some deviations in Figure 5h, which primarily arise from unequal efficiencies in the conversion of the input modes to beat signals. The characteristics of a spinning object are difficult to precisely determine in practice, and it is also difficult to determine the real phase distribution of the OAM modes without system calibration; hence, an initial system calibration is required. Through system calibration, we can acquire the precise complex amplitude distribution (including both amplitude and phase) of the OAM modes. The calibration procedure is divided into three steps. First, we fix the powers of the reference light and input light and then scan the input OAM modes to measure the complex amplitude of the beat signal between each input mode and the reference mode. The measured complex amplitudes are used as reference data for calibration. Second, we treat the input light as the light to be measured and measure the complex amplitudes of the harmonic signals according to Equations (5) or (6). Finally, the complex amplitude distribution of the input OAM modes is accurately retrieved by dividing the complex amplitudes of the harmonic signals by the reference data.
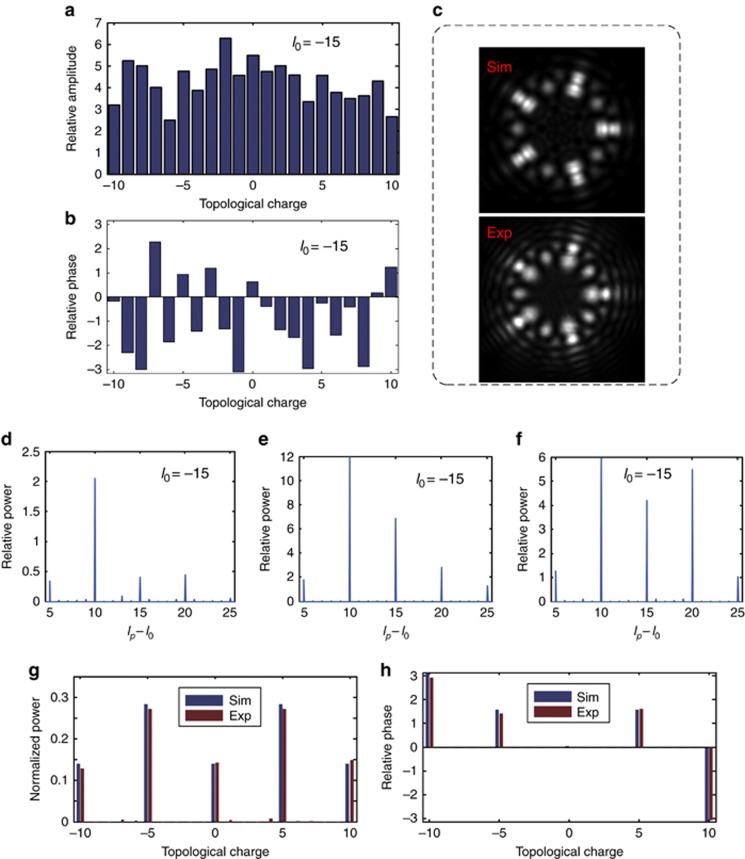
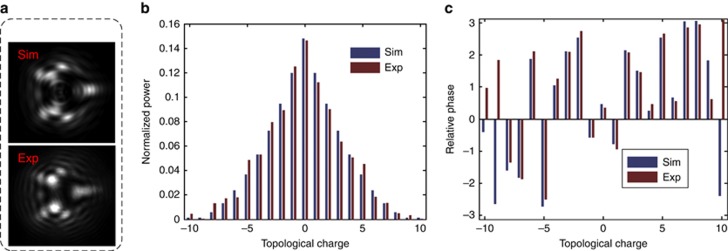
Now, we consider a more general case, in which the efficiency of the conversion of each OAM mode to OAM0 is inconsistent or unknown; here, we must first obtain the complex amplitude of the beat signal between each input OAM mode and the reference mode under the same conditions. Assume that the TCs of the input OAM modes are limited to a range of −10 to 10 and that the reference light is chosen to be OAM-15. First, we hold the power of the input light and reference light constant. Then, we scan the input OAM modes from OAM-10 to OAM10 to obtain the corresponding complex amplitudes of the beat signals. The amplitude and phase distributions of the beat signals between the input OAM modes and the reference mode are shown in Figure 6a and 6b, respectively. One can see that the complex amplitude distribution is complicated; this result arises because the modulation function of the spinning object has a non-uniform harmonic distribution and the phase mapping is unclear. Here, the phase distribution in Figure 6b clearly shows the fixed deviations between  and the phase distribution of the input OAM modes. After obtaining the complex amplitudes, we can begin to measure the OAM complex spectrum. To serve as an example, we designed a simple OAM mode superposition as the input light to be measured. The input modes consist of finite modes (TC=−10, −5, 0, 5, 10), whose initial intensities and phases are set to (1, 2, 1, 2, 1) and (π, π/2, 0, π/2, π), respectively. The simulated and experimental patterns of the input light are presented in Figure 6c. Figure 6d and 6e shows the OAM power spectra measured without and with reference light, respectively, with measurement errors of 0.077±0.002 and 0.068±0.002, respectively. The results in Figure 6d show the power spectrum of the inherent disturbance signal from the cross terms, and the results in Figure 6e display the OAM power spectrum with the same disturbance signal. Through the subtraction of double measurements, the deviations can be greatly suppressed, as shown in Figure 6f, and the measurement errors decrease to 0.032±0.001. In this case, the errors are primarily due to uneven conversion efficiencies and an unclear phase mapping. The results are then calibrated via normalization with respect to the reference data given in Figure 6a and 6b, and the measurement errors (0.006±0.001) become even smaller. The final power and phase distributions of the OAM modes are presented in Figure 6g and 6h, respectively, and agree well with the theoretical calculations. In Figure 6h, the phases of the OAM modes with very low powers are set to null. Figure 7 demonstrates a more general and complex measurement with calibration, where the unknown amplitude distribution is set to a triangular function and the phase is assumed to be irregular. The simulated and experimental patterns of the input light are presented in Figure 7a. The final power and phase distributions of the OAM modes are presented in Figure 7b and 7c, respectively. The measurement errors are 0.005±0.001. We can see that the measured power distribution is well consistent with the theoretical calculations. Although there are some apparent errors in the phase measurement, this discrepancy is acceptable because the corresponding OAM modes are of very low power.
Figure 6.
Process of calibrating the OAM complex spectrum for a general spinning object. (a) The amplitude distribution and (b) the phase distribution of the beat signals between the input OAM modes and the reference mode. The data are acquired by measuring the individual complex amplitudes of the corresponding beat signals. (c) The simulated and experimental patterns of the input light. (d) The OAM power spectrum measured without a reference light. (e) The OAM power spectrum measured with a reference light. (f) The OAM power spectrum obtained from a double measurement. (g, h) The final power and phase distributions of the OAM modes compared with the theoretical calculations. Exp, experiment; Sim, simulation.
Figure 7.
Experimental data after calibration for a case in which the amplitude distribution of the input OAM modes is set to a triangular function. (a) Simulated and experimental patterns of the input light. The final (b) power distribution and (c) phase distribution of the OAM modes compared with the theoretical calculations. Exp, experiment; Sim, simulation.
Notably, only one calibration is required for a fixed spinning object, similar to the calibration of an optical spectrum analyzer. In some cases, different spinning objects may be used to obtain different measurement accuracies or ranges. In such a case, the calibration must be repeated before mode measurements.
Discussion
In the above, we presented an experimental design to demonstrate our proposed scheme at the proof-of-concept level. In this design, we use an SLM (SLM1) to simultaneously generate both the input light to be measured and the reference light. According to the theory of the rotational Doppler effect, the spinning object need not necessarily actually rotate. Equation (5) reveals that the rotation of an object is equivalent to the rotation of the surface modulation function of a fixed object. Therefore, another SLM (SLM2) is employed to emulate a spinning object. We scan the azimuth by rotating the pattern implemented in SLM2 and record the collected intensity using a CCD. Because the frame rate of the SLM is approximately 60 Hz, a duration of a few seconds is required to complete the measurement. However, the use of a real spinning object would increase the requirements regarding the mechanical performance of the system or introduce mechanical vibrations, resulting in an unstable working state. In a real-world scenario, we can use a digital mirror device (DMD) instead of SLM2. A DMD has a function similar to that of an SLM but has a higher frame rate of up to 20 kHz, which is fast enough for practical applications. In addition, our configuration works only for a single wavelength. The same laser that generates the input light can be used as the source of the reference light by modulating its output to create the reference mode. This approach is especially convenient in short-range applications. The source of the reference light can also be separated from that of the input light through mode filtering followed by amplification with built-in amplifiers.
Our scheme can also be extended to measure the mode distribution in a few-mode fiber by mapping the OAM modes to the eigenmodes of the fiber. In most cases, only a small number of eigenmodes are used as independent channels, such as spatial modes (that is, LP01, LP11a, LP11b, LP21a and LP21b, where LP denotes a linear polarization mode and a and b represent the even and odd modes, respectively). These modes differ only in their azimuthal mode indices, similar to OAM modes. In fact, the OAM modes form an orthogonal basis for Fourier expansion in the form of a complex exponential series, whereas the LP modes form an orthogonal basis for Fourier expansion in the form of a trigonometric series. It is possible to convert between these two bases. We first measure the OAM complex spectrum and then map it to the complex spectrum based on the LP modes. The ability to measure the mode distribution in a fiber has broad applications in optical fiber communication with mode-division multiplexing.
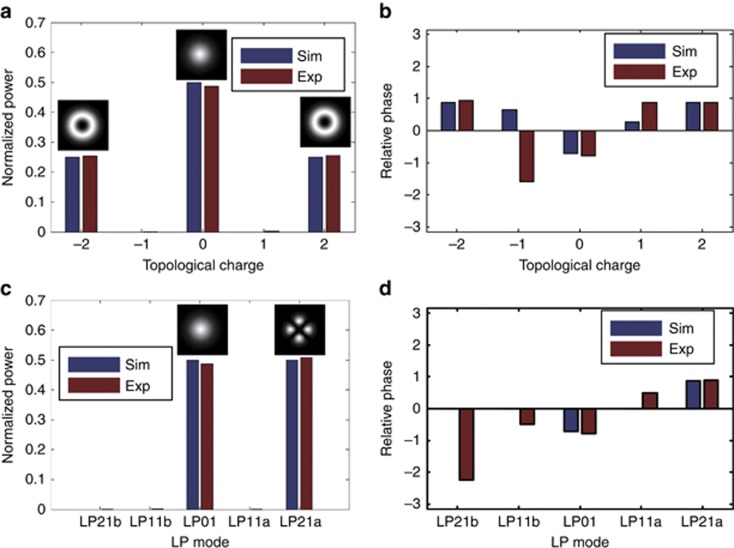
Figure 8 presents a simple experimental demonstration of the ability to measure the LP mode distribution. The input light contains only two modes, LP01 and LP21a, which have the same power and a π/2 phase difference. In our scheme, we first measure the OAM complex spectrum, as shown in Figure 8a and 8b. These OAM modes are then expressed in the LP basis. The final results presented in Figure 8c and 8d are accurate, demonstrating the ability to measure the LP modes. Note that the measured phases of LP21b, LP11b and LP11a can be revised to null because the corresponding amplitudes are null.
Figure 8.
Experimental results in (a, b) the OAM basis and (c, d) the LP basis. The inset patterns show the intensity distributions of the corresponding modes. Exp, experiment; Sim, simulation.
Conclusions
In summary, we demonstrate a prototype of an OAM complex spectrum analyzer based on the rotational Doppler effect. The system consists of unknown input OAM beams, a strong reference light beam, a spinning object, a mode filter and a photodetector. The OAM power spectrum is measured with an inherent disturbance signal via an initial measurement in the presence of a strong reference light. The disturbance signal arises from the cross terms of the input OAM modes and can be decreased by increasing the power ratio between the reference light and the input light. We further demonstrate that the disturbance signal can be eliminated by subtracting the initial measurement from a subsequent constant-disturbance measurement. Finally, we present an example in which we calibrate the OAM power spectrum for a general spinning surface, whose modulation function has an uneven distribution in the Fourier expansion along the azimuthal direction. Through calibration, the phase distribution can be determined. Similar to an optical spectrum analyzer, the proposed system offers the ability to measure the OAM complex spectrum of light, which has important applications in future OAM-based systems and optical communication systems with mode-division multiplexing.
Author contributions
HLZ and DZF contributed equally to this paper. HLZ proposed the study. HLZ, DZF and DXC performed the experiment. PZ supervised the experiment. HLZ and JJD analyzed the results and wrote the manuscript. JJD, PZ, FLL and XLZ supervised the project and edited the manuscript. All authors discussed the results and commented on the manuscript.
Acknowledgments
This work was partially supported by the National Basic Research Program of China (Grant No. 2011CB301704), the Program for New Century Excellent Talents of the Ministry of Education of China (Grant No. NCET-11-0168), the Foundation for the Author of National Excellent Doctoral Dissertation of China (Grant No. 201139), the National Natural Science Foundation of China (Grant No. 11174096, 11374008, 11534008 and 61475052) and the Foundation for Innovative Research Groups of the Natural Science Foundation of Hubei Province (Grant No. 2014CFA004).
Footnotes
The authors declare no conflict of interest.
References
- Allen L, Beijersbergen MW, Spreeuw RJC, Woerdman JP. Orbital angular momentum of light and the transformation of Laguerre-Gaussian laser modes. Phys Rev A 1992; 45: 8185–8189. [DOI] [PubMed] [Google Scholar]
- Grier DG. A revolution in optical manipulation. Nature 2003; 424: 810–816. [DOI] [PubMed] [Google Scholar]
- Curtis JE, Grier DG. Structure of optical vortices. Phys Rev Lett 2003; 90: 133901. [DOI] [PubMed] [Google Scholar]
- Lavery MPJ, Speirits FC, Barnett SM, Padgett MJ. Detection of a spinning object using light’s orbital angular momentum. Science 2013; 341: 537–540. [DOI] [PubMed] [Google Scholar]
- Lavery MPJ, Barnett SM, Speirits FC, Padgett MJ. Observation of the rotational Doppler shift of a white-light, orbital-angular-momentum-carrying beam backscattered from a rotating body. Optica 2014; 1: 1–4. [Google Scholar]
- Molina-Terriza G, Torres JP, Torner L. Twisted photons. Nat Phys 2007; 3: 305–310. [Google Scholar]
- Mair A, Vaziri A, Weihs G, Zeilinger A. Entanglement of the orbital angular momentum states of photons. Nature 2001; 412: 313–316. [DOI] [PubMed] [Google Scholar]
- Bozinovic N, Yue Y, Ren YX, Tur M, Kristensen P et al. Terabit-scale orbital angular momentum mode division multiplexing in fibers. Science 2013; 340: 1545–1548. [DOI] [PubMed] [Google Scholar]
- Wang J, Yang JY, Fazal IM, Ahmed N, Yan Y et al. Terabit free-space data transmission employing orbital angular momentum multiplexing. Nat Photonics 2012; 6: 488–496. [Google Scholar]
- Genevet P, Lin J, Kats MA, Capasso F. Holographic detection of the orbital angular momentum of light with plasmonic photodiodes. Nat Commun 2012; 3: 1278. [DOI] [PubMed] [Google Scholar]
- Fu DZ, Chen DX, Liu RF, Wang YL, Gao H et al. Probing the topological charge of a vortex beam with dynamic angular double slits. Opt Lett 2015; 40: 788–791. [DOI] [PubMed] [Google Scholar]
- Berkhout GCG, Beijersbergen MW. Method for probing the orbital angular momentum of optical vortices in electromagnetic waves from astronomical objects. Phys Rev Lett 2008; 101: 100801. [DOI] [PubMed] [Google Scholar]
- Hickmann JM, Fonseca EJS, Soares WC, Chávez-Cerda S. Unveiling a truncated optical lattice associated with a triangular aperture using light’s orbital angular momentum. Phys Rev Lett 2010; 105: 053904. [DOI] [PubMed] [Google Scholar]
- Mesquita PHF, Jesus-Silva AJ, Fonseca EJS, Hickmann JM. Engineering a square truncated lattice with light's orbital angular momentum. Opt Express 2011; 19: 20616–20621. [DOI] [PubMed] [Google Scholar]
- Zhou HL, Shi L, Zhang XL, Dong JJ. Dynamic interferometry measurement of orbital angular momentum of light. Opt Lett 2014; 39: 6058–6061. [DOI] [PubMed] [Google Scholar]
- Lei T, Zhang M, Li YR, Jia P, Liu GN et al. Massive individual orbital angular momentum channels for multiplexing enabled by Dammann gratings. Light Sci Appl 2015; 4: e257, doi:10.1038/lsa.2015.30. [Google Scholar]
- Li S, Wang J. Adaptive power-controllable orbital angular momentum (OAM) multicasting. Sci Rep 2015; 5: 9677. [DOI] [PMC free article] [PubMed] [Google Scholar]
- Strain MJ, Cai XL, Wang JW, Zhu JB, Phillips DB et al. Fast electrical switching of orbital angular momentum modes using ultra-compact integrated vortex emitters. Nat Commun 2014; 5: 4856. [DOI] [PubMed] [Google Scholar]
- Berkhout GCG, Lavery MPJ, Padgett MJ, Beijersbergen MW. Measuring orbital angular momentum superpositions of light by mode transformation. Opt Lett 2011; 36: 1863–1865. [DOI] [PubMed] [Google Scholar]
- Berkhout GCG, Lavery MPJ, Courtial J, Beijersbergen MW, Padgett MJ. Efficient sorting of orbital angular momentum states of light. Phys Rev Lett 2010; 105: 153601. [DOI] [PubMed] [Google Scholar]
- Mirhosseini M, Malik M, Shi ZM, Boyd RW. Efficient separation of the orbital angular momentum eigenstates of light. Nat Commun 2013; 4: 2781. [DOI] [PubMed] [Google Scholar]
- Martin PJL, Gregorius CGB, Johannes C, Miles JP. Measurement of the light orbital angular momentum spectrum using an optical geometric transformation. J Opt 2011; 13: 064006. [Google Scholar]
- Leach J, Courtial J, Skeldon K, Barnett SM, Franke-Arnold S et al. Interferometric methods to measure orbital and spin, or the total angular momentum of a single photon. Phys Rev Lett 2004; 92: 013601. [DOI] [PubMed] [Google Scholar]
- Leach J, Padgett MJ, Barnett SM, Franke-Arnold S, Courtial J. Measuring the orbital angular momentum of a single photon. Phys Rev Lett 2002; 88: 257901. [DOI] [PubMed] [Google Scholar]
- Zhang WH, Qi QQ, Zhou J, Chen LX. Mimicking faraday rotation to sort the orbital angular momentum of light. Phys Rev Lett 2014; 112: 153601. [DOI] [PubMed] [Google Scholar]
- Paul B, Minho K, Connor R, Hui D. High fidelity detection of the orbital angular momentum of light by time mapping. New J Phys 2013; 15: 113062. [Google Scholar]
- Bierdz P, Deng H. A compact orbital angular momentum spectrometer using quantum zeno interrogation. Opt Express 2011; 19: 11615–11622. [DOI] [PubMed] [Google Scholar]
- Karimi E, Marrucci L, de Lisio C, Santamato E. Time-division multiplexing of the orbital angular momentum of light. Opt Lett 2012; 37: 127–129. [DOI] [PubMed] [Google Scholar]
- Malik M, Mirhosseini M, Lavery MP, Leach J, Padgett MJ et al. Direct measurement of a 27-dimensional orbital-angular-momentum state vector. Nat Commun 2014; 5: 3115. [DOI] [PubMed] [Google Scholar]
- Belmonte A, Torres JP. Optical Doppler shift with structured light. Opt Lett 2011; 36: 4437–4439. [DOI] [PubMed] [Google Scholar]
- Zhou H, Fu D, Dong J, Zhang P, Zhang X. Theoretical analysis and experimental verification on optical rotational Doppler effect. Opt Express 2016; 24: 10050–10056. [DOI] [PubMed] [Google Scholar]
- Lin J, Yuan XC, Tao SH, Burge RE. Collinear superposition of multiple helical beams generated by a single azimuthally modulated phase-only element. Opt Lett 2005; 30: 3266–3268. [DOI] [PubMed] [Google Scholar]
- Lin J, Yuan XC, Tao SH, Burge RE. Synthesis of multiple collinear helical modes generated by a phase-only element. J Opt Soc Am A 2006; 23: 1214–1218. [DOI] [PubMed] [Google Scholar]


