 Ethyl carbamate could decrease the viability of HepG2 cells by arresting the cell cycle in the G1 phase, as well as apoptosis and necrosis. Moreover, an oxidative stress mechanism also contributed to the cytotoxic effects of EC.
Abstract
Ethyl carbamate (EC) is a multi-site carcinogen in experiment animals and probably carcinogenic to humans (IARC group 2A). The present study was designed to investigate the cytotoxicity effect of EC on human hepatoma G2 (HepG2) cells. The results revealed that EC inhibited the viability of HepG2 cells significantly in a dose-dependent manner. Further analysis indicated that high concentration of EC induced cell apoptosis, inhibited the G1 to S phase transition along with increased expression of p53 and p21 and decreased the expression of cyclin E and Cdk 2, but no significant change in p27 expression was observed, which were evidenced by both real time PCR and western blotting analyses. Moreover, the results of the DCFH-DA assay suggested that oxidative stress was involved in the cytotoxic effects of EC. Altogether, the present work indicated that p21, cyclin E and Cdk2, which were regulated by p53, might account for the effect of EC on cell viability and cell cycle arrest, but p27 was not involved in the pathway in HepG2 cells treated with EC.
Introduction
Ethyl carbamate is formed as a by-product of fermentation in a variety of foods and beverages (including bread, cheese, fruit brandies, wine, and beer) and is also found in cigarette smoke and air pollutants.1 Formerly, it had been used in the formulation of pesticides, fumigants, and cosmetics, and was used as a co-solvent for analgesics until 1957 when Nomura alerted people to its teratogenic and carcinogenic potential in humans.2
Because of the ubiquity of the fermentation processes, it is easy to envision the widespread presence of EC in common food products. As estimated by the JECFA,3 the mean intake of EC from food excluding alcohol beverages is approximately 15 ng per kg bw per day, which would be of low concern. However, with the inclusion of alcoholic beverages the estimated intake is 80 ng per kg bw per day, which may cause a potential risk to health. In China, the Chinese rice wine, as a kind of traditional fermented alcoholic beverage, has a high level of EC and an obvious regional consumption disparity. The daily intake of EC from rice wines was estimated to be 290.6 ng per kg bw per day for average consumers; a relatively high health risk of EC dietary exposure in Chinese rice wines was observed in some provinces, thus the health risk of EC in Chinese rice wines should be of concern.4
In studies conducted mostly in rodents, EC has been shown to be genotoxic, a multisite carcinogen, a reproductive and developmental toxicant and an immunosuppressant. In a previous study, mice given EC at doses of ≥150 mg per kg bw per day showed reduced body weight gain and effects on the lungs, liver, kidney, heart, spleen, lymph nodes, thymus, bone marrow and ovaries.3 EC aroused great concern due to its role in the etiology of cancer. Most data about the carcinogenic effect of EC were from rodents. In rodents, EC has been demonstrated to cause increases in liver, lung, and harderian gland adenoma or carcinoma, and hemangiosarcoma of the liver and heart (both sexes), mammary gland and ovarian tumors (females), and squamous cell papilloma as well as carcinoma of the skin and forestomach (males).5–7 In mice, EC-induced lung cancer has been extensively used as a model to study lung tumors and to gain insight into the molecular events involved in carcinogenesis.8,9 It has been shown that many of the frequent chromosomal changes that occur during mouse lung adenocarcinogenesis closely resemble those in human lung adenocarcinogenesis.10 In 2007, the IARC upgraded its classification of EC to group 2A (probably carcinogenic to humans).11
Since little data are available to assess the toxic effect of EC in humans, it is necessary to further evaluate its potential toxicological effects and clarify the mechanism of that in humans. Previous studies in rodents showed that liver is one of the target organs of the toxic effect of EC, however, there is no specific data about the hepatotoxicity of EC.3 The US National Research Council blueprint for change, entitled Toxicity Testing in the 21st Century: A Vision and Strategy called for a transformation of toxicity testing from a system based on studies in laboratory animals to one founded primarily on in vitro methods that evaluate changes in normal cellular signalling pathways using human-relevant cells or tissues.12 The pathway-based approach has been expanded by the description of ‘Adverse Outcome Pathways’ (AOPs) and translated this AOP/TT21C vision by some practical examples.13 We conducted the current study to investigate the possible mechanism of EC's cytotoxicity by using human hepatoma G2 (HepG2) cells as a model. Some toxicological end-points in terms of cell viability, cell cycle distribution, apoptosis, as well as the possible mechanisms of growth inhibition were comprehensively investigated. In addition, the intracellular production of reactive oxygen species (ROS) was measured to evaluate the relevance of oxidative stress with EC cytotoxicity.
Results
EC toxicity on cell proliferation
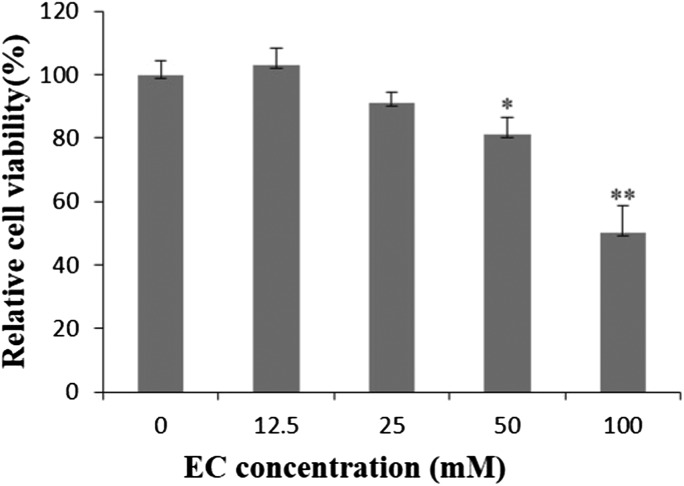
In the MTT assay, there was no toxicity observed in HepG2 cells after being exposed to EC with the concentration of 12.5 mM, when HepG2 cells were exposed to EC with the increasing concentrations (25–100 mM) for 24 h, the cell viability decreased in a concentration-dependent manner (Fig. 1).
Fig. 1. The effect of EC on the viability of HepG2 cells. HepG2 cells were treated with different concentrations of EC for 24 h. Data are expressed as the mean ± SD of three experiments (*p < 0.05, **p < 0.01 vs. 0 mM).
Effect of EC on cell cycle disruption
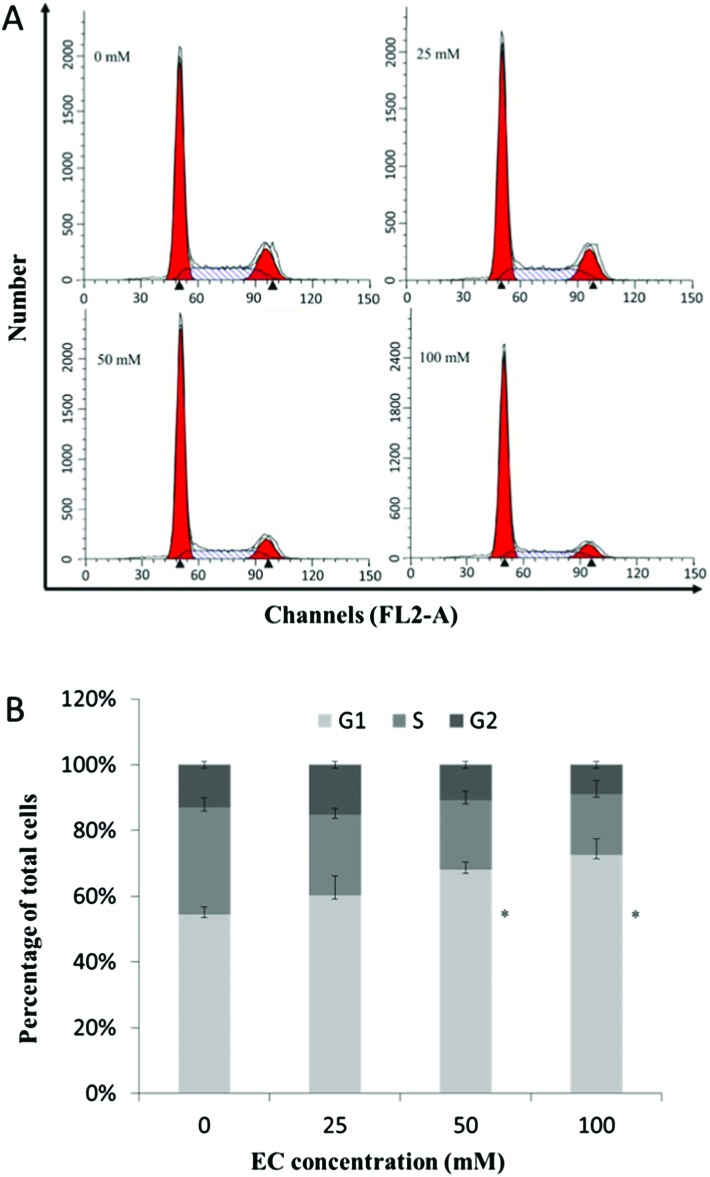
As Fig. 2A depicts, EC treated cells exhibited a regular increase in G1 phase accumulation and S phase depletion, indicating a disruption of the G1 phase to S phase transition. 50 and 100 mM of EC produced the significant changes in the cell cycle (Fig. 2B).
Fig. 2. The effect of EC on the cell cycle in HepG2 cells. HepG2 cells were treated with different concentrations of EC for 24 h. At the end of treatment, the cells were trypsinized, incubated with RNase, stained with propidium iodide (PI), and analyzed by FCM. Data are expressed as the mean ± SD of three experiments (*p < 0.05, **p < 0.01 vs. 0 mM).
EC induced apoptosis of HepG2 cells
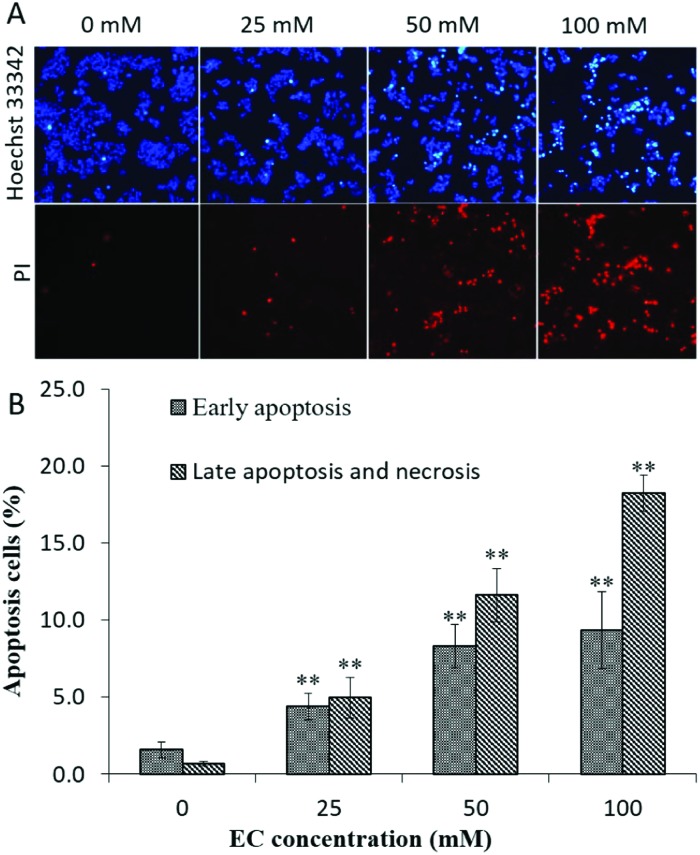
To better understand the mechanism of EC induced cytotoxicity in HepG2 cells, we examined cell apoptosis using Hoechst 33342/PI staining. As shown in Fig. 3A, typical morphological changes of apoptosis such as cell shrinkage, condensed and fragmented chromatin and bright blue nuclei were observed. To further confirm the apoptosis effect of EC, HepG2 cells were stained with Annexin V/PI and subsequently analyzed by FCM. As shown in Fig. 3B, from 0 to 100 mM, both the early apoptosis rate and the late apoptosis and necrosis rate in HepG2 cells were increased significantly. All the above results suggested that EC could induce apoptosis, and the apoptosis rates represented a dose-dependent manner.
Fig. 3. The effect of EC on cell apoptosis in HepG2 cells. HepG2 cells were treated with different concentrations of EC for 24 h. (A). The treated cells were stained with Hoechst 33342/PI, and visualized under a fluorescence microscope (200×), the normal cell was pale blue, the early apoptotic cell appeared bright blue, the late apoptotic and necrotic cells were stained red by PI. (B). The treated cells were stained with Annexin V-FITC/PI, and the apoptosis cells were analyzed by FCM. Data are expressed as the mean ± SD of three experiments (*p < 0.05, **p < 0.01 vs. 0 mM).
Induction of intracellular ROS by EC
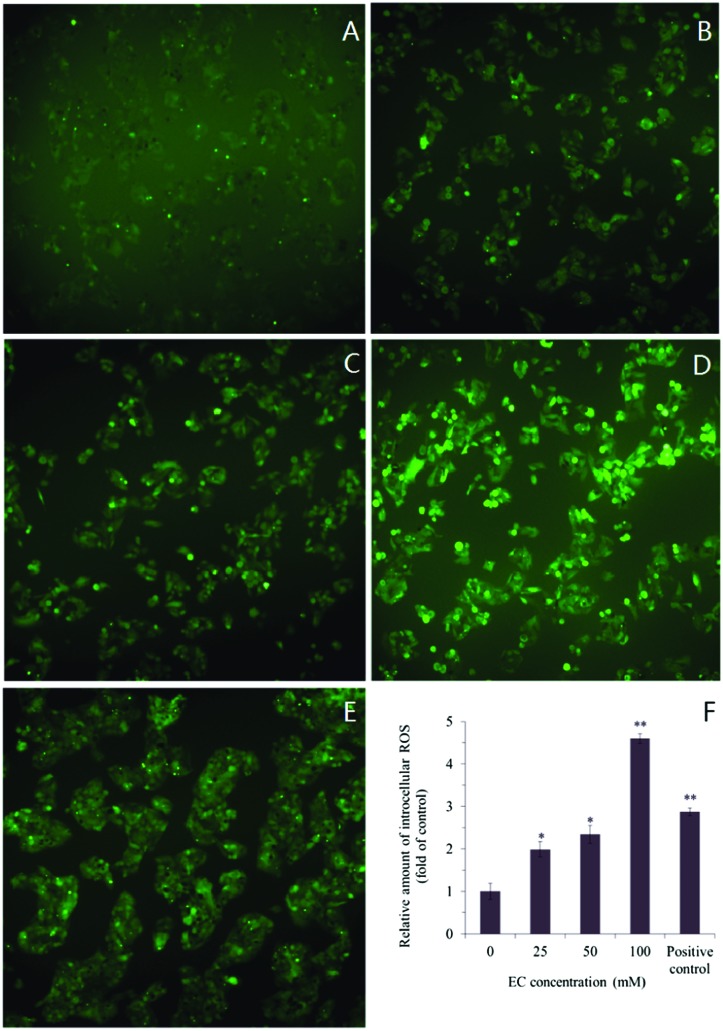
The intracellular ROS generation, induced by EC, was detected by cell permeable fluorescent substrate DHCF-DA. Visualization of ROS generation with the inverted fluorescence microscopy showed that strong green fluorescence was in the cells cultured in the presence of EC (100 mM), while fluorescence was almost invisible in 0 mM group (Fig. 4A–E). This indicated that ROS generation was occurring in response to the treatment with EC. The measurement of ROS generation suggested that the fluorescence intensity increased in HepG2 cells when treated with increasing concentrations of EC (25, 50, and 100 mM), and caused significant cellular ROS accumulation in a dose-dependent manner with respect to the untreated cells (Fig. 4F).
Fig. 4. Effects of EC on ROS levels in HepG2 cells. Exponentially growing cells were treated with the various concentrations of EC. After treatment, the cells were incubated with the fluorescent dyes DCFH-DA The fluorescence intensity was visualized with an inverted fluorescent microscope (200×). (A) 0 mM, (B) 25 mM, (C) 50 mM, (D) 100 mM, (E) positive control 1 mg L–1 (Rosup), (F) the relative amount of intracellular ROS in EC treated HepG2 cells. Data are expressed as the mean ± SD of three experiments (*p < 0.05, **p < 0.01, vs. 0 mM).
Expression of cell cycle-associated genes and proteins in EC-treated HepG2 cells
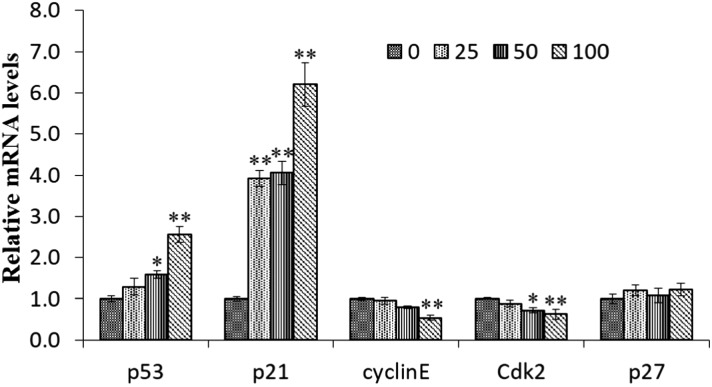
The p21 gene is one of the main transcriptional targets of the p53 tumor suppressor and is required for p53-dependent G1 and G2 cell cycle arrest. To investigate whether EC altered p53 and p21 mRNA expression in HepG2 cells, real-time PCR analysis was performed after 24 h of exposure to EC at a concentration of 100 mM. As shown in Fig. 5, both p21 and p53 genes were up-regulated (p < 0.05). Except for p53 and p21, cyclin E, Cdk 2, and p27 were all the cell cycle related genes. When treated with 100 mM EC, the expression of Cdk2 and cyclin E was decreased significantly (p < 0.01). The expression of p27 was not significantly affected by EC treatment (Fig. 5).
Fig. 5. The effect of EC on the expression of the cell cycle associated genes in HepG2 cells. Cells were treated with the various concentrations EC for 24 h. The mRNA levels of p53, p21, p27, cyclin E, and CDK 2 were determined by RT-qPCR. β-tubulin was used as the internal controls for the RT-PCR assays. Data are expressed as the mean ± SD of three experiments (*p < 0.05, **p < 0.01, vs. 0 mM).
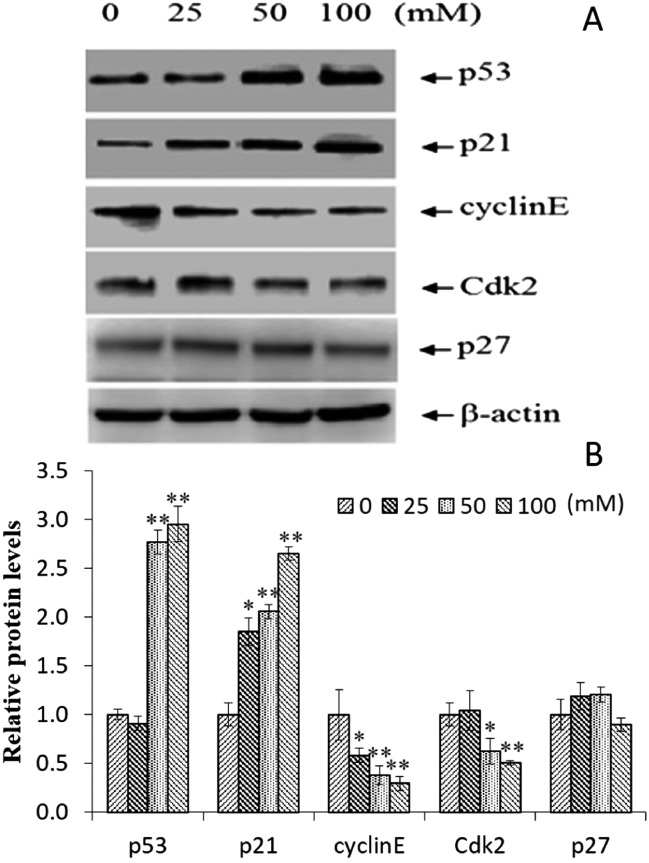
The up-regulation of p53 and p21 was further confirmed by protein expression analysis using western blotting (Fig. 6A). In addition, there was no obvious change in p27 protein expression, and the expression of Cdk 2 and cyclin E showed a significantly decreasing trend (Fig. 6B). These results suggested that p53, p21, cyclin E, and Cdk 2 shared the mechanism of EC induced G1 phase arrest in the HepG2 cells, and p27 is not involved in this pathway.
Fig. 6. The effect of EC on the expression of the cell cycle associated proteins in HepG2 cells (A and B). The cells were treated with the various concentrations EC, the protein levels of p53, p21, p27, cyclin E, and CDK 2 were determined by western blotting. β-Actin was used as the internal controls. Data are expressed as the mean ± SD of three experiments, (*p < 0.05, **p < 0.01, vs. 0 mM).
Discussion
Ethyl carbamate has been shown to be genotoxic, a multisite carcinogen, a reproductive and developmental toxicant and an immunosuppressant. Previous studies in rodents showed that the liver is one of the target organs of the toxic effect of EC, however, there is no specific data about the hepatotoxicity of EC,3 the mechanisms underlying EC-induced cell damage remain unclear. Therefore, the present study was aimed to elucidate the possible mechanism of EC induced cytotoxic.
The results obtained from the MTT assay suggested that high concentration of EC decreased the viability of HepG2 cells in a concentration-dependent manner after treatment for 24 h. However, when treated with relatively low concentrations of EC (less than 25 mM), there was no obvious alteration to HepG2 cell viability. In Chun's report, concentrations of EC less than 20 mM were not cytotoxic to RAW 264.7 macrophages and A549 cells. With 100 mM EC, only 25% of RAW 264.7 cells were viable and 78% of A549 cells survived. In our study, when treated with 100 mM EC, 53% of HepG2 cell types are relatively resistant to EC. HepG2 cells and RAW264.7 macrophages are more sensitive to a high dose of EC than A549 cells.
In the present study, it was demonstrated that EC resulted in an increase of ROS generation in HepG2 cells, especially in the groups treated with high concentrations (Fig. 4). These results are in good agreement with a previous report showing that EC increased ROS production in RAW 264.7 macrophages and A549 lung epithelial cells.9 ROS accumulation could cause modification and damage to cellular components, e.g. DNA.14 The resulting DNA damage may trigger signal transduction pathways, moreover, the early effect is represented as cell cycle progression.15 In this study, the important cell cycle alterations, including G1 phase accumulation and subsequent S phase depletion were observed. Cell cycle arrest provided enough time for the cells to repair the damaged DNA.16 The cells which successfully repaired the damage would re-enter the cell cycle, while those no longer effectively repaired would enter the state of apoptosis and ultimate cell death. The results of the present study indicated that EC treated could cause HepG2 cells death, displayed apoptosis and necrosis.
It is well-known that cellular proliferation is primarily regulated by regulation of the cell cycle to monitor DNA integrity,17 the cell cycle is regulated by cyclins, Cdks, and Cdk inhibitors, the phases of the cell cycle are controlled by the activation of different CDK/cyclin complexes.18 By using FCM analysis, we found that the inhibition effect of EC on HepG2 cell proliferation was associated with the blockage of G1 phase to S phase progression. As one of the main checkpoints of the cell cycle, G1/S transition is responsible for the initiation and completion of DNA replication, which is regulated by cyclin E/Cdk2, cyclin D/Cdk4, and cyclin D/Cdk6 complexes.19–21 Numerous reports suggested that p21 and p27 proteins are two important Cdk inhibitors, which could bind to the Cdk2–cyclinE complex, inhibit the cell-cycle transition from the G1 phase to the S phase, and result in G1 phase accumulation.22–24 Based on the results of the present study (Fig. 2), EC up-regulated the expression of p21 and down-regulated the expression of cyclin E and Cdk2 in HepG2 cells. In addition, p21 is a well-known downstream target of p53 in the G1 phase arrest.22 In the present study, a high dose of EC could increase the expression of p53, showing the same trend as with p21. However, there was no obvious change with the expression of p27. All these results suggested that p21, cyclin E and Cdk2 were might regulated by p53 and account for the effect of EC on cell cycle progression, but p27 was not involved in the pathway in HepG2 cells treated with EC.
Experimental
Chemicals
EC, RIPA buffer, fetal bovine serum (FBS), and 3-(4,5-dimethyl-thiazol-2-yl)-2,5-diphenyl-tetrazolium bromide (MTT) were from Sigma-Aldrich (St Louis, MO, USA). Dulbecco's modified Eagle's medium (DMEM), antibiotics, trypsin/EDTA solution, and Trizol reagent were purchased from invitrogen (Gibco, Grand Island, NY, USA). 2′,7′-Dichlorofluorescein diacetate (DCFH-DA), Annexin V/PI and the Hoechst 33342/PI staining kit were from Beyotime Biotech., China. Antibodies against p53, p21, p27, cyclinE, Cdk2, β-actin, and horseradish peroxidase-conjugated secondary antibodies used in the present study were all purchased from Cell Signaling Technology (Cell Signaling Technology, Beverly, MA, USA). All other reagents were of standard chemical grade.
Cell culture
HepG2 cells (American Type Culture Collection (ATCC) HB-8065) were obtained from Peking Union Medical College (Peking, China) and cultured in DMEM containing 2% l-glutamine. The medium was supplemented with 10% FBS, 100 IU per mL penicillin and 100 μg per mL streptomycin. Cells were seeded in cell culture flasks and were maintained in a humidified incubator at 37 °C with 5% CO2.
Cell viability assay
For quantitative assessment of cytotoxicity, the viability of HepG2 cells treated with EC was determined by the MTT assay as previously described.25 In brief, the cells were seeded at a density of 104 per well in 96 microplates and treated with EC at increasing concentrations (0, 12.5, 25, 50, and 100 mM) for 24 h. The cells were washed with phosphate-buffered saline (PBS), and 5 mg mL–1 MTT in fresh DMEM was added to each well. After an incubation of 4 h at 37 °C, the supernatant was removed. The insoluble formazan crystals were completely dissolved in 100 μL of DMSO by gently shaking for 10 min. The absorbance was measured at 570 nm and 630 nm using a microplate ELISA reader (Bio-Rad, Hercules, CA, USA). The results were expressed as the percentage of cell survival (%) with respect to the control (medium treated cells).
Cell cycle analysis
HepG2 cells were exposed to EC at concentrations of 0, 25, 50 and 100 mM for 24 h. The cells were collected, washed with pre-cold PBS, and fixed in 75% ethanol at 4 °C overnight. The fixed cells were washed twice with PBS and incubated for 30 min in 1 mL of PBS containing RNase (100 μg mL–1) and PI (50 μg mL–1) at room temperature in the dark. The population of cells in each cell cycle phase was measured using a FACS Calibur flow cytometer (BD Biosciences, CA, USA).
Apoptosis assays
HepG2 cells were plated onto glass coverslips in 6-well plates and treated with EC (0, 25, 50, and 100 mM) for 24 h. After EC exposure, the slides were stained with Hoechst 33342 and the PI staining kit (1 μg mL–1 Hoechst 33342, and 1 μg mL–1 PI), and examined by using an inverted fluorescence microscope (Olympus X71, Japan). Nuclear condensation indicates cell apoptosis.
HepG2 cells were exposed to EC at concentrations of 0, 25, 50 and 100 mM for 24 h. The cells were harvested, washed twice with pre-cold PBS, and re-suspended in binding buffer, to which 5 μL Annexin V-FITC and 5 μL PI were added. The cells were gently vortexed and incubated for 30 min at 4 °C in the dark following the manufacturer's instruction. The ratio of apoptotic cells was measured using a FACSCalibur flow cytometer.
Determination of intracellular reactive oxygen species (ROS)
Intracellular ROS was detected by DCFH-DA as described previously.26,27 After the cells were treated with EC (0, 25, 50 and 100 mM) for 24 h, the cells were washed with PBS, then incubated with 10 μM DCFH-DA at 37 °C for 30 min following the manufacturer's instruction. Fluorescence images were acquired on an inverted fluorescence microscope. ROS were measured using a microplate reader (Tecan Infinite F200, Tecan AG, Switzerland) at an emission wavelength of 535 nm and an excitation wavelength of 485 nm. Negative control (medium treated cells) and positive control (with Rosup) were included.
RT-qPCR and western blotting analysis
After exposure to EC (100 mM) for 24 h, HepG2 cells were washed with PBS. Total RNA extracted from the cells using Trizol reagent was reverse-transcribed to cDNA using the Takara RT reagent kit following the manufacturer's protocol. Real-time PCR was carried out using the SYBR green PCR master mix. Amplification and detection were performed by using the ABI 7500 system. The sequences of primers are listed in Table 1. Negative (no template) control and reference were included in each experiment, and each reaction was performed in triplicate.
Table 1. Sequences of primers used in the real-time qPCR amplifications.
| Target gene | Primer sequences (5′–3′) | Length of PCR product (bp) |
| β-tublin | F: TGTGGCAACCAGATCGGT | 204 |
| R: ACCTGAGCGAACAGAGTCCA | ||
| p53 | F: TTCCACGACGGTGACACG | 253 |
| R: TGGGAGCTTCATCTGGACCT | ||
| p21 | F: TTAGCAGCGGAACAAGGAGT | 209 |
| R: CCAGGCCAGTATGTTACAGGA | ||
| Cdk2 | F: ATCCGCCTGGACACTGAG | 273 |
| R: GTGGAGGACCCGATGAGA | ||
| CyclinE | F: TTGGCTATGCTGGAGGAAGT | 116 |
| R: CCTGGTGGTTTTTCAGTGCT | ||
| p27 | F: TGCAACCGACGATTCTTCTACTCAA | 185 |
| R: CAAGCAGTGATGTATCTGATAAACAAGGA |
EC treated cells were lysed in RIPA buffer containing protease inhibitors (10 μM leupeptin, 20 μg per mL chymostatin and 2 mM phenylmethylsulfonyl fluoride) containing protease inhibitor cocktail. Thereafter, 20 μg of total lysate proteins were electrophoresed on SDS-PAGE. Then, the resolved proteins were transferred onto a PVDF membrane (Millipore, Billerica, MA, USA). The membranes were blocked at room temperature for 1 h with 5% non-fat milk in PBST buffer (PBS containing 0.1% Tween 20). The membranes were incubated with an appropriate dilution of primary antibodies and then incubated with HRP-conjugated secondary antibodies. After the membranes were washed with TBST, the signals were detected by an ECL detection kit.
Statistical analysis
Statistical analysis was conducted with SPSS 19.0 software. Three independent experiments were performed for each experimental condition, and the data were conveyed as mean ± SD. One-way analysis of variance (ANOVA) was performed on multiple comparisons among treatment and control groups. Differences with P < 0.05 were considered as statistically significant. All assays were performed in triplicate.
Conclusions
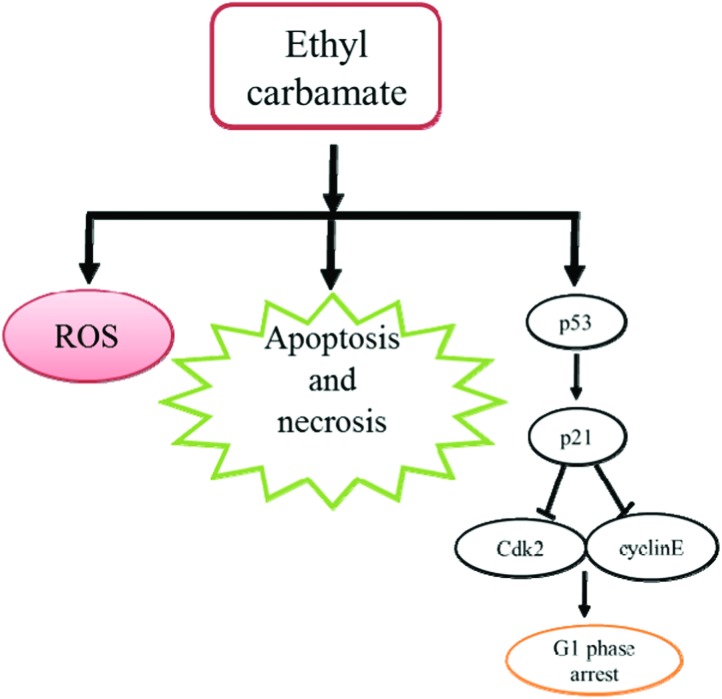
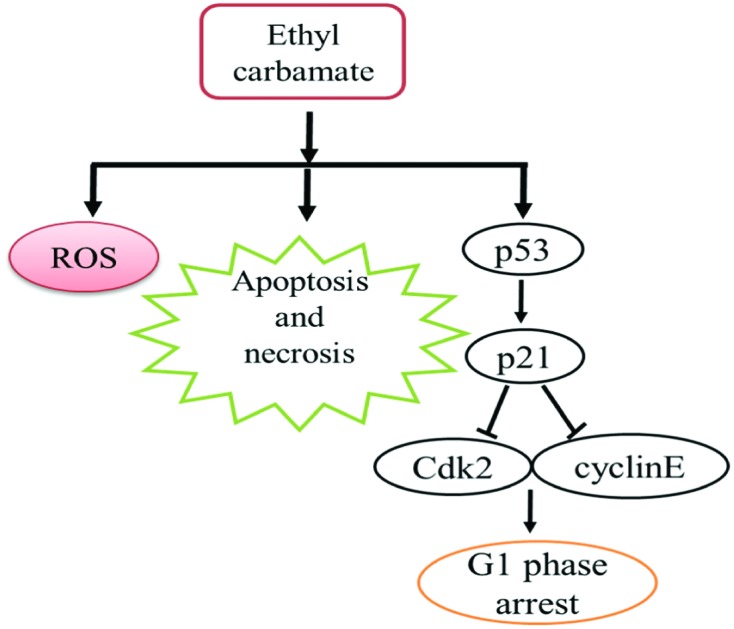
According to the above results, we found that high concentration of EC could decrease the viability of HepG2 cells by arresting the cell cycle in the G1 phase including apoptosis and necrosis. Moreover, the results of the DCFH-DA assay suggested that an oxidative stress mechanism also contributed to the cytotoxic effects of EC (Fig. 7). In conclusion, our results demonstrate that EC exerts significant cytotoxic effects on HepG2 cells.
Fig. 7. Proposed mechanism of EC-induced cytotoxicity in HepG2 cells.
Acknowledgments
This study was supported by the National Basic Research Program (973, no. 2012CB720804) and the National Natural Science Foundation of China (no. 21537001 & 81472986).
References
- Battaglia R., Conacher H. B. S., Page B. D. Food Addit. Contam. 1990;7(4):477–496. doi: 10.1080/02652039009373910. [DOI] [PubMed] [Google Scholar]
- Nomura T. Cancer Res. 1975;35(10):2895–2899. [PubMed] [Google Scholar]
- JECFA, Evaluation of certain food contaminants: sixty-fourth report of the Joint FAO/WHO Expert Committee on Food Additives, WHO technical report series no. 930, Geneva, 2006.
- Chen D. W., Ren Y. P., Zhong Q. D., Shao Y., Zhao Y. F., Wu Y. N. Food Control. 2015 doi: 10.1016/j.foodcont.2015.10.047. [DOI] [Google Scholar]
- Hanausek M., Walaszek Z., Viaje A., LaBate M., Spears E., Farrell D., Henrich R., Tveit A., Walborg E. F., Slaga T. J. Carcinogenesis. 2004;25(3):431–437. doi: 10.1093/carcin/bgh022. [DOI] [PubMed] [Google Scholar]
- Salinas N. R., Lopes C. T., Palma P. V., Oshima C. T., Bueno V. Pathol. Oncol. Res. 2009;15(4):549–554. doi: 10.1007/s12253-009-9152-2. [DOI] [PubMed] [Google Scholar]
- O'Donnell E. P., Zerbe L. K., Dwyer-Nield L. D., Kisley L. R., Malkinson A. M. Cancer Lett. 2006;241(12):197–202. doi: 10.1016/j.canlet.2005.10.012. [DOI] [PubMed] [Google Scholar]
- Calbo J., van Montfort E., Proost N., van Drunen E., Beverloo H. B., Meuwissen R., Berns A. Cancer Cell. 2011;19(2):244–256. doi: 10.1016/j.ccr.2010.12.021. [DOI] [PubMed] [Google Scholar]
- Chun S. H., Cha Y. N., Kim C. Arch. Pharmacal Res. 2013;36(3):775–782. doi: 10.1007/s12272-013-0104-8. [DOI] [PubMed] [Google Scholar]
- Bonner A. E., Lemon W. J., Devereux T. R., Lubet R. A., You M. Oncogene. 2004;23(5):1166–1176. doi: 10.1038/sj.onc.1207234. [DOI] [PubMed] [Google Scholar]
- IARC: IARC Monographs on the Evaluation of Carcinogenic Risks to Humans, in Alcoholic Beverage Consumption and Ethyl Carbamate (Urethane), Lyon, France, 2007, vol. 96. [Google Scholar]
- Boekelheide S., Andersen M. E. PLoS One. 2011;6(6):e20887. doi: 10.1371/journal.pone.0020887. [DOI] [PMC free article] [PubMed] [Google Scholar]
- Adeleye Y., Andersen M., Clewell R., Davies M., Dent M., Edwards S., Fowler P., Malcomber S., Nicol B., Scott A., Scott S., Sun B., Westmoreland C., White A., Zhang Q., Carmichael P. L. Toxicology. 2015;332:102–111. doi: 10.1016/j.tox.2014.02.007. [DOI] [PubMed] [Google Scholar]
- Du H. Y., Li J. H., Moe B., McGuigan C. F., Shen S. W., Li X. F. Environ. Sci. Technol. 2013;47(6):2823–2830. doi: 10.1021/es303762p. [DOI] [PubMed] [Google Scholar]
- AshaRani P. V., Low Kah Mun G., Hande M. P., Valiyaveettil S. ACS Nano. 2009;3(2):279–290. doi: 10.1021/nn800596w. [DOI] [PubMed] [Google Scholar]
- Wu J., Sun J., Xue Y. Toxicol. Lett. 2010;199(3):269–276. doi: 10.1016/j.toxlet.2010.09.009. [DOI] [PubMed] [Google Scholar]
- Vermeulen K., Van Bockstaele D. R., Berneman Z. N. Cell Proliferation. 2003;36(3):131–149. doi: 10.1046/j.1365-2184.2003.00266.x. [DOI] [PMC free article] [PubMed] [Google Scholar]
- Malumbres M., Barbacid M. Nat. Rev. Cancer. 2009;9(3):153–166. doi: 10.1038/nrc2602. [DOI] [PubMed] [Google Scholar]
- Massagué J. Nature. 2004;432:298–306. doi: 10.1038/nature03094. [DOI] [PubMed] [Google Scholar]
- Cicenas J., Kalyan K., Sorokinas A., Jatulyte A., Valiunas D., Kaupinis A., Valius M. Cancers. 2014;6(4):2224–2242. doi: 10.3390/cancers6042224. [DOI] [PMC free article] [PubMed] [Google Scholar]
- Wei L., Lin J., Wu G., Xu W., Li H., Hong Z., Peng J. Oncol. Rep. 2013;29(4):1623–1628. doi: 10.3892/or.2013.2250. [DOI] [PubMed] [Google Scholar]
- Hoeferlin L. A., Oleinik N. V., Krupenko N. I., Krupenko S. A. Genes Cancer. 2011;2(9):889–899. doi: 10.1177/1947601911432495. [DOI] [PMC free article] [PubMed] [Google Scholar]
- Coqueret O. Trends Cell Biol. 2003;13(2):65–70. doi: 10.1016/s0962-8924(02)00043-0. [DOI] [PubMed] [Google Scholar]
- Orlando D. A., Lin C. Y., Bernard A., Wang J. Y., Socolar J. E., Iversen E. S., Hartemink A. J., Haase S. B. Nature. 2008;453(7197):944–947. doi: 10.1038/nature06955. [DOI] [PMC free article] [PubMed] [Google Scholar]
- Zhang J., Zheng N., Liu J., Li F. D., Li S. L., Wang J. Q. Food Chem. Toxicol. 2015;83:54–60. doi: 10.1016/j.fct.2015.05.020. [DOI] [PubMed] [Google Scholar]
- Gao X. Y., Zhang X. C., Wang Y. W., Wang Y. F., Peng S. Q., Fan C. M. Food Chem. Toxicol. 2015;80:52–61. doi: 10.1016/j.fct.2015.02.018. [DOI] [PubMed] [Google Scholar]
- Zhang X. Y., Hu W. B., Li J., Tao L., Wei Y. Toxicol. Res. 2012;1:62–68. [Google Scholar]


