 Cadmium (Cd) and its compounds are well-known human carcinogens, but the mechanisms underlying the carcinogenesis are not well understood.
Abstract
Cadmium (Cd) and its compounds are well-known human carcinogens, but the mechanisms underlying the carcinogenesis are not well understood. This study aimed to investigate whether lncRNA-MALAT1 could serve as a novel biomarker of Cd toxicity in cells, animals and Cd-exposed workers, and regulate cell proliferation, apoptosis, migration and invasion. MALAT1 expression increased gradually in CdCl2 transformed 16HBE cells. The cell apoptosis, migration and invasion were significantly inhibited, and the mRNA and protein expression of FOXC2, STAT, BAX, EGFR, and TGF-β1 reduced, but BCL-2 increased (P < 0.05) after silencing MALAT1 by siRNA in CdCl2 treated 16HBE cells of 15th and 35th passages. Cadmium increased MALAT1 expression in the lung of Cd-exposed rats in a dose-dependent manner. A significant positive correlation was observed between blood MALAT1 expression and urinary/blood Cd concentrations, and there were significant correlations of MALAT1 expression with the expressions of target genes in the lung of Cd-exposed rats and the blood of Cd exposed workers. This study suggests that the expression of MALAT1 is upregulated and regulates the cell cycle progression, proliferation, apoptosis, migration and invasion in Cd toxicity. MALAT1 may serve as a novel valuable biomarker of cadmium exposure and cadmium toxicity.
Introduction
Cadmium (Cd) is a heavy metal with widespread industrial applications. However, it is toxic, and occupational and environmental exposure to it harms human health.1–3 Experimental and epidemiological studies have shown that cadmium and its compounds are carcinogenic to animals and humans.4–6 Cadmium and its compounds were classified as human carcinogens in 1993 by the International Agency for Research on Cancer.7 Although some of the molecules involved in Cd tolerance have been identified, the regulatory mechanisms involved are still largely unknown. Reports suggest that Cd may lead to cell epigenetic changes including aberrant methylation and different microRNA expression profiles, which play important roles in modulating the expression of many genes.8 We previously found that there were aberrant expression profiles of lncRNAs in Cd-treated 16HBE cells, and lncRNA-ENST00000414355 modulated DNA damage and repair in cadmium toxicology.9 However, no other study has been conducted to investigate the role of lncRNAs in cadmium-induced toxicity and carcinogenicity.
Genome-wide transcriptome studies have revealed that the mammalian genome encodes a novel class of regulatory genes encoding long non-coding RNAs (lncRNAs), which have >200 bases in length but lack significant open reading frames. It is believed that the genome encodes at least as many lncRNAs as known protein-coding genes.10,11 Thousands of lncRNAs have been found to be evolutionarily conserved12,13 and exhibit expression patterns correlating with various cellular processes.12–15 It is now considered that these lncRNAs represent a significant feature of normal cellular networks. Specifically, increasing evidence suggests that lncRNAs play a critical role in the regulation of diverse cellular processes such as stem cell pluripotency, development, cell growth and apoptosis.12–15 Given their abundance and regulatory potential, it is likely that some lncRNAs are involved in tumor initiation and progression. Recent studies suggest a number of modes of action for lncRNAs,16 most notably the regulation of epigenetic marks and gene expression.17,18 Also, lncRNAs may function as decoy, scaffold and guide molecules. Some lncRNAs act in cis to regulate transcription of a nearby gene(s),19,20 while others act in trans to repress transcription.21
The metastasis-associated lung adenocarcinoma transcript 1 (MALAT1), also referred to as HCN or nuclear-enriched abundant transcript 2 (NEAT2), is one of the first discovered long noncoding RNAs and a highly conserved 8.7 kb transcript with extremely abundant expression in several tissues.22,23 MALAT1 is upregulated in several tumor entities and its aberrant expression is associated with cancer progression, which is established as a critical regulatory function in lung cancer metastasis and recurrence.24 MALAT1 has been proposed to play multiple functions, including the regulation of transcriptional activation, alternative splicing, expression (in cis) of nearby genes, etc. due to its specific nuclear speckles localization.25 Furthermore, several pieces of experimental evidence suggest that MALAT1 might play an important biological role in controlling the tumor cell cycle, proliferation, apoptosis, migration and invasion in several cancer cells.26–28 However, whether MALAT1 plays a similar biological function in the progression of cadmium-induced toxicity and carcinogenicity is not understood.
We previously established a model of morphological cell transformation with cadmium chloride (CdCl2) in human bronchial epithelial cells (16HBE)29 and a cadmium exposure rat model.30 These models are helpful to examine the molecular events occurring during Cd toxicity and carcinogenesis. Our results have shown that Cd changed the cell cycle, increased cell apoptosis and caused DNA damage. This study aimed to investigate whether lncRNA-MALAT1 could regulate cell proliferation, apoptosis, migration and invasion in Cd toxicity. Moreover, we validated MALAT1 as a novel biomarker of Cd toxicity in cells, animals and workers with Cd exposure.
Materials and methods
Cell culture and treatments
16HBE cells were morphologically transformed using CdCl2, as previously described.29 Un-transformed 16HBE cells (control group), Cd-transformed cells of the 5th (5 μmol L–1 Cd for 2 weeks), 15th (5 μmol L–1 Cd for 6 weeks) and 35th (5 μmol L–1 Cd for 14 weeks) passages were maintained in RPMI-1640 containing l-glutamine, 10% fetal bovine serum (FBS) and 1% penicillin/streptomycin (Life Technologies) at 37 °C under a 5% CO2 humidified atmosphere. The cells were passaged twice weekly and cells in the logarithmic growth phase (2–5 × 10⁵ cells per mL) were harvested for the following experiments.
Animals and cadmium exposure
Specific-pathogen-free (SPF) Sprague-Dawley (SD) rats (90 ± 10 g) were purchased from Guangdong Medical Laboratory Animal Center (Licence no. SCXK 2008-0002, Guangdong, China) and maintained under pathogen-free conditions in the Laboratory Animal Center of Guangzhou Army General Hospital [Licence no. SYXK (Military) 2007-33, 2008C1230034834, Guangdong, China]. Ninety-six SD rats (half male and half female) were randomly divided into 4 groups. Rats were chronically exposed to Cd by intra-peritoneal injection of CdCl2 (Sigma, St Louis, MO, USA) in normal saline at different concentrations (high-dose: 1.225 mg kg–1; mid-dose: 0.612 mg kg–1 and low-dose: 0.306 mg kg–1). Rats in the control group were intra-peritoneally injected with 0.5 mL of normal saline. Cd treatment was performed five times weekly. After 14 weeks, 24 h urine samples were collected. On the second day, rats were anesthetized and blood was collected from the heart and stored at 4 °C. The lungs were harvested and stored in liquid nitrogen.30 The animal handling and experimental procedures were approved by the Animal Experimental Ethics Committee of Guangzhou Army General Hospital (Guangzhou, China).
Study population
A total of 159 workers were recruited from the Cd refinery factory with the assistance of the Center for Disease Control and Prevention, Institute for Health Supervision in Shenzhen, P.R. China. The workers included production workers, machine maintenance workers, product development personnel, management personnel and other personnel engaged in cleaning, service, security, and so on. Detailed information including the age, marital status, smoking status, alcohol consumption, professional and medical history was collected from each subject and evaluated by well-trained interviewers. In addition, the workers were asked to receive a comprehensive physical examination. The physical examination included detection of blood pressure and pulse rate, examination of the throat and pharynx, detection of lung function, electrocardiogram, liver and kidney ultrasonography, cardiopulmonary X-rays, and detection of blood cells, serum alanine aminotransferase (ALT), urinary Cd and creatinine (Cr). In this study, subjects who could not provide reliable information on the smoking history, had a smoking history or had a history of kidney or liver diseases were excluded. Finally, 159 non-smoking subjects aged 24–50 years were included for analysis.
Bioinformatics analysis of MALAT1
We previously detected the lncRNA and mRNA aberrant expression profiles in Cd-induced 35th cells by microarray assay.9 To further analyze the MALAT1 in this study, the MALAT1-mRNA regulatory network was constructed. The Pearson correlation coefficient and P-value of MALAT1-mRNA were calculated using FDR correction. The MALAT1-mRNA regulatory network was drawn using the cytoscape (; http://cytoscape.org/). The predicted target genes were input into the database Annotation Visualization and Integrated Discovery (DAVID, ; http://david.abcc.ncifcrf.gov/). Gene Ontology (GO) was used to identify the molecular function represented in the gene profile. In addition, the KEGG (Kyoto Encyclopedia of Genes and Genomes) database (; http://www.genome.ad.jp/kegg) and BioCarta (; http://www.biocarta.com) were used to analyze the roles of these target genes in the pathways.
Quantitative real-time PCR
Total RNA was isolated using the Trizol reagent. Reverse transcription was performed using a Titanium real-time PCR (RT-PCR) kit (Clontech, Mountain View, CA) according to the manufacturer's instructions. The gene expression was quantified using a fluorescence-based RT-qPCR according to the manufacturer's instructions (Bio-Rad Laboratories). The sequences of primers used for RT-qPCR are shown in Table 4.
Table 4. Primers for selected genes with real-time qPCR.
| Genes | Primers (human) | Primers (rat) |
| MALAT | Forward: 5′-GCAGGGAGAATTGCGTCATT-3′ | Forward: 5′-GGATTGGGAAGCCCTAGTTC-3′ |
| Reverse: 5′-TTCTTCGCCTTCCCGTACTT-3′ | Reverse: 5′-TCGTTCACCTGTTGTCCTCA-3′ | |
| FOXC2 | Forward: 5′-CCTCCTGGTATCTCAACCACA-3′ | Forward: 5′-CGTTGTTACCCAGAGCCTTTA-3′ |
| Reverse: 5′-GAGGGTCGAGTTCTCAATCCC-3′ | Reverse: 5′-AGACCCACACAGGTTTCTTGA-3′ | |
| STAT3 | Forward: 5′-TGTGCGTATGGGAACACCTA-3′ | Forward: 5′-ATTCCTGGCGTTACCTTGG-3′ |
| Reverse: 5′-AGAAGGTCGTCTCCCCCTTA-3′ | Reverse: 5′-AGCCCTGTATTCCGTCTCCT-3′ | |
| Bcl2 | Forward: 5′-GATAACGGAGGCTGGGATGC-3′ | Forward: 5′-AGCCTGAGAGCAACCGAAC-3′ |
| Reverse: 5′-CAGGCATGTTGACTTCACTTGTG-3′ | Reverse: 5′-AGCGACGAGAGAAGTCATCC-3′ | |
| Bax | Forward: 5′-TTGCTTCAGGGGATGATTG-3′ | Forward: 5′-TGCTACAGGGTTTCATCCAG-3′ |
| Reverse: 5′-CAAAGTAGAAAAGGGCGACA-3′ | Reverse: 5′-TGTTGTTGTCCAGTTCATCG-3′ | |
| EGFR | Forward: 5′-GGAGGCAAAGTGCCTATCAA-3′ | Forward: 5′-CCCAAAGTTCCGAGAGTTGA-3′ |
| Reverse: 5′-AGGTCATCAACTCCCAAACG-3′ | Reverse: 5′-ATGTCCTCCTCCTCCATCAG-3′ | |
| TGF-β1 | Forward: 5′-CAATTCCTGGCGATACCTCAG-3 | Forward: 5′-ATTCCTGGCGTTACCTTGG-3′ |
| Reverse: 5′-GCACAACTCCGGTGACATCAA-3′ | Reverse: 5′-AGCCCTGTATTCCGTCTCCT-3′ | |
| β-Actin | Forward: 5′-ACAGAGCCTCGCCTTTGCCGAT-3′ | Forward: 5′-GCACCGTCAAGGCTGAGAAC-3′ |
| Reverse: 5′-CTTGCACATGCCGGAGCCGTT-3′ | Reverse: 5′-TGGTGAAGACGCCAGTGGA-3′ |
RNA interference
To inhibit MALAT1, 50 nM of siRNA (siRNA MALAT1-1, siRNA MALAT1-2, siRNA MALAT1-3; Shanghai Genepharma, China) were transfected into untreated 16HBE cells, Cd-transformed cells of the 15th passage and Cd-transformed cells of the 35th passage using Lipofectamine 2000 reagent according to the manufacturer's instructions. Cells transfected with scramble-control siRNA (negative control) were used as the control. Cells were harvested 72 h after transfection. Compared with the control, siRNA MALAT1-1 and siRNA MALAT1-2 successfully decreased the expression of MALAT1. The sequences of MALAT1 siRNAs and scramble control siRNA are listed in Table 5.
Table 5. Sequences of lncRNA-MALAT1 siRNA and scramble control siRNA.
| Name | lncRNA | [BS]Sequence[BE] (5′ to 3′) |
| si-MALAT1-1 | MALAT1-sense | 5′-GAGGUGUAAAGGGAUUUAUTT-3′ |
| MALAT1-antisense | 5′-AUAAAUCCCUUUACACCUCTT-3′ | |
| si-MALAT1-2 | MALAT1-sense | 5′-GAGGUGUAAAGGGAUUUAUTT-3′ |
| MALAT1-antisense | 5′-AUAAAUCCCUUUACACCUCTT-3′ | |
| si-MALAT1-3 | MALAT1-sense | 5′-GGCAUUUGCAUCUUUAAAUTT-3′ |
| MALAT1-antisense | 5′-AUUUAAAGAUGCAAAUGCCTT-3′ | |
| si-MALAT1-NC | MALAT1-sense | 5′-UUCUCCGAACGUGUCACGUTT-3′ |
| MALAT1-antisense | 5′-ACGUGACACGUUCGGAGAATT-3′ |
Cell proliferation and viability
Cell proliferation and viability of 16HBE cells, and Cd-transformed cells of the 15th and 35th passages were evaluated by a modified methylthiazoltetrazolium (MTT) assay. Briefly, after 24 h transfection with siRNA MALAT1, about 5 × 10³ cells per well were seeded in a 96-well culture plate at 37 °C. We carried out three technical replicates for every cell. After further incubation for different times (24 h, 48 h and 72 h), the medium was removed. A 100 μl DMEM containing 100 μl MTT (5 mg ml–1) was added to each well and further incubated for 4 h. After 4 h, the medium was aspirated and 150 μl of dimethyl sulfoxide (DMSO) was added to dissolve the MTT formazan crystals. The cell viability and proliferation were determined by the OD450 value using an automatic microplate reader (BioRad, Model 680, USA).
Cytometric analysis of apoptosis cells
To explore the effect of MALAT1 on Cd-transformed cells, detection of apoptosis in 16HBE cells, and Cd-transformed cells of the 15th and 35th passages was carried out after transfection with siRNA MALAT1 only for 72 h. Apoptotic cells were analyzed using a flow cytometer (Cytomics FC 500, Beckman Coulter) after incubation with a reagent containing annexin V-FITC and propidium iodide (BD Bioscience, San Jose, CA) for 15 min in the dark at room temperature. Each study was repeated four times.
Cell migration and invasion assay
Cell migration was assessed in two 24-well plates of 8 μm (BD Biosciences) according to the manufacturer's instructions. Briefly, 200 μl of serum-free medium containing 2 × 10⁵ cells from each subgroup were added to the upper chamber, and 0.6 ml of 20% FBS-containing medium was then added to the lower chamber as a chemoattractant. Cells were incubated for 16 h at 37 °C in 5% CO2.
Matrigel Invasion Chambers in two 24-well plates of 8 μm (BD Bioscience) were used for the invasion assay according to the manufacturer's instructions. Briefly, 200 μl of serum-free medium containing 1 × 10⁵ cells from each subgroup were added to the upper chamber and 0.6 ml of 20% FBS-containing medium was then added to the lower chamber as a chemoattractant. Cells were incubated for 40 h at 37 °C in 5% CO2.
After the incubation, the cells on the upper surface of the membrane were removed with cotton swabs. Cells migrating to the bottom of the membrane were fixed and stained with 0.1% crystal violet. The cells on the bottom of the membrane were counted at five different microscopic fields and the average was calculated.
Cadmium determination and functional and pathological examinations of organs in cadmium-exposed rats
The cadmium level was determined using the cadmium standard solution (BZ/WJ/GB101/2009-1, Guangdong Occupational Health Inspection Center, Guangdong, China) by atomic absorption spectrometry (ZEENIT700, Analytik Jena, Jena, German). The concentration of urine cadmium was normalized by urinary creatinine (Cr). Tissue samples were fixed in 10% formalin and the pathological features were examined following Hematoxylin and Eosin (HE) staining. Serum alanine aminotransferase (ALT) and aspartate aminotransferase (AST) were used as biochemical markers of liver function. Blood urea nitrogen (BUN), serum creatinine (sCr) and 24 h urine protein (24 h Pro) were used to evaluate the renal function. ALT, AST, BUN, SCR and 24 h Pro were measured using the corresponding kits according to the manufacturer's instructions with an automatic biochemistry analyzer (Hitachi 7600-020/7170A, Tokyo, Japan). All animal experiments were performed in accordance with the principles of the Declaration of Helsinki. All experimental protocols were approved by the Research Ethic Committee of Guangzhou Medical University.
Collection and treatment of biological samples from cadmium-exposed workers
Venous blood was collected after fasting for 10–12 h and transferred into an anticoagulant and metal-free tube for blood cadmium (BCd) detection, blood routine examination, blood biochemical examination (ALT, AST, Cr and BUN), and detection of blood MALAT1 and its target genes. BCd concentrations were measured by atomic absorption spectrometry (ZEENIT700; Analytik Jena, Jena, Germany). Blood biochemistry was done with an automatic biochemical analyzer (Hitachi 7600-020/7170A; Hitachi, Tokyo, Japan). The expression of MALAT1 and its target genes was measured by quantitative real-time PCR.
Urine samples were collected from all participants and transferred into a metal-free polyethylene bottle as per the guidelines of clinical chemistry division of International Union of Pure and Applied Chemistry. These samples were diluted with an equal volume of 0.3 mol L–1 HNO3 and stored at 4 °C until further analysis. Urine Cd concentration was measured by atomic absorption spectrometry (ZEENIT700; Analytik Jena, Jena, Germany). The Cd standard curve was linear up to 25 μg L–1 and the detection limit was 0.33 μg L–1. The internal standard of Cd was added to urine and analyzed, and a recovery rate of 98.2% was found.
Ethical statement
All experimental protocols were approved by the Research Ethic Committee of Guangzhou Medical University. All the experiments were performed in accordance with the principles of the Declaration of Helsinki and relevant laws or guidelines. All experiments followed institutional guidelines. Informed consent was obtained from each participant. Participants were assured of their right to refuse to participate or to withdraw from the study at any time. Anonymity and confidentiality of the participants were assured. Participants were given a small gift (valued 10.0 USD) on completion of the survey. The personal information of the participants involved in the study was not disclosed.
Statistical analysis
All the data are represented as rate (%) or mean ± standard deviation (SD; ±s) of three or more independent experiments. Comparisons were done using the chi square test for rate (%) from several independent experiments and Student's t-test or analysis of variance (ANOVA) followed by Dunnett's test for mean ± SD. The correlation of the two groups was tested by Pearson or Spearman's correlation analysis. Statistical analysis was performed with SPSS version 13.0 software. A value of P < 0.05 was considered statistically significant.
Results
Abnormally high MALAT1 expression in CdCl2 transformed 16HBE cells
Real time qPCR was performed to detect the MALAT1 expression in CdCl2 transformed 16HBE cells at different stages. The results showed that the MALAT1 expression increased over time in CdCl2 transformed 16HBE cells. The MALAT1 expression in 16HBE cells of 15th passage, and 16HBE cells of 35th passage was 1.8 and 2.3 times that in the control group (P < 0.05). These suggest that there is abnormally high MALAT1 expression in CdCl2 transformed 16HBE cells.
Bioinformatics analysis of lncRNA-MALAT1
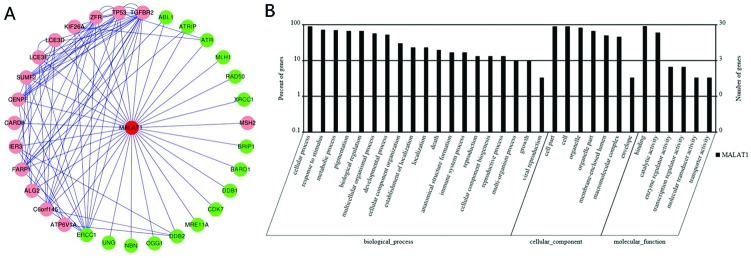
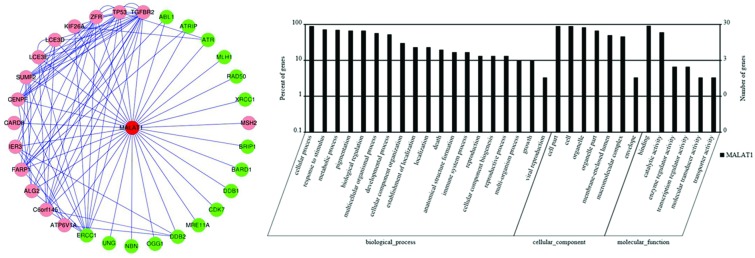
A MALAT1-mRNA co-expression network was constructed based on the correlation analysis between differentially expressed lncRNA and mRNA profiles. As shown in Fig. 1A, MALAT1 and its associated mRNAs were identified, with most of the pairs showing a positive correlation. According to the GO-Pathway analysis of differentially expressed MALAT1/mRNAs, the neighbor gene function upregulated MALAT1 mainly involved the following pathway to the target genes: biological process (cellular process, response to stimulus, metabolic process etc.), cellular component (cell part, cell, organelle, etc.) and molecular function (binding, catalytic activity, enzyme regulator activity, etc.) (Fig. 1B). There were 31 potential target genes regulated by MALAT1, and most of the target mRNAs have been reported to be related to cancers.
Fig. 1. Bioinformatics analysis of lncRNA-MALAT1. (A) Co-expression network of lncRNA-MALAT1 and mRNA was constructed with cytoscape software (http://www.cytoscape.org/) based on the correlation analysis between lncRNA-MALAT1 and differentially expressed mRNAs in Cd-induced 35th 16HBE cells as compared to untreated 16HBE cells. (B) GO and signaling pathway analysis of lncRNA-MALAT1. Pathway analysis was predominantly based on the KEGG database, and the mRNAs were annotated and classified according to the GO database.
Effect of MALAT1 on cell proliferation in CdCl2 transformed 16HBE cells
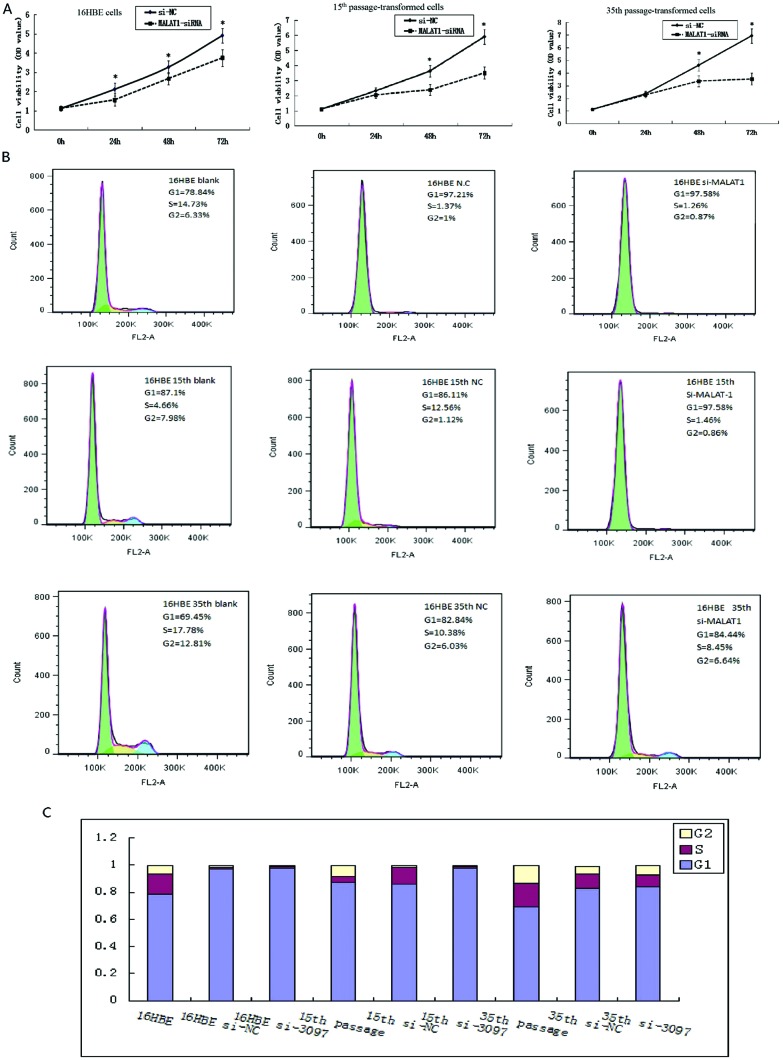
35th passage of cadmium-treated cells were transfected with si-MALAT-1 and negative control siRNA (si-NC), respectively (20 nM). At 72 hours after transfection, the MALAT1 expression was analyzed. The inhibitory rates of si-MALAT1-1, si-MALAT1-2, and si-MALAT1-3 were 91.5%, 61.4% and 33.6%, respectively. Therefore, MALAT1 siRNA-1 was prepared for the next experiments. Untreated 16HBE cells, 15th and 35th passage of cadmium-treated cells were transfected with si-MALAT-1 and si-NC, respectively. To assess the biological role of MALAT1 in cadmium toxicity, we investigated the effect of targeted knockdown of MALAT1 on cell proliferation. The MTT assay revealed that cell growth was significantly impaired in si-MALAT-1 transfected untreated 16HBE cells and 15th and 35th passage of cadmium-treated cells (Fig. 2A). After incubation for 48 h, the OD value in si-MALAT1 transfected cells was significantly lower than that of negative control siRNA cells (each, *P < 0.05) (Fig. 2A). These results indicated that MALAT1 could regulate cell proliferation in CdCl2 transformed 16HBE cells.
Fig. 2. Effect of MALAT1 on cell proliferation and cell cycle in CdCl2 transformed 16HBE cells. Untreated 16HBE cells, 15th and 35th passage of cadmium-treated cells were transfected with si-MALAT-1 and si-NC, respectively. MTT assay was performed to determine the proliferation. The OD value was performed after incubation for 24 h, 48 h and 72 h. *P < 0.05, compared to the control group (si-NC) (A). Data represent the mean ± SD from three independent experiments. Cell cycle phase was determined in untreated 16HBE cells, 15th and 35th passage of cadmium-treated cells pre- and after treating with si-MALAT-1 through flow cytometric analysis (B, C).
MALAT1 controls cell cycle progression in CdCl2 transformed 16HBE cells
To determine the effect of MALAT1 on the cell cycle of CdCl2 transformed 16HBE cells, the cell cycle distributions were measured by flow cytometric analysis. Fig. 2B shows the flow analysis data (10 000 events). The percentage of cells in the G1 phase significantly increased with MALAT1 knockdown in 16HBE model cells (16HBE, 15th and 35th passage cells) (Fig. 2B). The results suggest that MALAT1 controls cell cycle progression in CdCl2 transformed 16HBE cells.
MALAT1 regulates cell apoptosis in CdCl2 transformed 16HBE cells
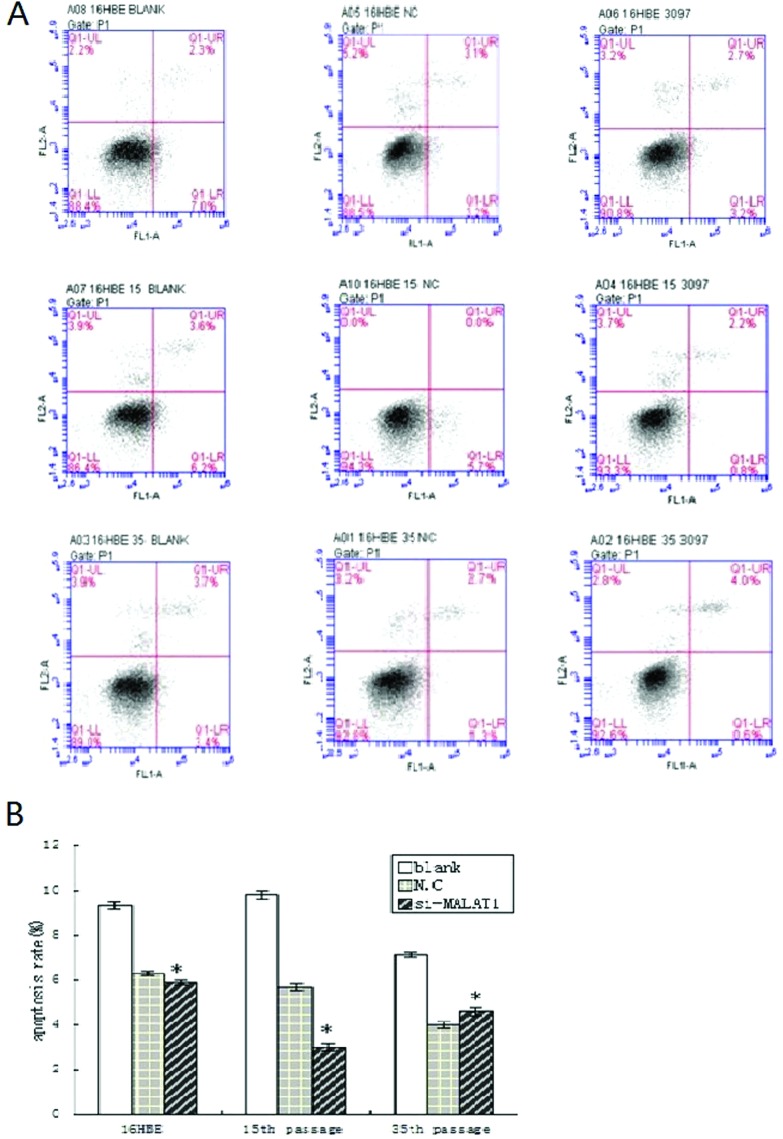
Flow cytometry was performed to detect the apoptosis of 16HBE cells before and after MALAT1 silencing. When compared with the control group, the number of apoptotic cells and the apoptosis rate reduced markedly in 16HBE cells, 16HBE cells of 15th passage and 16HBE cells of 35th passage after MALAT1 silencing (Fig. 3A and B). These results suggest that MALAT1 is able to regulate the apoptosis of CdCl2 transformed 16HBE cells.
Fig. 3. Effects of si-MALAT1 on apoptotic morphological changes during malignant transformation of human bronchial epithelial cells. Untreated 16HBE cells, 15th and 35th passage of cadmium-treated cells were transfected with si-MALAT1 and si-NC, respectively. Cell apoptosis was assayed by flow cytometry using annexin V-FITC/PI (A). Apoptosis rates were represented by the mean ± SD from three independent experiments. t-Test, *P < 0.05, si-MALAT1 group compared to the control group (si-NC).
MALAT1 regulates the invasion and migration in CdCl2 transformed 16HBE cells
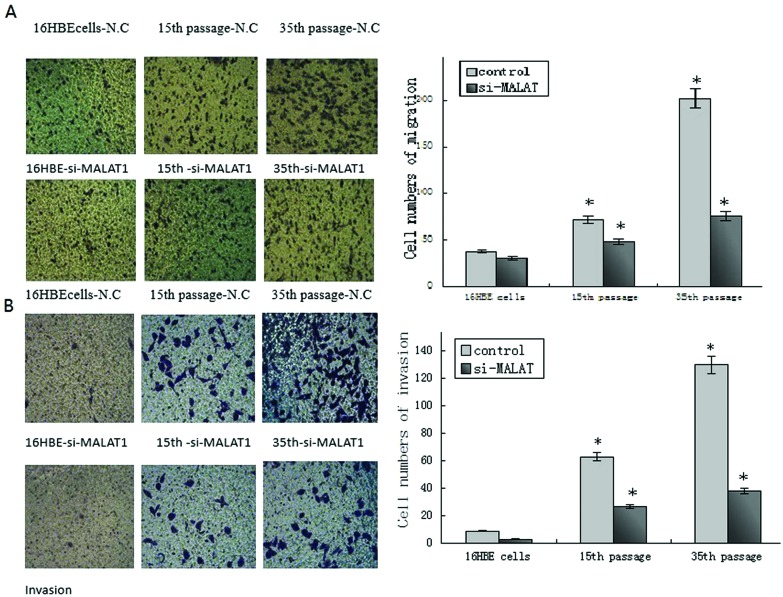
To further study the functions of MALAT1, we focus on the effect of the migration and invasion in 16HBE model cells after silencing MALAT1. We found that the invasion and migration of CdCl2 transformed 16HBE cells increased gradually while the invasion and migration in 16HBE cells, 16HBE cells of 15th passage, and 16HBE cells of 35th passage reduced markedly after MALAT1 silencing. The results showed that the invasion and migration of CdCl2 transformed 16HBE cells were abnormal and MALAT1 may exert regulatory effects on the cell migration and invasion of these cells (Fig. 4A and B).
Fig. 4. MALAT1 affects cell migration and invasion in Cd-transformed cells based on transwell. Untreated control 16HBE cells, Cd-transformed 15th passage and Cd-transformed 35th passage cells were knock-down MALAT1. (A) Representative photographs of migratory cells on the membrane (magnification, 100×). (B) Representative photographs of invasion cells on the membrane (magnification, 100×). The right panels of each row in (A) and (B) were the average cell number of triplicate. *P < 0.05, compared with 16HBE cells. #P < 0.05, compared with the control group of the same passage cells (untreated with si-MALAT-1).
Silencing of MALAT1 increased/decreased the target genes’ expression
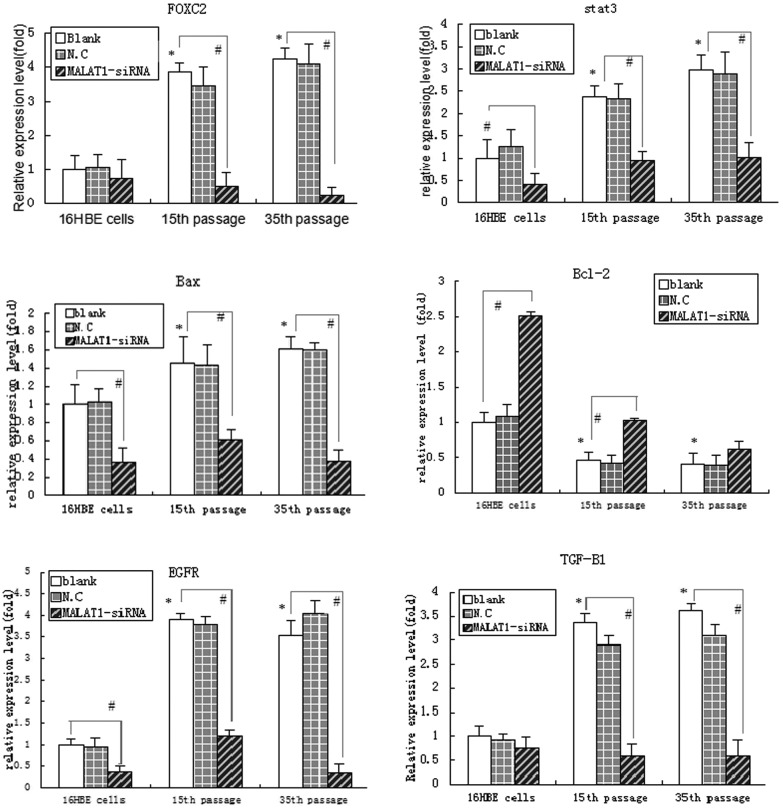
To further explore the effects of MALAT1 on cell proliferation, apoptosis, migration and invasion in CdCl2 transformed 16HBE cells, we detected their related gene mRNA expression. Of these genes, FOXC2, STAT3, BAX, EGFR and TGF-β1 showed markedly reduced mRNA expression, but BCL-2 presented with significantly increased mRNA expression (P < 0.05) after knocking down MALAT1 in 16HBE model cells compared with the same passage negative control cells (Fig. 5). The results suggest that MALAT1 regulates some key genes related to cell proliferation, apoptosis, migration and invasion in CdCl2 transformed 16HBE cells.
Fig. 5. Detection of MALAT1 changes in gene mRNA expression during cadmium-induced malignant transformation of 16HBE cells. Untreated control 16HBE cells, Cd-transformed 15th passage cells and 35th passage cells were independently treated with MALAT1-siRNA, the mRNA expression of FOXC2, STAT3, BCL-2, BAX, EGFR and TGF-β1 genes were detected after 72 h by qPCR. The threshold cycle number (Ct value) for each gene obtained with qPCR was normalized to Ct value of β-actin from the same sample, and fold changes in expression for each gene were obtained with the delta–delta Ct method. The graph shows the mean ± SD of triplicate values. *P < 0.05, compared with 16HBE cells; #P < 0.05, compared with the control group of the same passage cells (untreated with si-MALAT1) (one-way ANOVA).
MALAT1 expression in rats with chronic Cd exposure
The expression of MALAT1 in Cd-exposed rats was confirmed by qPCR. The expression of MALAT1 in the lung of low dose, mid-dose and high dose Cd exposed rats was 4.721 ± 0.634-fold, 8.432 ± 0.953-fold and 9.874 ± 1.325-fold, respectively, compared to that in control rats. Significantly up-regulated MALAT1 expression was found in the lung of Cd-exposed rats (P < 0.05). Additionally, Cd increased MALAT1 expression in the lung in a dose dependent manner (P < 0.05).
MALAT1 expression was correlated with target gene expression in Cd exposed rats
As shown in Table 1, a significant positive correlation of MALAT1 expression with the expression of BAX, TGF-β1 and STAT3 was observed, while there was a significant negative correlation between MALAT1 expression and expression of BCL-2 in Cd exposed rats (P < 0.05). However, there was no significant correlation between the expression of MALAT1 with FOXC2 and EGFR in Cd exposed rats (P > 0.05). These findings indicate that MALAT1 expression correlates with the expression of some target genes in Cd exposed rats.
Table 1. Correlation between MALAT1 expression and its target gene expression in Cd-exposed rats.
| Target genes | Correlation coefficient (r) | P | Target genes | Correlation coefficient (r) | P |
| FOXC2 | 0.28 | 0.120 | TGF-β1 | 0.52 | <0.0001 |
| BCL-2 | –0.36 | 0.040 | STAT3 | 0.48 | <0.0001 |
| BAX | 0.62 | <0.0001 | EGFR | 0.23 | 0.210 |
Health status of the workers exposed to Cd
The subjects (median age, 32 years) were directly or indirectly exposed to Cd for less than 2 years with no history of exposure to other toxic substances. Only non-smokers were included in the present study. Urine Cd concentration normalized to the urine creatinine (Cr) showed a normal distribution. The mean, maximum and minimum urine Cd concentrations were 1.430, 9.390 and 0.091 μg g–1 Cr, respectively. The 25 percentile and 75 percentile of urine Cd concentrations were 0.530 and 1.445 μg g–1 Cr, respectively. According to the urine Cd concentration, subjects were divided into three groups: ≤2 μg g–1 Cr, 2–5 μg g–1 Cr, and >5 μg g–1 Cr. The age, gender and years of employment were comparable among the three groups, suggesting that our results were not confounded by these factors.
The expression of cadmium and MALAT1 of workers exposed to cadmium
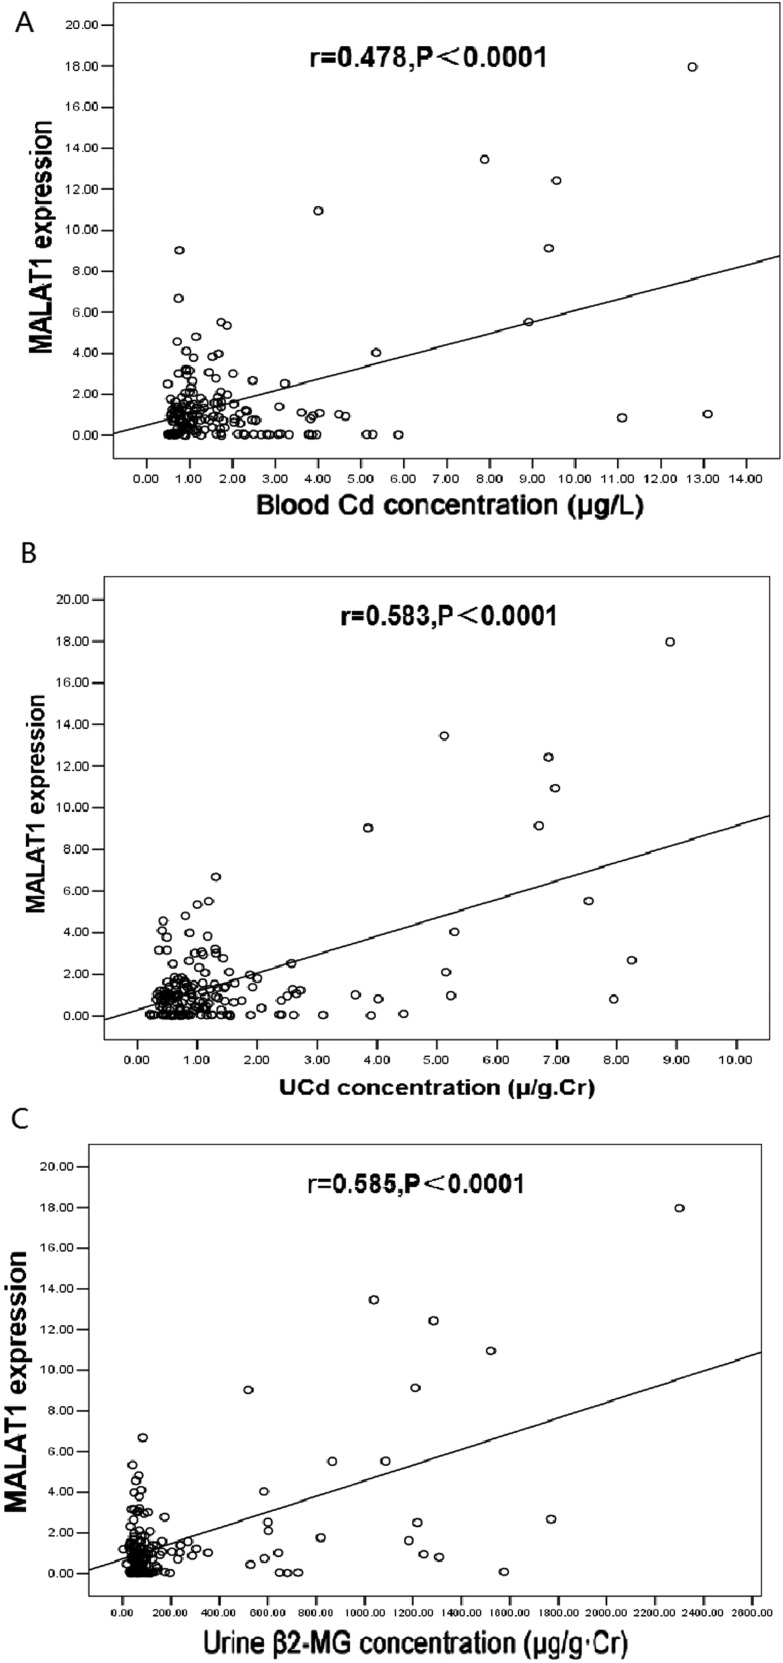
In order to evaluate whether MALAT1 serves as a biomarker of Cd exposure, the expression of MALAT1 in the blood of Cd-exposed workers was detected by quantitative real-time qPCR. According to the urine Cd concentration, urine β2-MG concentration and blood Cd concentration, these workers were divided into three groups (Table 2). The blood MALAT1 expression increased with the increase in urine Cd concentration, urine β2-MG concentration and blood Cd concentration. The MALAT1 expression was significantly higher in workers with the urine Cd concentration at >5–10 μg g–1 Cr and urine β2-MG at >1000 μg g–1 Cr (5.182-fold) when compared with the control group (urine Cd concentration at ≤2 μg g–1 Cr, and urine β2-MG at ≤500 μg g–1 Cr) (P < 0.05). A similar finding was identified in blood MALAT1 expression in workers with the blood Cd concentrations at >5 μg l–1 (4.270-fold) when compared with the control group (≤2 μg l–1) (P < 0.05). There was a significant positive correlation of MALAT1 expression with the blood Cd concentration (r = 0.270, P = 0.049), urine Cd concentration (r = 0.310, P = 0.023) and urine β2-MG concentration (r = 0.289, P = 0.034) (Fig. 6). These findings indicate that MALAT1 expression is correlated with Cd exposure in Cd-exposed workers.
Table 2. Blood lncRNA-MALAT1 expression at different Cd exposure levels in Cd-exposed workers (n = 159).
| Exposure to Cd at different levels | N | MALAT1 | F | P value |
| Ucd levels | ||||
| ① ≤2 μg g–1 Cr | 136 | 1.179 ± 1.457 | 26.471 | P total < 0.0001 |
| ② 2–5 μg g–1 Cr | 12 | 2.279 ± 2.126 | P ①② = 0.096 | |
| ③ >5 μg g–1 Cr | 11 | 6.109 ± 3.164 | P ①③ < 0.0001 | |
| P ②③ < 0.0001 | ||||
| Urine β 2 -MG | ||||
| ① ≤500 μg g–1 Cr | 136 | 1.179 ± 1.457 | 26.471 | P total < 0.0001 |
| ② 500–1000 μg g–1 Cr | 12 | 2.279 ± 2.126 | P ①② = 0.096 | |
| ③ >1000 μg g–1 Cr | 11 | 6.109 ± 3.164 | P ①③ < 0.0001 | |
| P ②③ < 0.0001 | ||||
| BCd level | ||||
| ① ≤2 μg l–1 | 116 | 1.375 ± 1.497 | 21.855 | P total < 0.0001 |
| ② 2–5 μg l–1 | 32 | 1.042 ± 1.894 | P①② = 0.439 | |
| ③ >5 μg l–1 | 11 | 5.872 ± 4.415 | P ①③ < 0.0001 | |
| P ②③ < 0.0001 | ||||
Fig. 6. Correlation analysis between lncRNA-MALAT1 expression and Cd concentration in Cd-exposed workers. Correlation analysis between lncRNA-MALAT1 expression and blood Cd concentration (A), urine Cd concentration (B) and urine β2-MG concentration (C). Blood lncRNA-MALAT1 expression was calculated by the ratio of its expression to that of β-actin. The urine cadmium concentration was normalized by urine creatinine (μg g–1 Cr) and urine β2-MG (μg g–1 Cr). The linear relationship was analyzed by Pearson correlation analysis.
MALAT1 expression was correlated with target gene expression in Cd-exposed workers
There was a significant positive correlation between MALAT1 expression and mRNA expression of FOXC2, BAX, TGF-β1, STAT3 and EGFR, while there was a significant negative correlation between MALAT1 expression and mRNA expression of BCL-2 in Cd-exposed workers. In addition, the associations between MALAT1 expression and target gene expression were further evaluated after adjustment for urine Cd concentration and blood Cd concentration that might affect MALAT1 expression and target gene expression, respectively, in Cd-exposed workers. A significant correlation between MALAT1 expression and target gene expression was still observed (Table 3). These findings indicate that MALAT1 expression correlates very well with target gene expression in Cd-exposed workers.
Table 3. Correlation analysis between lncRNA-MALAT1 expression and target gene expression in Cd-exposed workers.
| Target genes | Correlation coefficient (r) | P | Target genes | Correlation coefficient (r) | P |
| FOXC2 | 0.324 | 0.034 | TGF-β1 | 0.487 | <0.0001 |
| BCL-2 | –0.351 | 0.002 | STAT3 | 0.414 | <0.0001 |
| BAX | 0.586 | 0.001 | EGFR | 0.257 | 0.041 |
Discussion
It is well known that cadmium is an accepted important toxic heavy metal, which is widely used in modern industrial products, and long-term exposure to cadmium might cause disease and even tumors. However, the carcinogenic mechanisms induced by Cd are not yet elucidated. Previous studies have shown that tumorigenesis is closely associated with diverse epigenetic changes including histone modifications, DNA methylation and non-coding RNAs.31,32 However, no other research team has investigated the role of lncRNAs in cadmium toxicity. Therefore, we speculate that MALAT1 might play an important biological role in cadmium toxicity. In this study, we found that the expression level of MALAT1 was elevated in CdCl2 transformed 16HBE cells, CdCl2 treated rats and Cd-exposed workers. Moreover, MALAT1 can regulate the cell proliferation, cell cycle, apoptosis, migration and invasion in CdCl2 transformed 16HBE cells.
MALAT1 is a firstly identified long noncoding RNA, and serves as a potential predictor of metastasis in non-small cell lung cancer. Later, MALAT1 has been proposed to have a broader functional role owing to its unique features: highly abundant expression, specific nuclear speckles localization,33 highly evolutionarily conserved,34,35 conserved 3′-end processing and developmental regulation. Furthermore, recent studies showed that transient overexpression of MALAT1 in several cell lines enhanced cellular proliferation and promoted tumor formation in nude mice, while depletion of MALAT1 reduced the capacity of proliferation and invasion of cancer cells.36–38 To verify the role of MALAT1 in Cd toxicity, MALAT1 in untreated 16HBE cells and Cd-induced cells were knocked down with small interfering RNA. The results showed that MALAT1 knockdown significantly inhibited the cell proliferation, apoptosis, migration and invasion in Cd-transformed 16HBE cells.
Some studies have shown that genetic changes have an important role in explaining the functions of cell biology. STAT3,39 FOXC2,40 EGFR41 and TGF-β142 might involve in the progression of cellular proliferation, invasion, migration and/or angiogenesis, and the pro-apoptotic gene BAX and the anti-apoptotic gene BCL-2 are associated with cell apoptosis progress. In this study, we examined the expression of these six genes, and found that knockdown of MALAT1 reduced the mRNA expression of FOXC2, STAT, BAX, EGFR, and TGF-β1, but BCL-2 increased, compared with the untreated si-MALAT1 16HBE model cells at the same passage of CdCl2-induced malignant transformation. These results can partly be explained by the changes of biological function of malignant transformation of 16HBE cells.
Many cellular and molecular events are involved in the toxic effects of chemical carcinogens,43–45 but no other study has been conducted to investigate lncRNAs as new biomarkers of Cd exposure. The present study was undertaken to investigate the biomarker role of lncRNAs in the Cd toxicity of animal model and Cd-exposed workers. The animal model of chronic Cd exposure used in this study was established by continuous intra-peritoneal injection of CdCl2 for 14 weeks. The cadmium toxicity was evaluated by the weight coefficient, histopathological examination and liver and renal function (ALT, AST, SCR, BUN and 24 h Pro) detection. The metal concentration of the blood reflects the recent exposure, and that of the urine reflects the body burden after a long-term exposure, while that of tissues reflects the metal accumulation and organ damage.46,47 In the present study, the expression of MALAT1 in the lung of Cd-treated rats was positively correlated with the Cd exposure, suggesting that MALAT1 reflects the accumulation of cadmium in the body. MALAT1 expression in the body is useful in predicting the Cd-induced toxicity.
In addition, the expression of MALAT1 was also detected in the blood of workers exposed to Cd. The results showed a positive correlation between blood MALAT1 and blood Cd concentration, urine Cd concentration and urine β2-MG concentration, and expression of target genes, suggesting that blood MALAT1 is a potentially novel biomarker of Cd-exposure in humans.46 Subjects with urine Cd exhibited significantly higher blood MALAT1 expression than those without urine Cd, suggesting that, even at a lower range of urine Cd concentration, the change in blood MALAT1 may reflect the alteration in Cd accumulation.
In conclusion, our study determines for the first time the role of lncRNA-MALAT1 in Cd toxicity. This study suggested that the expression of MALAT1 was upregulated and regulates the cell cycle progression, proliferation, apoptosis, migration and invasion in Cd toxicity. MALAT1 may serve as a novel valuable biomarker of cadmium exposure and cadmium toxicity and may become a significant biomarker for field investigations and risk assessment in humans exposed to occupational and environmental cadmium.
Abbreviations
- Cd
Cadmium
- MALAT 1
Metastasis associated lung adenocarcinoma transcript 1
- FOXC2
Forkhead box C2
- STAT
Signal transducers and activators of transcription
- BAX
Bcl-2 associated X protein
- EGFR
Epidermal growth factor receptor
- TGF-β1
Transforming growth factor beta 1
- lncRNAs
Long non-coding RNAs
- NEAT2
Nuclear-enriched abundant transcript 2
Author contributions
Z. Z., Q. H. and Y. L. conceived and designed the study. Z. Z. and Q. H. wrote the manuscript. Z. Z., Q. H. and H. S. performed the experiments. Q. L. and B. C. contributed reagents, materials and analysis tools.
Conflict of interest
The authors have declared that no competing interests exist.
Acknowledgments
The authors thank the officers for their support and assistance in the coordination of this study, the organization of the field work and providing some background information, and thank all respondents for their cooperation. This work was supported by the National Natural Science Foundation of China (Lei YX: 81573177; Zhou ZH: 81473001); the Science and Technology Planning Project of Guangdong Province, China (Lei YX: 2013B021800095 and Zhou ZH: 2013B021800093) and the Science Foundation of Guangzhou Bureau of Education (Zhou ZH: 1201410830).
References
- Waalkes M. P. Mutat. Res. 2003;533:107–120. doi: 10.1016/j.mrfmmm.2003.07.011. [DOI] [PubMed] [Google Scholar]
- Satarug S. Toxicol. Lett. 2003;137:65–83. doi: 10.1016/s0378-4274(02)00381-8. [DOI] [PubMed] [Google Scholar]
- Swaddiwudhipong W., Mahasakpan P., Funkhiew T., Limpatanachote P. J. Med. Assoc. Thailand. 2010;93:1217–1222. [PubMed] [Google Scholar]
- Koyu A. Mol. Cell. Biochem. 2006;20:1–5. doi: 10.1007/s11010-005-9017-2. [DOI] [PubMed] [Google Scholar]
- Nordberg G. Ambio. 2002;31:478–481. doi: 10.1579/0044-7447-31.6.478. [DOI] [PubMed] [Google Scholar]
- Schöpfer J., Drasch G., Schrauzer G. N. Biol. Trace Elem. Res. 2010;134:180–187. doi: 10.1007/s12011-010-8636-y. [DOI] [PubMed] [Google Scholar]
- Beryllium, cadmium, mercury and exposures in the glass manufacturing industry, Lyon, France, International Agency for Research on Cancer, 58, 119–238 (IARC 1993)
- Yanfei D., Zhen C., Cheng Z. J. Exp. Bot. 2011;62:3563–3573. [Google Scholar]
- Zhou Z. Sci. Rep. 2015;5:15293. doi: 10.1038/srep15293. [DOI] [PMC free article] [PubMed] [Google Scholar]
- Rinn J. L., Chang H. Y. Annu. Rev. Biochem. 2012;81:145–166. doi: 10.1146/annurev-biochem-051410-092902. [DOI] [PMC free article] [PubMed] [Google Scholar]
- Amaral P. P., Mattick J. S. Mamm. Genome. 2008;19:454–492. doi: 10.1007/s00335-008-9136-7. [DOI] [PubMed] [Google Scholar]
- Guttman M. Nature. 2009;458:223–227. doi: 10.1038/nature07672. [DOI] [PMC free article] [PubMed] [Google Scholar]
- Guttman M. Nature. 2011;477:295–300. doi: 10.1038/nature10398. [DOI] [PMC free article] [PubMed] [Google Scholar]
- Hung T. Nat. Genet. 2011;43:621–629. doi: 10.1038/ng.848. [DOI] [PMC free article] [PubMed] [Google Scholar]
- Wang K. C. Nature. 2011;472:120–124. doi: 10.1038/nature09819. [DOI] [PMC free article] [PubMed] [Google Scholar]
- Wang K. C., Chang H. Y. Mol. Cell. 2011;43:904–914. doi: 10.1016/j.molcel.2011.08.018. [DOI] [PMC free article] [PubMed] [Google Scholar]
- Rinn J. L. Cell. 2007;129:1311–1323. doi: 10.1016/j.cell.2007.05.022. [DOI] [PMC free article] [PubMed] [Google Scholar]
- Nagano T. Science. 2008;322:1717–1720. doi: 10.1126/science.1163802. [DOI] [PubMed] [Google Scholar]
- Orom U. A. Cell. 2010;143:46–58. [Google Scholar]
- Kotake Y. Oncogene. 2011;30:1956–1962. doi: 10.1038/onc.2010.568. [DOI] [PMC free article] [PubMed] [Google Scholar]
- Huarte M. Cell. 2010;142:409–419. doi: 10.1016/j.cell.2010.06.040. [DOI] [PMC free article] [PubMed] [Google Scholar]
- Ji P. Oncogene. 2003;22(39):8031–8041. doi: 10.1038/sj.onc.1206928. [DOI] [PubMed] [Google Scholar]
- Wilusz J. E., Freier S. M., Spector D. L. Cell. 2008;135(5):919–932. doi: 10.1016/j.cell.2008.10.012. [DOI] [PMC free article] [PubMed] [Google Scholar]
- Tripathi V. Mol. Cell. 2010;39(6):925–938. doi: 10.1016/j.molcel.2010.08.011. [DOI] [PMC free article] [PubMed] [Google Scholar]
- Wilusz J. E. Genes Dev. 2012;26(21):2392–2407. doi: 10.1101/gad.204438.112. [DOI] [PMC free article] [PubMed] [Google Scholar]
- Schmidt L. H. J. Thorac. Oncol. 2011;6(12):1984–1992. doi: 10.1097/JTO.0b013e3182307eac. [DOI] [PubMed] [Google Scholar]
- Gutschner T., Hammerle M., Diederichs S. J. Mol. Med. 2013;91(7):791–801. doi: 10.1007/s00109-013-1028-y. [DOI] [PubMed] [Google Scholar]
- Tripathi V. PLoS Genet. 2013;9(3):e1003368. doi: 10.1371/journal.pgen.1003368. [DOI] [PMC free article] [PubMed] [Google Scholar]
- Lei Y. X., Wei L., Wang M., Wu G. R., Li M. Biomed. Environ. Sci. 2008;21:332–338. doi: 10.1016/S0895-3988(08)60051-3. [DOI] [PubMed] [Google Scholar]
- Qian L., Yi L., Chao He., Zi L. Int. J. Mol. Sci. 2013;14:5182–5197. doi: 10.3390/ijms14035182. [DOI] [PMC free article] [PubMed] [Google Scholar]
- Baylin S. B., Ohm J. E. Nat. Rev. Cancer. 2006;6(2):107–116. doi: 10.1038/nrc1799. [DOI] [PubMed] [Google Scholar]
- Herceg Z. Mutagenesis. 2007;22(2):91–103. doi: 10.1093/mutage/gel068. [DOI] [PubMed] [Google Scholar]
- Hutchinson J. N. BMC Genomics. 2007;8:39. doi: 10.1186/1471-2164-8-39. [DOI] [PMC free article] [PubMed] [Google Scholar]
- Lin R. Oncogene. 2007;26(6):851–858. doi: 10.1038/sj.onc.1209846. [DOI] [PubMed] [Google Scholar]
- Hutchinson J. N. BMC Genomics. 2007;8:39. doi: 10.1186/1471-2164-8-39. [DOI] [PMC free article] [PubMed] [Google Scholar]
- Gutschner T. Cancer Res. 2013;73(3):1180–1189. doi: 10.1158/0008-5472.CAN-12-2850. [DOI] [PMC free article] [PubMed] [Google Scholar]
- Lin R. Oncogene. 2007;26(6):851–858. doi: 10.1038/sj.onc.1209846. [DOI] [PubMed] [Google Scholar]
- Tseng J. J. Mol. Hum. Reprod. 2009;15(11):725–731. doi: 10.1093/molehr/gap071. [DOI] [PubMed] [Google Scholar]
- Kamran M. Z., Patil P., Gude R. P. Biomed. Res. Int. 2013;2013:421821. doi: 10.1155/2013/421821. [DOI] [PMC free article] [PubMed] [Google Scholar]
- Kume T. Trends Cardiovasc. Med. 2008;18(6):224–248. doi: 10.1016/j.tcm.2008.11.003. [DOI] [PMC free article] [PubMed] [Google Scholar]
- Lo H. W., Hung M. C. Br. J. Cancer. 2007;96:16–20. [PubMed] [Google Scholar]
- Bottner M., Krieglstein K., Unsicker K. J. Neurochem. 2000;75(6):2227–2240. doi: 10.1046/j.1471-4159.2000.0752227.x. [DOI] [PubMed] [Google Scholar]
- Thomas R. S. Toxicol. Sci. 2009;112:311–321. doi: 10.1093/toxsci/kfp233. [DOI] [PubMed] [Google Scholar]
- Weng S. Toxicol. Lett. 2014;225(3):367–77. doi: 10.1016/j.toxlet.2014.01.012. [DOI] [PubMed] [Google Scholar]
- Mendoza-Soto A. B., Sánchez F., Hernández G. Front. Plant Sci. 2012;3:105. doi: 10.3389/fpls.2012.00105. [DOI] [PMC free article] [PubMed] [Google Scholar]
- Lei Y. X. Biomed. Environ. Sci. 2010;23:151–157. doi: 10.1016/s0895-3988(10)60045-1. [DOI] [PubMed] [Google Scholar]
- Ikeda M. Int. Arch. Occup. Environ. Health. 2011;84:121–129. doi: 10.1007/s00420-010-0527-1. [DOI] [PubMed] [Google Scholar]


