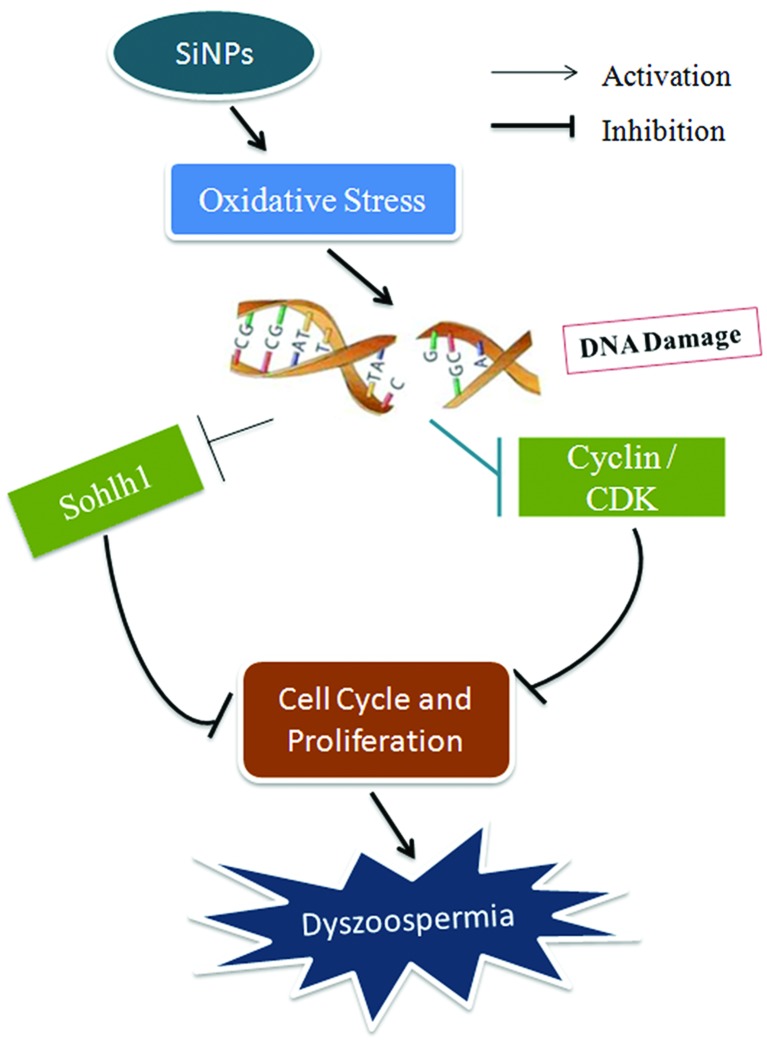
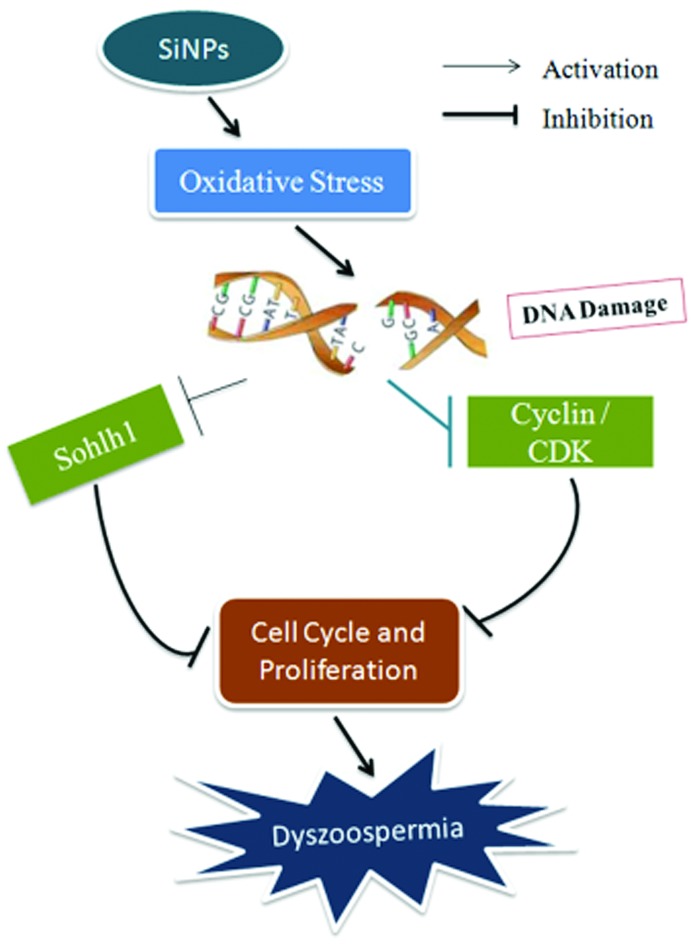
 Silica nanoparticles induced cell cycle arrest and proliferation inhibition by down-regulating the expressions of meiotic regulatory factors through causing DNA damages resulting from oxidative stress, leading to the inhibition of the start and process of meiosis.
Abstract
Silica nanoparticles have been shown to induce reproductive toxicity, but the mechanism is unknown. To investigate the toxic mechanism of SiNPs, 60 male mice were randomly divided into three groups: a control group, a saline group and a SiNPs group, with two evaluation time points (45 and 75 days after the first dose) per group. Mice in the SiNPs group were treated with SiNPs at a dose of 2.0 mg kg–1 every three days, a total of 15 times in 45 days, mice in the saline group were given the same volume of physiological saline, and the control group was treated with nothing. Then, half of the mice in each group were sacrificed for tissue samples on days 45 and 75. In vitro, GC-2spd cells were exposed to various concentrations of SiNPs for 24 h. The results showed that SiNPs damaged seminiferous epithelium, leading to a decrease in sperm quality and an increase in the sperm abnormality rate. Moreover, expressions of Sohlh1/cyclin A1/cyclin B1/CDK1/CDK2 were greatly down-regulated and the ROS level in the testicular tissue of the mice was significantly increased on day 45. However, these changes were reversed by day 75. In vitro, SiNPs induced G0/G1-phase cell cycle arrest and proliferation inhibition in GC-2spd cells. These results suggested that SiNPs might induce cell cycle arrest and inhibit cell proliferation by down-regulating expressions of meiotic regulators, whereas DNA damage caused by oxidative stress may be associated with meiosis and sperm production. In addition, damage to the male reproductive system caused by SiNPs may be reversible.
Introduction
Natural silica nanoparticles are the main inorganic particulate matter pollution sources in air. With the rapid development of nanotechnology, as an important class of nanomaterials, SiNPs are widely used in products such as plastics, biopesticides, food additives, and cosmetics,1–3 and are also used in biomedical fields, such as drug delivery vectors, gene transfection reagents and cell markers,4–9 thus the biological safety of nanomaterials has attracted increasing attention. Studies have shown that nanoparticles can enter into organisms through inhalation, ingestion, or skin contact,10 then reach a potential sensitive target via the circulation of blood and lymph.11–13 Kim et al. found that 4 weeks after the abdominal injection of magnetic nanoparticles packaged by SiNPs in mice, the particles were found in the tissues of brain, liver, heart, lung, spleen, kidney, prostate and uterus.14 SiNPs have also been shown to pass through a variety of physiological barriers to induce toxicity in lungs, the cardiovascular system, liver and reproductive organs.15–18 Previous studies have shown that SiNPs inhibit the hatching rate, which results in a direct delay in embryo development, leading to persistent effects on larval behavior.19 Research by Zhao et al.20 showed that the pregnancy rate of female rats and the average number of fetal rats decreased significantly after intratracheal instillation of SiNPs. Furthermore, SiNPs could damage the quantity and quality of sperm in the epididymis by causing oxidative stress and damaging the structure of mitochondria, resulting in energy metabolism dysfunction.21 However, there is little information about the effects of SiNPs on the cell cycle of spermatogenic cells and the process of meiosis. The present study was designed to investigate the effects of SiNPs on the cell cycle and meiosis with C57 mice and GC-2spd cell lines. Our study provides new experimental evidence for the potential mechanisms by which nanoparticles affect the male reproductive system.
Materials and methods
Animals and experimental design
C57 male mice at the age of six weeks were obtained from the animal laboratory of Capital Medical University in Beijing (Animal production license number: SCXK2012-0001) (Beijing, China) (Ethical review number: AEEI-2014-068); the mean weight of mice was in the range 18.1–22.0 g. Mice were maintained in a standard plastic cage (26 cm × 15 cm × 15 cm) with a stainless steel mesh lid. All animals were raised in a constant environment (12 : 12 light/dark cycle) at a temperature of 22 ± 2 °C and a humidity of 60 ± 10%. The bedding for the mice was changed twice every week. All of the mice were provided with food and drinking water ad libitum. The animal experiments were all conducted in accordance with the institutional guidelines for animal welfare. All surgery was performed under anesthetic, and all efforts were made to minimize animals’ suffering. The protocols were approved by Capital Medical University Institutional Animal Care and Use Committee (Ethical review number: AEEI-2014-068).
After a week of adaptation to laboratory conditions, 60 male mice with body weights ranging from 18.1–22.0 g were randomly divided into three groups: a normal control group, a saline control group and an SiNPs group with 20 mice per group; each group had two evaluation time points (45 d and 75 d after the first dose). The control group was designed in order to detect whether the method of intratracheal instillation caused mechanical damage to the animals, and was treated with nothing. Mice in the SiNPs group were administered SiNPs at 2.0 mg kg–1, and mice in the saline group were given the same volume of physiological saline using a method of intratracheal instillation, once every three days, a total of 15 times in 45 days. SiNPs used in this study had an average diameter of 58 nm and were dissolved in saline; these were obtained from the College of Chemistry, Jilin University. In order to avoid unnecessary suffering, mice were sacrificed using 7 ml kg–1 chloral hydrate (5%) on days 45 and 75 after the first dose. Then, testicles and epididymides were collected; the testicles on the left were fixed for histology analysis, and the others were stored at –80 °C for other assessments.
Silica nanoparticles
The Stöber method was used to prepare Silica nanoparticles.22 Transmission electron microscopy (TEM) (JEOL JEM2100, Japan) was used to measure the sizes of silica nanoparticles. The size distribution was measured using Image J software (National Institutes of Health, USA). The hydrodynamic sizes and zeta potential of silica nanoparticles were analyzed with a Zetasizer (Malvern Nano-ZS90, Britain).
Histological assessment of testis
The testes were fixed in 10% neutral buffered formalin solution. Then, samples were treated by dehydrating with graded ethanol and placed in xylene for transparency. The histological structures of testes in mice were observed under a light microscope (Olympus BX53, Japan) at a magnification of 10 × 40 after paraffin embedding and HE staining. Six samples were randomly selected from each group, and ten visual fields for each sample were used to count the numbers of spermatogenic cells and measure the diameters of seminiferous tubules using cross-bonded method. Spermatogenetic cells include spermatogonia, primary spermatocytes, secondary spermatocytes and spermatids.23,24 Spermatogonia closely adhere to the basal lamina. This is characterized by a large, spherical nucleus and the diameter is about 12 μm. The primary spermatocyte is a round-shaped cell with a diameter of about 18 μm. It is the biggest cell of the spermatogenetic cells, and the chromatin is like coarse mesh. Secondary spermatocytes are smaller in size than the primary spermatocytes; this stage is rarely observed. A spermatid is a small round cell, with a diameter of about 8 μm and large spherical nuclei, seen closer to the lumen of tubule. Then, the average values of 60 visual fields in each group were calculated using a statistical method.
Epididymis semen quality evaluation
An auto system for sperm analysis (Hamilton Thorne IVOS-II, USA) was used to determine the sperm concentration and sperm motility rate according to the manufacturer's protocols. The epididymides were quickly placed in a Petri dish with preheated Dulbecco's Modified Eagle's Medium (DMEM, 2 mL), and cut into pieces in order to release the sperm into the DMEM, then maintained at 37 °C for 5 min. Ten μL of the sperm suspension was added to the auto system for sperm analysis, and the date of activity for the sperm and sperm concentration were automatically recorded on the computer. Furthermore, we analyzed the sperm malformation rate with an optical microscope (Olympus BX53 Japan). A drop of sperm suspension was drawn and smeared on a slide, then stained for 1 hour with 1% eosin after fixation for 10 min with methanol, then washed with water. We counted the number of malformed sperm among 1000 sperms using a high-magnification microscope. The rate of sperm malformation = the number of malformed sperm ÷ 1000 × 100%.
The determination of expressions in meiotic regulating factors
The protein expressions of meiosis-regulating factors, Sohlh1/cyclin A1/cyclin B1/CDK1/CDK2, were determined by Western blot analysis. The proteins in testicular tissue were extracted using a protein extraction kit (KeyGen, China) and measured using the bicinchoninic acid (BCA) protein assay (Dingguo Changsheng Biotech Co. Ltd, China). Equal amounts of lysate proteins (40 μg) were electrophoresed by SDS polyacrylamide gel electrophoresis (12% separation gels) and transferred to polyvinylidene fluoride (PVDF) membranes (Millipore, USA). The membranes were blocked with 5% BSA for 2 h at room temperature and subsequently incubated overnight at 4 °C with rabbit-anti-Sohlh1 (1:500; Abcam, USA), rabbit-anti-cyclin A1 (1:500, Bioss, China), rabbit-anti-cyclin B1 (1:500, Bioss, China), rabbit-anti-CDK1 (1:500, Bioss, China), rabbit-anti-CDK2 (1:500, Bioss, China), and rabbit-anti-β-actin (1:1000; Santa Cruz, USA). Then, PVDF membranes were washed three times with TBST for 10 min each time, and incubated with a horseradish peroxidase-conjugated goat-anti-rabbit IgG (1:5000; Proteintech, USA) for 1 h at room temperature. Finally, an ECL chemiluminescence reagent (Pierce, USA) was used to detect the protein bands (normalized with those of β-actin). Image Lab™ Software (Bio-Rad, USA) was used for densitometric analysis of protein bands.
The measurement of reactive oxygen species level
The reactive oxygen species (ROS) level of testicular tissue was measured through the fluorescence intensity of dichlorofluorescein (DCF), using 2,7-dichlorofluoresceindiacetate (DCFH-DA, Nanjing Jiancheng Bioengineering Institute, China), which was the most sensitive reactive oxygen detection probe and is widely used in ROS measurement. Firstly, the testicular tissues were accurately weighed, and ground in ice, and proteins in the centrifugal supernatant fluid were quantified using the bicinchoninic acid (BCA) method (Dingguo Changsheng Biotech Co. Ltd, China). Then, centrifugal supernatants were diluted and incubated after addition of DCFH-DA for 30 minutes at 37 °C. Lastly, the fluorescence intensity of each sample was measured at 525 nm with a fluorescence microplate reader (TriStar LB941, Germany).
Cell culture and experimental design in vitro
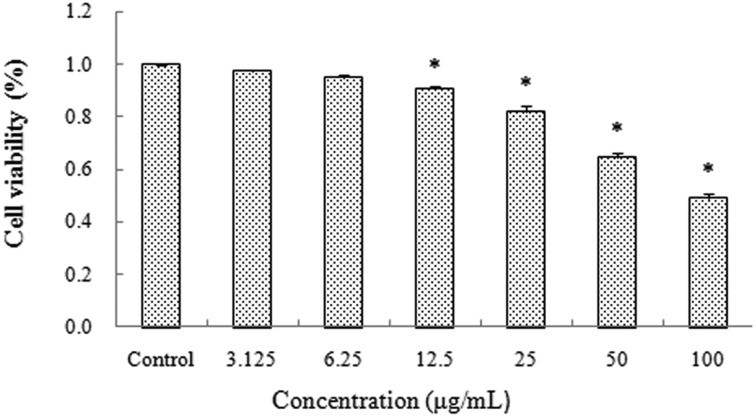
The mouse spermatocyte GC-2spd cells were obtained from Guangzhou Jennio Biotech Co., Ltd. The cells were incubated in a complete medium, which is composed of DMEM (Genview, USA), 10% fetal bovine serum (FBS, Gibco, USA), 100 U per mL penicillin, and 100 μg per mL streptomycin at 37 °C in a 5% CO2 humidified environment. When cells were exposed to SiNPs at concentrations of 0, 3.125, 6.25, 12.5, 25, 50 and 100 μg ml–1 for 24 h, cell viability was respectively 100%, 97.3%, 94.7%, 90.37%, 81.89%, 64.57%, 49.14% (Fig. 5). On the basis of the above results, concentrations of SiNPs at 6.25, 12.5, 25 and 50 μg ml–1 were chosen for subsequent experiments. All experiments were repeated three times for statistical analysis. Suspensions of SiNPs were dispersed using a sonicator (160 W, 20 kHz, 5 min) before experiments.
Fig. 5. Effects of silica nanoparticles on the cell viability of GC-2spd lines (Mean ± S.E.) * indicates significant difference compared to control group (p < 0.05).
The determination of cell viability
The effects of SiNPs on cell viability were assessed using the 3-(4,5-dimethylthiazol-2-yl)-2,5-diphenyltetrazolium bromide (MTT) assay as previously described.25 The GC-2spd cells were seeded into 96-well plates at a density of 3 × 10⁴ cells per well and incubated for 24 h. Then, they were washed with phosphate-buffered saline (PBS) and treated with various concentrations of SiNP suspensions (0, 3.125, 6.25, 12.5, 25, 50 and 100 μg mL–1) for another 24 h. Subsequently, the cells were washed three times with PBS and treated with 5 mg mL–1 MTT (10 μl) for 4 h. Finally, the optical density at 492 nm was determined using a microplate reader (Thermo Multiskan MK3, USA) after addition of 150 μl of dimethylsulfoxide (DMSO, AppliChem).
The analysis of the cell cycle
To study the cell cycle dynamics of GC-2spd cells, the numbers of cells at different cell-cycle phases were determined by a cell-cycle detection kit (KeyGen, China). The cells were cultivated in 6-well plates for 24 h. After the cells were exposed to SiNPs for another 24 h, they were treated with 75% ethanol (cooled at –20 °C for 24 h in advance) at 4 °C for fixation. The cell suspension was treated with 100 μL RNase at 37 °C for 30 minutes, followed by staining with 400 μL propidium iodide (PI) for 30 minutes at 4 °C in the dark. The stained cell suspensions were analyzed by flow cytometry (Beckman Coulter, USA).
The analysis of cell proliferation
The GC-2spd cells (2 × 10⁶ cells per group) were rinsed with PBS, and cells were marked with carboxyfluorescein diacetate, with succinimidyl ester (CFDA-SE) probe diluent (KeyGen, China) at 37 °C for 15 min after centrifugation at 1000 rpm for 5 min. Then, cells were washed twice with PBS and incubated in the 6-well plates for 24 h. After that, the cells were exposed to SiNPs for another 24 h. The cells were re-suspended with 500 μL PBS, and the average fluorescence intensity of cells was measured by flow cytometry (Beckman Coulter, USA).
The determination of DNA damage
DNA damage was assessed using a single-cell gel electrophoresis (SCGE) kit (Research Bio-lab, China). The GC-2spd cells were exposed to varying concentrations of SiNPs for 24 h, then suspended in PBS. The cell suspensions (10 μL) and low-melting-point agarose (LMPA, 90 μL) were separately preheated to 38 °C and then mixed; the mixture was dripped onto the first gel layer, which was previously added and hardened on slides, and then immediately covered with a clean cover slip at 4 °C for 5 minutes to form the second gel layer. A third gel layer without cells was added on the second gel layer. These slides were submerged in fresh pre-chilled cell lysate for 2 h in the dark at 4 °C, and then the slides were moved to a horizontal gel electrophoresis tank with fresh alkaline electrophoresis liquid for unwinding for 30 minutes in the dark at room temperature. After 30 min electrophoresis at 25 V (300 mA), the slides were stained with GelRed (nucleic acid gel stain) for 4 min, and a fluorescence microscope connected to a camera was used to observe the phenomenon of cell trailing. A total of 100 cells were randomly scored per sample. Finally, CASP was used for image analysis to measure the tailing rate, tail length, tail moment, and olive tail moment of cells in comet assay.
Statistical analysis
Statistical analysis was performed using the SPSS 17.0 software. In vivo, an independent-samples T-test was used to analyze the differences between control and saline groups and between saline and SiNPs groups. In vitro, one-way analysis of variance (ANOVA) was used to analyze differences in multiple groups, followed by the least significant difference (LSD) test for two groups. All experiments were repeated three times. Data were expressed as the mean ± standard error (S.E.). All significant differences were considered at the level of p < 0.05.
Results
Characterization of silica nanoparticles
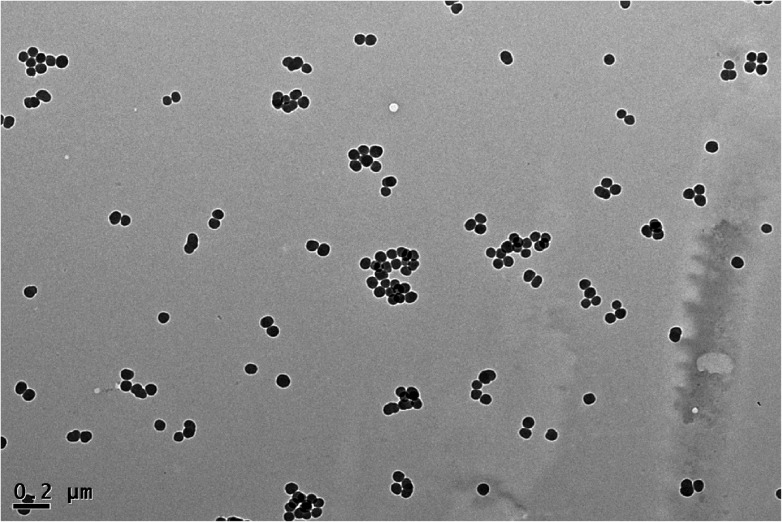
The results showed that SiNPs appeared near-spherical and well dispersed in distilled water, Dulbecco's Modified Eagle's Medium (DMEM, a kind of cell culture medium) and physiological saline. The size distribution of SiNPs is approximately normal, and the average diameter is 57.66 ± 7.30 nm (Fig. 1). The results were similar to our previous research.26
Fig. 1. Transmission electron microscope image of silica nanoparticles Silica nanoparticles appeared near-spherical and well dispersed with an average diameter of 58 nm.
The changes in the histological structures of testicles and spermatogenic cell numbers
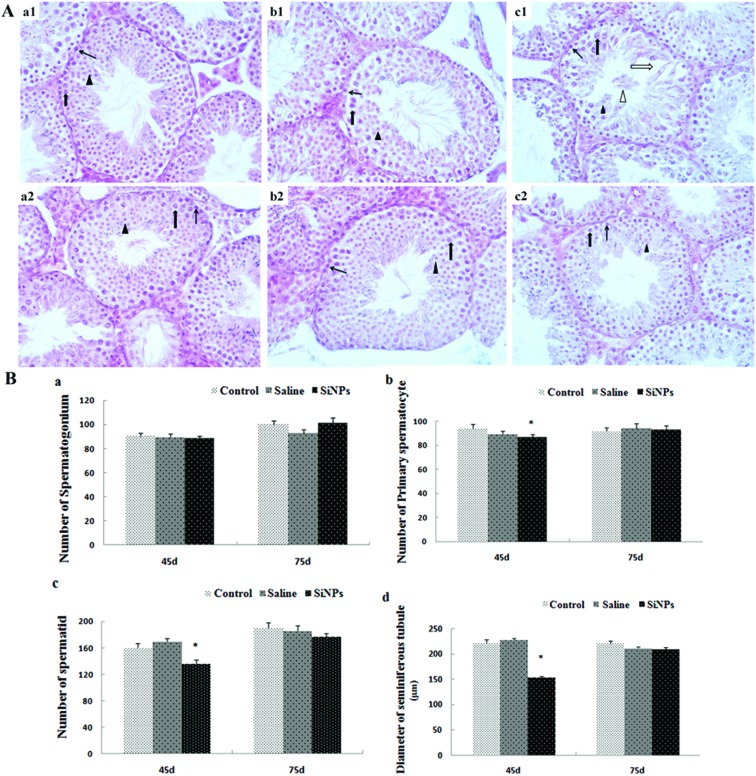
On day 45, the lumen of seminiferous tubules in testicles was obvious in the control and saline groups; 5–8 layers of spermatogenic cells were closely and orderly arranged in the seminiferous tubules. In the lumens, there were a large number of mature sperms. However, in the SiNPs group, the seminiferous tubules became sparse, gaps appeared between spermatogenic cells, and the layers of spermatogenic cells and mature sperms decreased. Exfoliation of spermatogenic cells was observed in a part of the lumens (Fig. 2A(a1–c1)). Microscopic studies of the SiNP-treated animals showed a significant reduction in the number of primary spermatocytes and spermatids compared to the saline group on day 45 after the first dose (p < 0.05). The diameter in the SiNPs group on day 45 is 153.3 ± 3.27 μm, which is much smaller than that in the control group (221.7 ± 6.21 μm) (p < 0.05) and saline group (227.0 ± 4.13 μm) (p < 0.05) (Fig. 2B). The changes induced by SiNPs that were observed on day 45 were reversed on day 75 (p > 0.05) (Fig. 2).
Fig. 2. Effects of silica nanoparticles on the structure of testicular tissue in mice A(a1–c2): 45 d (d is short for day) control group 400× (a1), 45 d saline group 400× (b1), 45 d SiNPs group 400× (c1); 75 d control group 400× (a2), 75 d saline group 400× (b2), 75d SiNPs group 400× (c2); thin black arrow represents spermatogonium; thick black arrow represents spermatocyte; black triangle represents spermatid; thick white arrow represents enlargement of gap. White triangle represents exfoliation of spermatogenic cells. (B) Numbers of spermatogenic cells and diameters of spermatogenesis tubules (Mean ± S.E.). *indicates significant difference compared to control and saline group (p < 0.05).
The changes of epididymal sperm parameters
As shown in Table 1, on day 45 after the first dose, the sperm concentration, motility rate and malformation rate in the epididymis exhibited no significant difference between the control group and saline group (p > 0.05). In the SiNPs group, the sperm concentration and motility rate were much lower and the sperm malformation rate was much higher than that in the saline group (p < 0.05). In addition, there was no difference in the epididymal sperm parameters among the three groups on day 75 (p > 0.05). Furthermore, there were no significant differences in any of the measurements in vivo between the control and saline groups, which indicated that the method of intratracheal instillation does not damage the reproductive system of male mice.
Table 1. Effects of silica nanoparticles on sperm quality and quantity of epididymis in mice (Mean ± S.E.).
| Sperm concentration (×104 mL–1) |
Sperm motility rate (%) |
Sperm abnormality rate (%) |
||||
| 45D | 75D | 45D | 75D | 45D | 75D | |
| Control | 128.25 ± 10.53 | 89.5 ± 11.2 | 76.31 ± 3.25 | 53.92 ± 5.25 | 2.36 ± 0.29 | 2.03 ± 0.17 |
| Saline | 124.0 ± 11.47 | 99.8 ± 9.59 | 63.00 ± 5.95 | 58.92 ± 8.95 | 1.78 ± 0.10 | 1.95 ± 0.13 |
| SiNPs | 83.80 ± 3.33* | 89.0 ± 7.02 | 33.3 ± 5.49* | 40.47 ± 7.01 | 6.42 ± 0.44* | 2.40 ± 0.25 |
The changes in protein expressions of meiotic regulating factors
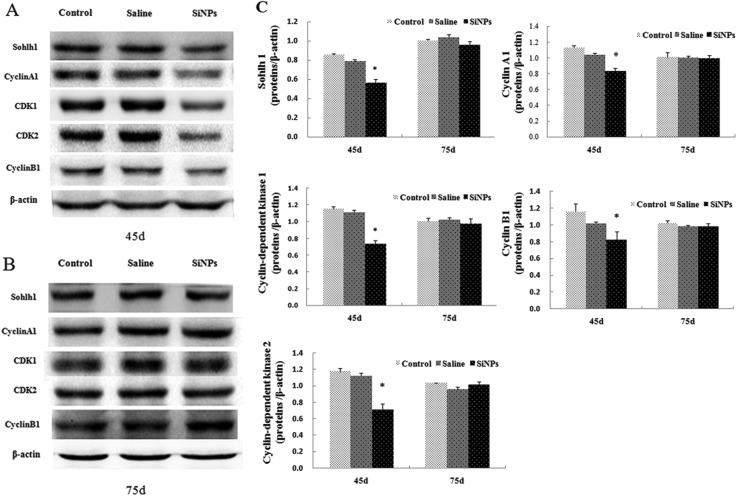
To further understand the effect of SiNPs on the start and process of meiosis, we examined the protein expressions of a helix-loop-helix transcription factor (Sohlh1) and cell cycle control factors by Western blot assay. As shown in Fig. 3, in the SiNPs group, the expressions of Sohlh1, cyclin A1, cyclin-dependent kinases 1 (CDK1), cyclin-dependent kinases 2 (CDK2), and cyclin B1 in testicular tissues decreased obviously on day 45 (p < 0.05), while the protein expressions showed no significant difference on day 75 compared to the saline group (p > 0.05).
Fig. 3. Effects of silica nanoparticles on expressions of regulators in testes of mice (A): effects of silica nanoparticles on the expressions of Sohlh1, cyclin A1, cyclin B1, CDK1, CDK2 on day 45 (B): effects of silica nanoparticles on the expressions of Sohlh1, cyclin A1, cyclin B1, CDK1, CDK2 on day 75. β-Actin was the internal control (C): relative densitometric analysis of the protein bands was carried out and presented (Mean ± S.E.).
Levels of reactive oxygen species (ROS)
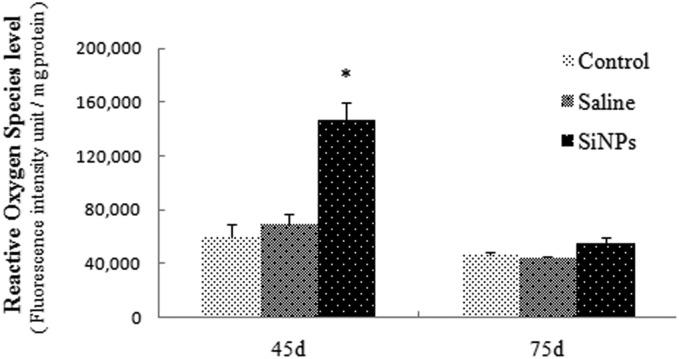
ROS generation is proportional to the fluorescence intensity of DCF (2′,7′-dichlorofluorescein), so changes in ROS can be reflected by the fluorescence intensity of DCF. As shown in Fig. 4, ROS levels of the SiNPs group increased significantly (p < 0.05). The fluorescence intensity in the SiNPs group is much higher than for the other groups on day 45, but there is no significant difference between these two groups on day 75. These results demonstrated that SiNPs could increase ROS levels and induce oxidative stress.
Fig. 4. Effects of silica nanoparticles on ROS levels in testicular tissues of mice (Mean ± S.E.) * indicates significant difference compared to control and saline group (p < 0.05).
The change in cell viability
Cell viability was measured to evaluate the possible toxicity of SiNPs on the mouse spermatocyte cells (GC-2spd cell lines). The results showed a gradual reduction as the SiNP level increased in a dose-dependent manner, compared with the control group (Fig. 5). GC-2spd cells were exposed to SiNPs at concentrations of 0, 3.125, 6.25, 12.5, 25, 50 and 100 μg ml–1, and cell viability respectively decreased to 100%, 97.3%, 94.7%, 90.37%, 81.89%, 64.57%, 49.14%, which was significantly lower than that in the control group, except for the 3.125 and 6.25 μg ml–1 SiNPs groups.
The changes in cell cycle and cell proliferation
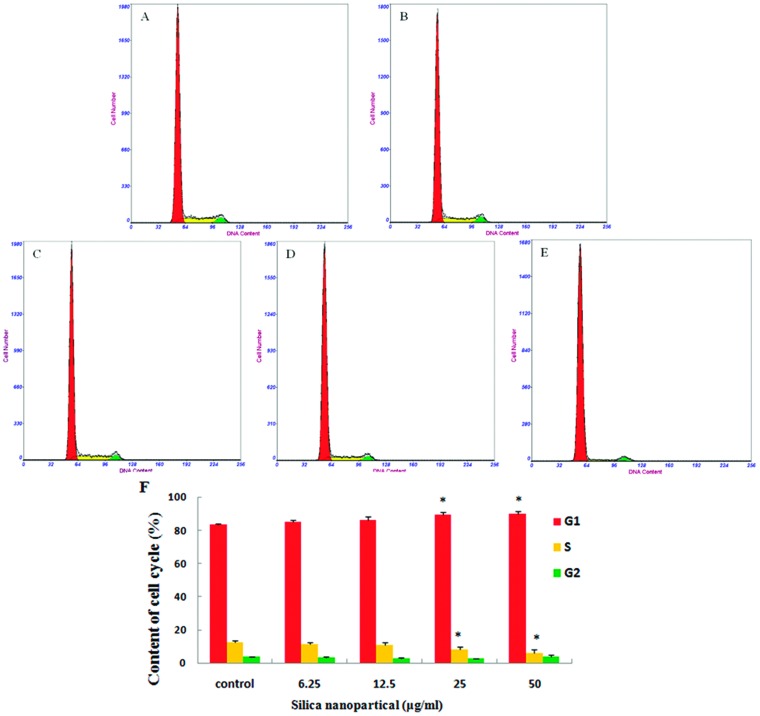
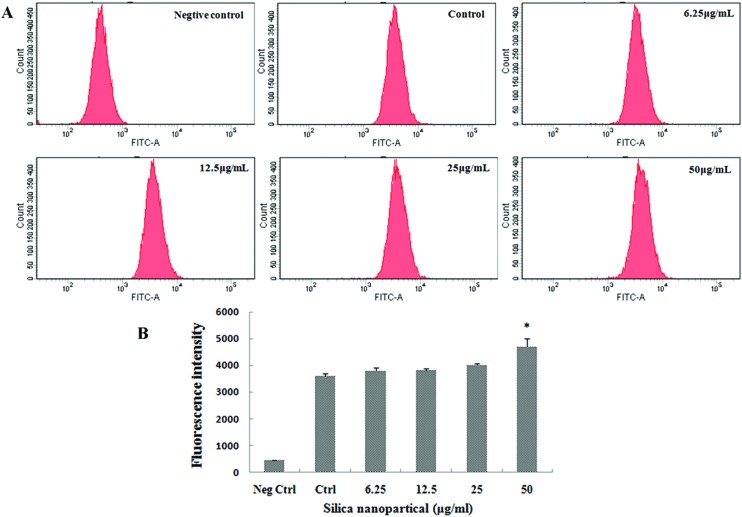
The distribution of GC-2spd cells in different phases of the cell cycle was analyzed through flow cytometry. The results of cell cycle analysis showed that the percentage of GC-2spd cells in the G0/G1 phase increased and the percentage in the S phase declined in a dose-dependent manner compared to the control group, and obvious differences were measured in the 25 and 50 μg ml–1 SiNPs groups (Fig. 6). The fluorescence of cells marked with CFDA-SE is uniform and stable, and the fluorescence of daughter cells will decline by half every time a cell divides. So, a stronger fluorescence intensity showed slower cell proliferation. In this study, the results of cell proliferation showed that the average fluorescence intensity increased significantly after exposure to 50 μg ml–1 SiNPs, compared with the control group (Fig. 7).
Fig. 6. Cycle arrest of GC-2spd cells induced by silica nanoparticles (A) control group, (B) 6.25 μg mL–1 SiNPs group, (C) 12.5 μg mL–1 SiNPs group, (D) 25 μg mL–1 SiNPs group, (E) 50 μg mL–1 SiNPs group, the cycle of GC-2spd cells treated with various concentrations of SiNPs for 24 h was measured by flow cytometry. The red, green, and yellow areas represent the G0/G1, S, and G2/M phases, respectively. (F) The proportions of G0/G1, S, and G2/M phase cells after exposure to silica nanoparticles (Mean ± S.E.) * indicates significant difference compared to control group (p < 0.05).
Fig. 7. Proliferation inhibition in GC-2spd cells induced by silica nanoparticles (A) proliferation of cells labelled with CFDA-SE was depicted by flow cytometry (B) histograms of proliferation showed that average fluorescence intensities in cells increased with the SiNP level, which indicated that proliferation was inhibited in the 50 μg mL–1 SiNPs group. The peak abscissa values were the average fluorescence intensities of cells (Mean ± S.E.). * indicates significant difference compared to control group (p < 0.05). Neg ctrl: negative control; Ctrl: control.
DNA damage
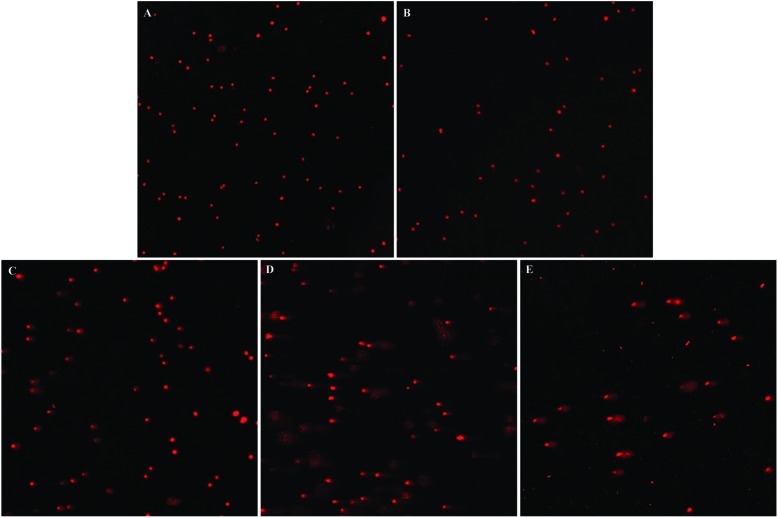
Comet assay is a sensitive and intuitionistic method for detecting DNA damage. SiNPs dose-dependently increased the numbers of DNA damaged cells (Fig. 8). Compared with the control group, the degree of DNA damage in the 6.25 μg ml–1 SiNPs group showed no significant difference. However, the length of tail and the percentage of tail DNA increased obviously in 12.5, 25, 50 μg ml–1 SiNPs groups, and the tail moment (TM) and Olive tail moment (OTM) significantly increased in the 25 and 50 μg ml–1 SiNPs groups (Table 2).
Fig. 8. DNA damage of GC-2spd cell lines induced by silica nanoparticles DNA damage of GC-2spd cells treated with various concentrations of SiNPs for 24 h was measured by comet assay. (A) Control group 200×, (B) 6.25 μg mL–1 SiNPs group 200×, (C) 12.5 μg mL–1 SiNPs group 200×, (D) 25 μg mL–1 SiNPs group 200×, (E) 50 μg mL–1 SiNPs group 200×.
Table 2. DNA damage of GC-2spd cells induced by silica nanoparticles (Mean ± S.E.).
| Concentration (μg mL–1) | Tail length (μm) | Tail DNA% | Tail moment (μm) | Olive tail moment |
| Control | 11.38 ± 1.84 | 12.09 ± 2.26 | 2.82 ± 0.73 | 2.56 ± 0.56 |
| 6.25 | 16.46 ± 2.36 | 15.21 ± 1.92 | 3.46 ± 0.69 | 3.50 ± 0.55 |
| 12.5 | 34.65 ± 3.38* | 23.28 ± 2.78* | 10.29 ± 1.82 | 8.57 ± 1.18 |
| 25 | 51.18 ± 3.06* | 39.86 ± 1.73* | 21.85 ± 1.81* | 15.67 ± 1.15* |
| 50 | 116.45 ± 15.01* | 42.28 ± 3.48* | 58.01 ± 11.24* | 37.08 ± 6.02* |
Discussion
With the continuous improvement of current social industrialization and increasing intensification of environmental pollution, the incidence rate of human reproductive dysfunction has been increasing unceasingly, human semen quality and sperm count have fallen significantly, and the number of infertile men worldwide may amount to at least 30 million.27 Sperm formation depends on the normal process of meiosis. In the process of meiosis, testicular environmental changes, both internal and external, caused by adverse environmental factors, will influence the normal functions of the reproductive cells. Due to their high chemical purity, large specific surface area and good dispersibility, silica nanoparticles were widely used in various fields. SiNPs, as drug and gene therapy vectors, can promote drugs through biological barriers, as well as improve drug targeting and bioavailability. Research has shown that snake-venom-loaded silica nanoparticles have therapeutic potential against prostate cancer, breast cancer and multiple myeloma cancer through inducing apoptosis and growth arrest.28–31 However, previous studies have also revealed that silica nanoparticles can pass through blood-testis barriers, induce a harmful effect on the male reproductive system and lead to a decrease in the quantity and quality of sperm in mice.21,32 The present study is the first to explore the effect of SiNPs on the cell cycle of spermatogenic cells and the process of meiosis. Our results in vivo showed that SiNPs damaged the histological structures of testicles and further decreased the quantity and quality of sperms as compared to the saline group on day 45 after the first dose. This is similar to the finding of Fan, which showed that SiNPs could damage the testicular tissue structures of rats and reduce the number of sperm after inhalation exposure.32 In order to explore the mechanism of male dyszoospermia, we analyzed the protein expressions of meiosis regulatory factors in testicular tissues. The present study showed that SiNPs down-regulated the protein expressions of Sohlh1, cyclin A1, CDK1, CDK2 and cyclin B1 in testicular tissue, which resulted in inhibition of the meiotic process. Sohlh1, a spermatogonium differentiation factor, controls the start of meiosis. The loss of Sohlh1 would induce infertility via disrupting spermatogonial differentiation into spermatocytes.33 A low expression of Sohlh1 suggested that SiNPs inhibited spermatophore development and the start of the meiosis process. Cell cycle regulator, cyclin A1, is expressed predominantly in the testis,34 and it is considered to mainly function in the meiosis process. CDK2 binds to cyclin A1 and then promotes entry of cells into the metaphase of meiosis I.35 A lack of CDK2 protein has been shown to result in sterility in male mice.36,37 Cyclin A1 also activates cyclin B1 at the meiotic phase of sperm cells to form a CDK1/cyclin B complex, which is known as a maturation promoting factor (MPF). MPF promotes cells to complete the G2/M phase transformation.38 Our results suggested that SiNPs could inhibit the start and process of meiosis through depressing the protein expressions of meiosis regulatory factors, and thereby decrease the numbers of spermatogenic cells and sperms.
The conversion of the cell cycle relies on the activation and expression of a series of cyclins and cyclin-dependent kinases.39 The normal process of cell proliferation is accomplished by orderly cell division cycles; arresting the cell cycle progression may result in proliferation inhibition.40 The present results in vitro showed that a large number of GC-2spd cells were arrested in the G0/G1 phase and cell proliferation was inhibited by SiNPs. Maybe, due to suppression of meiotic startup and a lack of meiotic cells, there was no significant change in the G2/M phase of the cell cycle. The cell cycle is mainly regulated by cell cycle checkpoint pathways, which would be activated in response to DNA damage.41 Cells exhibit a reversible cell cycle arrest in response to low levels of DNA damage, whereas a sustained cell cycle arrest occurs in response to a high level of DNA damage.42 We found a large scale of DNA fragmentation and a gradual reduction in cell viability, with an increase in the SiNP level in a dose-dependent manner in vitro. Possibly, SiNP-induced DNA damage can lead to cell cycle arrest and cell proliferation inhibition.
Many studies showed that reactive oxygen species (ROS) can cause DNA damage because free radicals (intermediate products of ROS) can directly act on nucleic acids and result in base modification and DNA strand breaks.31,43 The excessive generation of ROS and oxidative stress are considered to form an important mechanism of SiNP toxicity; nano materials induce mitochondrial dysfunction and cell membrane damage via oxidative stress, leading to cell death.44,45 Our study showed that the ROS level was increased in the SiNPs group on day 45; however, there was no significant difference between the saline group and the SiNPs group on day 75. The results of ROS indicated that nanoparticles may harm the male reproductive system, and that the damage recovers over time (by day 75). The present results for the sperm concentration and motility showed that they remained at a similar level between 45 D and 75 D within the SiNP treatment group, but the two parameters in the 75 D control group decreased when compared to these in the 45 D control group, which could be because the sperm parameters were not detected at the same time; as is already known, the sperm in vitro can survive for only a short time. The sperm concentration and motility rate in the SiNPs group on day 45 were lower than those in the control group and saline group, whereas there was no difference in the two parameters among the three groups on day 75. Therefore, we considered that the sperm concentration and motility were reversibly improved on day 75 after the first dose. In addition, the recovery of adverse effects induced by SiNPs on the protein expressions of meiotic regulating factors and the spermatogenic epithelium in the testicles on day 75 also supports this conclusion. This is similar to a previous result, which showed that carbon nanotubes generated oxidative stress in the testis at day 15, and the damage was repaired by days 60 and 90 in mice.46 Xu et al.21 also found that SiNPs could increase the MDA levels of testes in mice by day 35, and that this was repaired by day 60. Oxidative-stress-mediated DNA fragmentation is common in the spermatozoa of infertile men.47 Oxidative-stress-mediated injury to the male reproductive system is a significant contributing factor in 30–80% of cases of male infertility.48,49 These studies indicate that the oxidative stress induced by SiNPs in testicle tissues may be associated with damage to the meiotic process. So, it could be probable that oxidative stress vanishes, and the above damage was repaired or recovered as nanoparticles were excreted from the body or encapsulated in organelles by day 75. Our previous study showed that SiNPs were encapsulated by organelles in the testis at day 60.21 Besides, a study by Liu50et al. showed that mesoporous hollow silica nanoparticles (MHSNs) accumulated mainly in mononuclear phagocytic cells of the liver or spleen in mice, and these particles were excreted from the body after four weeks. In a word, damage to the male reproductive system caused by SiNPs may be reversible.
Conclusion
The present study showed that SiNPs inhibited protein expressions of meiotic regulating factors, Sohlh1, cyclin A1, CDK1, CDK2, and cyclin B1 in testicular tissues, destroyed testicular tissue structures, and decreased sperm quantity and quality in mice after 45-day treatments. However, all these changes were reversed by day 75. In vitro, SiNPs induced cycle arrest and proliferation inhibition due to DNA damage and a decrease in cell viability in GC-2spd lines. These results suggest that SiNPs might induce cell cycle arrest and proliferation inhibition by down-regulating the expressions of meiotic regulatory factors through causing DNA damage resulting from oxidative stress, leading to inhibition of the start and process of meiosis and thus decreasing sperm quality, which is shown in the schematic diagram of this mechanism (Fig. 9). The present results provide new experimental evidence for the potential mechanisms of the effect of nanoparticles on the male reproductive system.
Fig. 9. A schematic diagram of the mechanism of dyszoospermia in mice induced by silica nanoparticles.
Conflict of interest
The authors declare that all authors have no competing interests related to this manuscript.
Acknowledgments
The authors would like to thank to Professor Wensheng Yang from Jilin University for the preparation of SiNPs. This study was supported by Grants from Beijing Natural Science Foundation Program and the Scientific Research Key Program of Beijing Municipal Commission of Education (KZ201510025028).
References
- Barik T. K., Sahu B., Swain V. Parasitol. Res. 2008;103(2):253–258. doi: 10.1007/s00436-008-0975-7. [DOI] [PubMed] [Google Scholar]
- Park J. S., Park Y. J., Heo J. Waste Manage. 2007;27(9):1207–1212. doi: 10.1016/j.wasman.2006.08.010. [DOI] [PubMed] [Google Scholar]
- Contado C., Ravani L., Passarella M. Anal. Chim. Acta. 2013;788:183–192. doi: 10.1016/j.aca.2013.05.056. [DOI] [PubMed] [Google Scholar]
- Chen H., Mruk D. D., Xia W. Curr. Med. Chem. 2016;23(7):701–713. doi: 10.2174/0929867323666160112122724. [DOI] [PMC free article] [PubMed] [Google Scholar]
- Badr G., Sayed D., Maximous D. Cell. Physiol. Biochem. 2014;34(5):1640–1651. doi: 10.1159/000366366. [DOI] [PubMed] [Google Scholar]
- Al-Sadoon M. K., Rabah D. M., Badr G. Cell. Immunol. 2013;284(1):129–138. doi: 10.1016/j.cellimm.2013.07.016. [DOI] [PubMed] [Google Scholar]
- Badr G., Al-Sadoon M. K., Abdel-Maksoud M. A. PLoS One. 2012;7(12):e51661. doi: 10.1371/journal.pone.0051661. [DOI] [PMC free article] [PubMed] [Google Scholar]
- Radu D. R., Lai C. Y., Jeftinija K. J. Am. Chem. Soc. 2004;126(41):13216–13217. doi: 10.1021/ja046275m. [DOI] [PubMed] [Google Scholar]
- Lin Y. S., Tsai C. P., Huang H. Y. Chem. Mater. 2005;17(18):4570–4573. [Google Scholar]
- Fu C., Liu T., Li L. Biomaterials. 2013;34(10):2565–2575. doi: 10.1016/j.biomaterials.2012.12.043. [DOI] [PubMed] [Google Scholar]
- Oberdörster G., Maynard A., Donaldson K. Part. Fibre Toxicol. 2005;2(1):1. doi: 10.1186/1743-8977-2-8. [DOI] [PMC free article] [PubMed] [Google Scholar]
- Oberdörster G., Oberdörster E., Oberdörster J. Environ. Health Perspect. 2005:823–839. doi: 10.1289/ehp.7339. [DOI] [PMC free article] [PubMed] [Google Scholar]
- Kaewamatawong T., Shimada A., Okajima M. Toxicol. Pathol. 2006;34(7):958–965. doi: 10.1080/01926230601094552. [DOI] [PubMed] [Google Scholar]
- Kim J. S., Yoon T. J., Yu K. N. Toxicol. Sci. 2006;89(1):338–347. doi: 10.1093/toxsci/kfj027. [DOI] [PubMed] [Google Scholar]
- Nishimori H., Kondoh M., Isoda K. Eur. J. Pharm. Biopharm. 2009;72(3):496–501. doi: 10.1016/j.ejpb.2009.02.005. [DOI] [PubMed] [Google Scholar]
- Duan J., Yu Y., Li Y. Biomaterials. 2013;34(23):5853–5862. doi: 10.1016/j.biomaterials.2013.04.032. [DOI] [PubMed] [Google Scholar]
- Fruijtier-Pölloth C. Toxicology. 2012;294(2):61–79. doi: 10.1016/j.tox.2012.02.001. [DOI] [PubMed] [Google Scholar]
- Guichard Y., Fontana C., Chavinier E. Toxicol. Ind. Health. 2015:0748233715572562. doi: 10.1177/0748233715572562. [DOI] [PubMed] [Google Scholar]
- Duan J., Yu Y., Li Y. Nanotoxicology. 2015:1–11. [Google Scholar]
- Zhao C., Jin Y., Zhang Y. J. Hyg. Res. 2007;36(4):414–416. [PubMed] [Google Scholar]
- Xu Y., Wang N., Yu Y. PLoS One. 2014;9(7):e101572. doi: 10.1371/journal.pone.0101572. [DOI] [PMC free article] [PubMed] [Google Scholar]
- Sun L., Li Y., Liu X. Toxicol. In Vitro. 2011;25(8):1619–1629. doi: 10.1016/j.tiv.2011.06.012. [DOI] [PubMed] [Google Scholar]
- Martins M., Silva J. Anat., Histol., Embryol. 2001;30(3):129–132. [PubMed] [Google Scholar]
- Jiang Q.-guan and Yu Y.-qiang, Male reproductive toxicology, Peking Union Medical College and Beijing medical university joint publishing house, Beijing, 1994, ch. 2, pp. 8–9. [Google Scholar]
- Berridge M. V., Tan A. S. Arch. Biochem. Biophys. 1993;303(2):474–482. doi: 10.1006/abbi.1993.1311. [DOI] [PubMed] [Google Scholar]
- Guo C., Xia Y., Niu P., Jiang L., Duan J., Yu Y., Li Y., Sun Z. Int. J. Nanomed. 2015;10:1463–1477. doi: 10.2147/IJN.S76114. [DOI] [PMC free article] [PubMed] [Google Scholar]
- Agarwal A., Mulgund A., Hamada A. Reprod. Biol. Endocrinol. 2015;13:37–46. doi: 10.1186/s12958-015-0032-1. [DOI] [PMC free article] [PubMed] [Google Scholar]
- Badr G., Al-Sadoon M. K., Rabah D. M. Apoptosis. 2013;18(3):300–314. doi: 10.1007/s10495-012-0787-1. [DOI] [PubMed] [Google Scholar]
- Badr G., Al-Sadoon M. K., Rabah D. M. Free Radical Biol. Med. 2013;65:175–189. doi: 10.1016/j.freeradbiomed.2013.06.018. [DOI] [PubMed] [Google Scholar]
- Sayed D., Al-Sadoon M. K., Badr G. Oxid. Med. Cell. Longevity. 2012;2012:386286. doi: 10.1155/2012/386286. [DOI] [PMC free article] [PubMed] [Google Scholar]
- Badr G., Al-Sadoon M. K., El-Toni A. M. Lipids Health Dis. 2012;11(1):1. doi: 10.1186/1476-511X-11-27. [DOI] [PMC free article] [PubMed] [Google Scholar]
- Fan Y. O., Zhang Y. H., Zhang X. P. J. Hyg. Res. 2006;35(5):549–553. [PubMed] [Google Scholar]
- Ballow D., Meistrich M. L., Matzuk M. Dev. Biol. 2006;294(1):161–167. doi: 10.1016/j.ydbio.2006.02.027. [DOI] [PubMed] [Google Scholar]
- Ge S. Q., Kang X. J., Liu G. R. Hereditas. 2008;30(1):3–12. doi: 10.3724/sp.j.1005.2008.00003. [DOI] [PubMed] [Google Scholar]
- Wolgemuth D. J., Laurion E., Lele K. M. Recent Prog. Horm. Res. 2002;57(1):75–101. doi: 10.1210/rp.57.1.75. [DOI] [PubMed] [Google Scholar]
- Nickerson H. D., Joshi A., Wolgemuth D. J. Dev. Biol. 2007;306(2):725–735. doi: 10.1016/j.ydbio.2007.04.009. [DOI] [PMC free article] [PubMed] [Google Scholar]
- Berthet C., Aleem E., Coppola V. Curr. Biol. 2003;13(20):1775–1785. doi: 10.1016/j.cub.2003.09.024. [DOI] [PubMed] [Google Scholar]
- Godet M., Thomas A., Rudkin B. B. Eur. J. Cell Biol. 2000;79(11):816–823. doi: 10.1078/0171-9335-00107. [DOI] [PubMed] [Google Scholar]
- Weinert T. Cell. 1998;94(5):555–558. doi: 10.1016/s0092-8674(00)81597-4. [DOI] [PubMed] [Google Scholar]
- Tamura R. E., de Vasconcellos J. F., Sarkar D. Curr. Mol. Med. 2012;12(5):634–651. doi: 10.2174/156652412800619978. [DOI] [PMC free article] [PubMed] [Google Scholar]
- Medema R. H., Macůrek L. Oncogene. 2012;31(21):2601–2613. doi: 10.1038/onc.2011.451. [DOI] [PubMed] [Google Scholar]
- Lukin D. J., Carvajal L. A., Liu W. Mol. Cancer Res. 2015;13(1):16–28. doi: 10.1158/1541-7786.MCR-14-0177. [DOI] [PMC free article] [PubMed] [Google Scholar]
- Trinei M., Giorgio M., Cicalese A. Oncogene. 2002;21(24):3872–3878. doi: 10.1038/sj.onc.1205513. [DOI] [PubMed] [Google Scholar]
- Liu X., Sun J. Biomaterials. 2010;31(32):8198–8209. doi: 10.1016/j.biomaterials.2010.07.069. [DOI] [PubMed] [Google Scholar]
- Xu P., Xu J., Liu S. J. Hazard. Mater. 2012;241:279–286. doi: 10.1016/j.jhazmat.2012.09.041. [DOI] [PubMed] [Google Scholar]
- Bai Y. H., Zhang Y., Zhang J. P., Mu Q. X., Zhang W. D. Nat. Nanotechnol. 2010;5(9):683–689. doi: 10.1038/nnano.2010.153. [DOI] [PMC free article] [PubMed] [Google Scholar]
- Sergerie M., Laforest G., Bujan L., Bissonnette F., Bleau G. Hum. Reprod. 2005;20(12):3446–3451. doi: 10.1093/humrep/dei231. [DOI] [PubMed] [Google Scholar]
- Tremellen K. Hum. Reprod. Update. 2008;14(3):243–258. doi: 10.1093/humupd/dmn004. [DOI] [PubMed] [Google Scholar]
- Saleh R. A., Agarwal A. J. Androl. 2002;23(6):737–752. [PubMed] [Google Scholar]
- Liu T., Li L., Teng X. Biomaterials. 2011;32(6):1657–1668. doi: 10.1016/j.biomaterials.2010.10.035. [DOI] [PubMed] [Google Scholar]


