 T-2 and modified T-2s are cytotoxic. Activation of the JAK/STAT pathway in RAW264.7 cells by T-2 was greater in hepatopancreas and muscle extracts from Litopenaeus vannamei.
Abstract
T-2 can be biotransformed in animal tissues to modified T-2s (mT-2s). Food contaminated with T-2 and/or mT-2s is a hazard to both animals and humans, including the immune system. In this study, Litopenaeus vannamei were fed T-2 orally for 20 d, and hepatopancreas and muscle extracts, T-2, and T-2-glucuronide (T-2-GluA) were added to RAW264.7 in vitro and their effects on the JAK/STAT pathway were examined. STAT2 mRNA gene expression induced by hepatopancreas and muscle extracts was markedly higher compared with that of T-2 or T-2-GluA group. SCOSs, IL-6 and IL-1β mRNA gene expressions induced by hepatopancreas extract were greater than those induced by muscle extract. Muscle extract significantly activated STAT3 phosphorylation but inhibited STAT1 phosphorylation. Activation of the JAK/STAT pathway by hepatopancreas mT-2s was significantly higher than that by muscle extracts. Muscle and hepatopancreas extracts and T-2 also significantly induced IL-6 mRNA gene expression. With reference to phosphorylation levels, significant activation of JAK1 and STAT2 occurred with T-2 and JAK3 by muscle extract, JAK2 by hepatopancreas extract and STAT1 by T-2-GluA. This study showed that both T-2 and mT-2s are cytotoxic but the activation of the JAK/STAT pathway in RAW264.7 cells by T-2 was greater than that by mT-2s in hepatopancreas and muscle extracts from T-2-fed Litopenaeus vannamei.
1. Introduction
T-2 toxin (T-2) is produced by type A trichothecenes of Fusarium spp. fungi.1–3 It can contaminate animal feed,3,4 including shrimp feed. Shrimp can metabolize T-2 by phase I and phase II biotransformation enzymes to form modified T-2 toxins (mT-2s).5 A modified toxin is one that has undergone matrix-associated chemical or biological modification6,7 within an organism. It is very complex and might form a hazard to animal and human health because it is possibly converted back to its free toxin form in the digestive tract of mammals, and may consequently contribute to an unexpected high toxicity.
HT-2 G toxin (HT-2-G) and T-2-glucosides (T-2-G) are two of the common mT-2s in animals8,9 and plants. Busman, M. et al. determined T-2 G and HT-2 G via LC-MS/MS during fermentation of Fusarium sporotrichioides.10 Konigs, M. et al. identified T-2 metabolites as HT-2, neosolaniol, T-2-triol and T-2-tetraol in two human primary culture cells.11 Our studies have shown that free T-2 cannot be detected in the muscle and hepatopancrea extracts of shrimp fed with T-2 at doses even as high as 12.2 mg kg–1 for 20 d. However, the tissues from these shrimp were toxic to rats. Moreover, HT-212 and T-2 G could be found in shrimp fed with T-2 for 20 d in other different doses. This suggested that T-2 was transformed in shrimp tissues to another form such as mT-2s13 and that these mT-2s were toxic, and it is also possible that some of this mT-2 was converted back to its free T-2 by the gastrointestinal enzymes in those rats. In either case, it presents a potential additional food hazard6,7,14 that has not been recognised before. Therefore, it is important to understand the bioavailability, fate and toxicity of mT-2s in food-producing animals. Studies related to biotransformation of T-2 to mT-2s in different species and different tissues are scarce or non-existent. T-2-glucuronide (T-2-GluA) is one of the mT-2s identified by T. Welsch and H. U. Humpf,9 and T-2-GluA is the most representative in mT-2s toxicity studies because it could directly convert back to free T-2. Research is also lacking on mT-2s toxicity to the immune system.
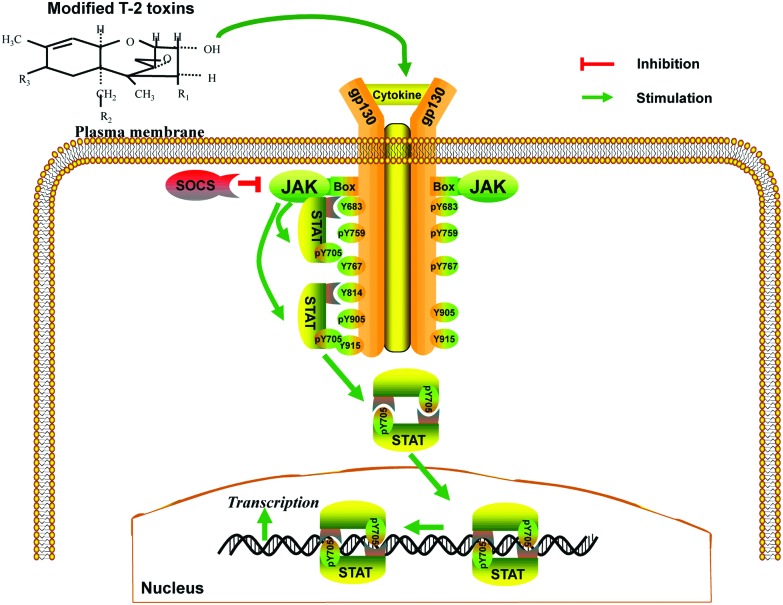
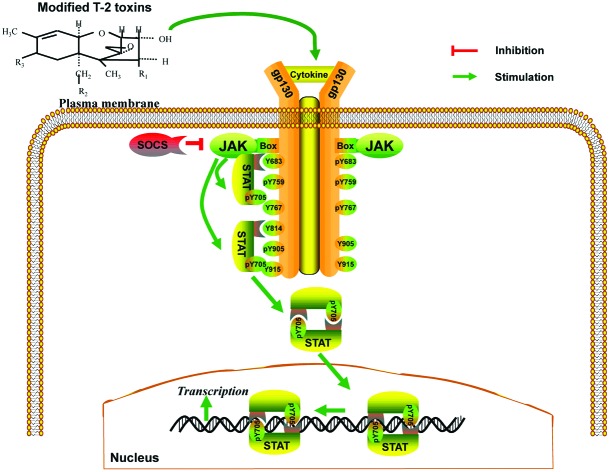
The Janus kinase (JAK) and the signal transducers and activators of the transcription (STAT) signal pathway belong to a handful of pleiotropic cascades used to transduce a multitude of signals to maintain homeostasis in animals.15,16 It is a very common and sensitive signal pathway in molecular immune toxicity. T-2 has high immune toxicity, and therefore the JAK/STAT signal pathway was used in this study. Previous research has shown that T-2 has a marked effect on the immune system, including up-regulation of messenger RNA (mRNA) expression of inflammatory factors such as interleukin (IL)-6, IL-1β, tumor necrosis factor-α (TNF-α), JAK1–2, STAT1–3, and suppressors of cytokine signaling members (SOCS), and activates the tyrosine phosphorylation of STAT1 and STAT3 in RAW264.7 murine macrophages in a dose-dependent manner.17,18 Therefore, the JAK/STAT pathway in RAW264.7 murine macrophages was used to study immune toxicity related to T-2 and mT-2s in shrimp. We hypothesized that mT-2s could regulate and control inflammatory factors via the JAK/STAT pathway in RAW264.7. We believe that mT-2s will up-regulate the mRNA gene expression of inflammatory factors, form dimers with the receptors and activate the JAK/STAT pathway in RAW264.7 (Fig. 1). The inflammatory factors, SOCSs, JAKs and STATs, are regarded as a critical gene family in RAW264.7.15,16 Quantitative real-time PCR (qRT-PCR) and Western blot were used to study gene and protein expression, respectively, of the JAK/STAT gene family in RAW264.7 exposed to mT-2s from shrimp hepatopancreas and muscle extracts.
Fig. 1. A hypothetical pathway to show the effects of tissue mT-2s on JAK/STAT pathway regulation in RAW264.7 murine macrophages of shrimp exposed orally to T-2.
2. Experimental
2.1. Animals and chemicals
Litopenaeus vannamei (weighing 7.0 ± 0.5 g) were purchased from the aqua-farm of East Island (Zhanjiang, China) and raised in 150 L seawater (pH = 7.47–7.64) tanks with continuous aeration and a photoperiod of a 14 h : 10 h light/dark cycle at 25 ± 1 °C. T-2 was purchased from Enzo (≥98% purity, USA). T-2-GluA was synthesized in our laboratory (unpublished observation).
2.2. T-2 infected shrimp
Based on our previous studies, a sub-lethal T-2 dose of 12.2 mg kg–1 in feed was given to shrimp for 20 d. The control shrimp were given the same feed but without T-2. This study was approved by the Animal Welfare Committee of Guangdong Ocean University (Approval # SYXK 2014-0053).
The shrimp (n = 180) were randomly transferred to six tanks containing 150 L of seawater with 30 shrimp in each tank and acclimatized for 7 days, prior to the experiment. Shrimp in three tanks (n = 90) acted as the controls and the shrimp in the remaining three tanks were given T-2 at 12.2 mg kg–1 in feed for 20 d. The shrimp were fed three times per day at 5% body mass per day.19 Approximately one-third of the seawater in the tank was changed daily at 9:00 a.m. All shrimp were sacrificed on ice on day 21, and their hepatopancreas and muscle were removed and stored at –80 °C until use.
2.3. Extraction of toxins
The extraction of T-2 and its metabolites was carried out as described previously.12 Approximately 5 g of hepatopancreas and 10 g of muscle were pooled from 10 shrimp per tank (30 T-2-dosed and 30 controls) in triplicate (totalling 180 shrimp) and added to 80% (v/v) ethyl acetate solution at a ratio of 1 : 1 (w/v). The tissues were homogenized (IKAT25, Staufen, Germany) for 1 min at 10 000 rpm, subjected to ultrasonication (AS324, JieKang, China) for 15 min, oscillated (Multi Reax, Heidolph, Germany) at 2000 rpm for 10 min, and centrifuged (3–18 K, Sigma, America) at 8000 rpm for 10 min. The supernatant was collected and the solid residue extracted twice as described above. The supernatants were stored at –20 °C until use.
2.4. Tissue T-2 analyses
The hepatopancreas and muscle supernatants were dried at 60 °C in a nitrogen (N2) stream. One-third of the supernatant was dissolved with 70% methanol (w/v) and filtered with 0.22 μm polyamide, (Tianjin, China) and the T-2 concentration was measured by LC-MS/MS (Thermo, USA).12
2.5. Tissue T-2 analyses following trifluoroacetic acid (TFA) treatment
If T-2 was not detected by LC-MS/MS, as described in 2.4, the remaining half of the supernatant was dissolved in 1 mL of ethyl acetate. The dissolved, enriched supernatant was transferred to a reaction bottle (resistant to high temperature and high pressure) and hydrolyzed with 10 mL of 1.5 M TFA solution (dissolved in ethyl acetate : water solution [9 : 1; v/v]) at 130 °C for 50 min.
The samples were allowed to cool for 2 h at room temperature; 10 mL ethyl acetate was added; the mixture was transferred to a 50 mL centrifuge tube and ultrasonicated for 10 min, followed by oscillation for a further 10 min prior to centrifugation at 1500g for 10 min. The supernatant was collected and this process was repeated twice. The supernatants were pooled, enriched with N2 gas and stored at –20 °C. The enriched supernatant was subjected to LC-MS/MS to determine the T-2 concentration.
2.6. RAW 264.7 cell culture and treatment with toxins
RAW264.7 was obtained from the Cell Bank (Shanghai, China). The cells were cultured in Dulbecco's Modified Eagle's Medium (Gibco, USA) supplemented with 10% (v/v) heat-inactivated fetal bovine serum (Gibco, USA), 100 units per mL penicillin (Gibco, USA), and 100 μg mL–1 streptomycin (Gibco, USA) in an incubator humidified with 95% air and 5% CO2 at 37 °C.
The cells (1 × 10⁶ mL–1) were seeded in six-well plates with 2 mL of medium and incubated for 24 h before treatment with the toxins. The shrimp hepatopancreas and muscle extracts from the controls (no T2) and from the T-2-dosed (12.2 mg kg–1 T-2) with 0.1% DMSO (Sigma, America), T-2 (60 nM), T-2-GluA (10 μM), 2 mL each, were added to the seeded six-well plates, incubated for 24 h and the half maximal inhibitory concentration (IC50) was determined.
2.7. Total mRNA isolation and quantitative real-time PCR
Six members of the JAK/STAT pathway (JAK1, JAK2, JAK3, STAT1, STAT2, and STAT3), three from the SOCS gene family (SOCS2, SOCS3, and CIS), and three inflammatory cytokines (IL-6, IL-1β, and TNF-α) were subjected to qRT-PCR, following exposure of the RAW264.7 cells to different treatments described in section 2.6.
Briefly, total RNA was isolated from RAW264.7 using TRIzol Reagent (Thermol, USA) according to the manufacturer's instructions and stored at –80 °C until use. One microgram of RNA was reverse-transcribed to complementary DNA (cDNA) with the ReverTra Ace First Strand cDNA Synthesis Kit (Vazyme, USA). The cDNA was amplified by qRT-PCR (Bio-RAD, USA) using a SYBR Premix Ex Taq RT-PCR kit (Vazyme, USA). Each 20 μL reaction mixture consisted of 10 μL 2× SYBR Premix Ex Taq, 0.5 μL of each primer (10 μM), 5 μL of cDNA, and 4 μL of RNase-free dH2O. Cycling conditions were as follows: step 1, 5 min at 95 °C; step 2, 40 cycles at 95 °C for 10 s, 60 °C for 34 s; step 3, dissociation stage, from 60 °C to 95 °C. Data were analyzed using the complementary computer software. Relative quantification of gene expression was calculated using the 2–ΔΔCt data analysis method as previously described.20,21 Data were then normalized to β-actin in each sample. Primers used in this study are shown in Table 1.
Table 1. Primers used for quantitative real-time PCR.
| Primer | Sequence (5′–3′) | Primer length |
| β-Actin | Fwd: ATGTGGATCAGCAAGCAGG | 107 |
| Rev: GTCAAAGAAAGGGTGTAAAACG | ||
| JAK1 | Fwd: ATGCCCACCATTACCTCTGT | 133 |
| Rev: ATCCCCTCTTCACTCCCTTC | ||
| JAK2 | Fwd: CATAGACGAGTCAACCAGGCA | 136 |
| Rev: AAAGTCATCAAGCAGAGGAGC | ||
| JAK3 | Fwd: GGAGGTCGTGGATGGTGAGA | 125 |
| Rev: GCGGGTAGGATACTTGGCT | ||
| STAT1 | Fwd: AACCTTCCTCCTCTTCCAGC | 142 |
| Rev: CAATTTCACCAACAGTCTCAGC | ||
| STAT2 | Fwd: ACATCACAACCAACGAAAACC | 108 |
| Rev: GAGTCCATCCCAAGAGTCCA | ||
| STAT3 | Fwd: GGAGCAGAGATGTGGGAATG | 143 |
| Rev: CAACTGGCAAGGAGTGGGT | ||
| IL-6 | Fwd: GGAAATGAGAAAAGAGTTGTGC | 131 |
| Rev: CCTGATTATATCCAGTTTGGTAGC | ||
| IL-1β | Fwd: ATCAGCACCTCACAAGCAGA | 129 |
| Rev: GGGGAAGGCATTAGAAACAG | ||
| TNF-α | Fwd: CCTCTCATGCACCACCATC | 104 |
| Rev: AGGCAACCTGACCACTCTCC | ||
| SOCS2 | Fwd: TGCTTTCTTTCCTATGGCTGC | 101 |
| Rev: CCTTTCCTTGGGACATTTTG | ||
| SOCS3 | Fwd: AGATGGAGGGTTCTGCTTTG | 113 |
| Rev: GCCTATTGGCTGTGTTTGG | ||
| CIS | Fwd: CTCCCACTCTTCTCCTCACAG | 119 |
| Rev: ATAAGCATCCACTTCCCGAC |
2.8. RAW264.7 Western blot analysis
Protein extraction
Following incubation of RAW264.7 cells with each toxin (as described in section 2.6) for 24 h, the cells were harvested and washed with cold PBS twice to remove the toxins. The cells were lysed with lysis buffer (Beyotime, Beijing, China). The lysate was centrifuged at 12 000g for 5 min at 4 °C. The protein concentration of the supernatant was measured with the bicinchoninic acid protein assay (Beyotime, Beijing, PR China).
Western blot
Equal amounts of proteins (60 μg) were mixed 1 : 4 with the loading sample buffer (20% glycerol, 4% SDS, 10% β-mercaptoethanol, 0.05% bromophenol blue, 1.25 M Tris-HCl, pH 6.8), boiled for 5 min, loaded onto 10% SDS-polyacrylamide gel, and allowed to run at 24 V for 2.5 h. Proteins were transferred to polyvinylidene difluoride (PVDF) membrane for 1.5–2 h at 100 V on Trans-Blot Cells (Beyotime, Beijing, PR China). The membranes were blocked with 5% non-fat milk in TBST (Tris-buffered saline with 0.1% Tween-20) for 1 h, washed, and then incubated with the primary antibody (diluted 1 : 1000 in 5% non-fat milk in TBST) overnight at 4 °C. The membranes were washed three times with TBST and incubated for 1 h with the horseradish peroxidase-conjugated secondary anti-IgG antibody using a dilution rate of 1 : 200 in 5% non-fat milk in TBST. The membranes were further washed four times in TBST. Immunoreactive bands were visualized with a chemiluminescent substrate (ECL-Plus, Fuji super rx-n-c) for 2–5 min. Images were captured with a LAS-4000 luminescent image analyzer (Plustek, sw500).
2.9. Statistical analyses
Statistical analysis was performed by comparing the treatment groups with the controls using the SPSS 22.0 program for Windows. All results are presented as mean ± SEM. Group differences were analyzed using one-way ANOVA, followed by Duncan's post hoc tests. A probability of p < 0.05 was considered significant.
3. Results
3.1. Free T-2 analyses in shrimp tissues
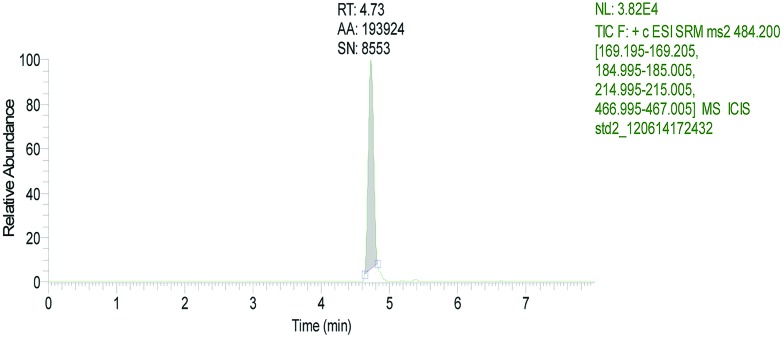
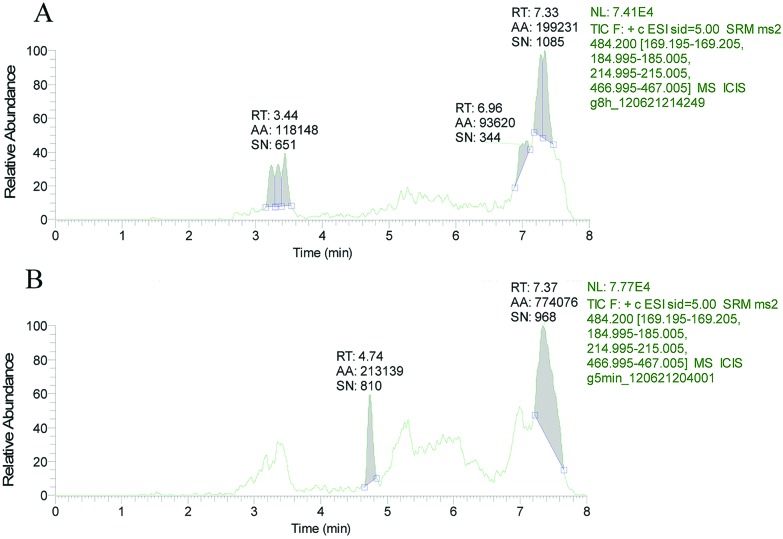
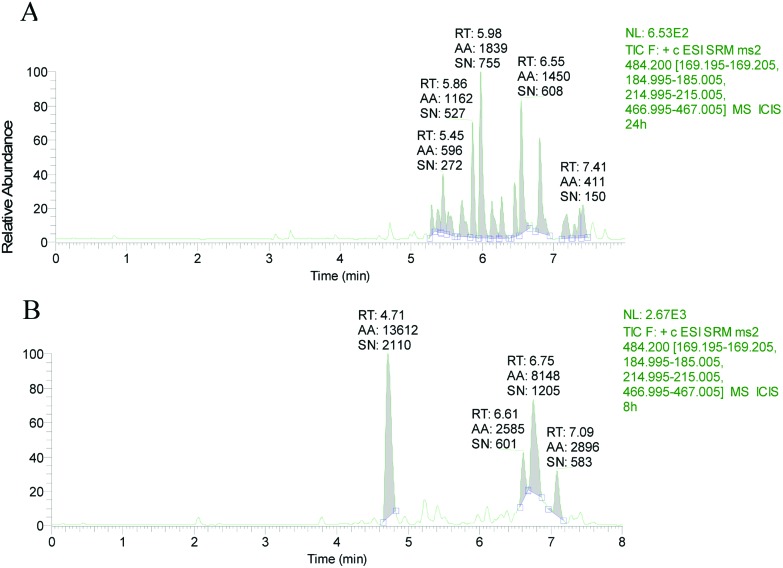
The retention time of T-2 in LC-MS/MS was 4.73 min (Fig. 2). No T-2 was detected in ethyl acetate extracts of shrimp muscle and hepatopancreas exposed to T-2 (Fig. 3A and 4A). In contrast, following TFA hydrolysis, T-2 could be detected in both the muscle and hepatopancreas extract (Fig. 3B and 4B). This suggested that mT-2s existed in the muscle and hepatopancreas extract of shrimp fed with T-2 orally for 20 days.
Fig. 2. Total ion chromatograms of T-2 standard solution.
Fig. 3. Total ion chromatogram of hepatopancreas extract (A) before and (B) after TFA hydrolysis.
Fig. 4. Total ion chromatograms of muscle extract (A) before and (B) after TFA hydrolysis.
3.2. mRNA expression of IL-6, IL-1β, and TNF-α by each toxin
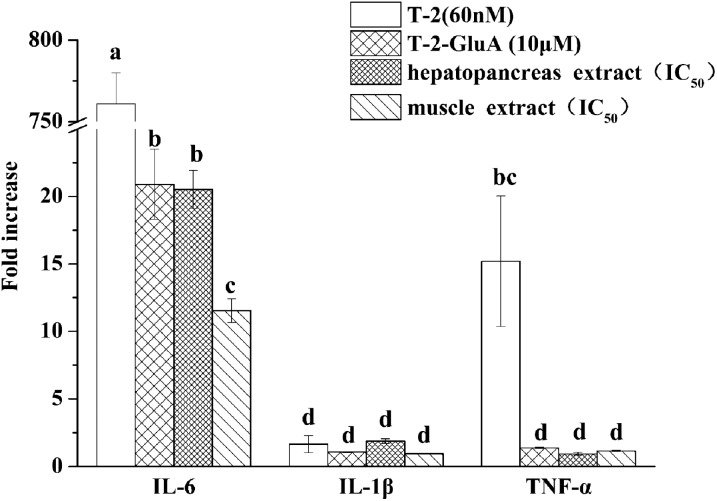
IL-6, IL-1β and TNF-α are pro-inflammatory cytokines. Following treatment of RAW264.7 cells with T-2 (60 nM), T-2-GluA (10 μM), and hepatopancreas and muscle extracts of shrimp dosed with T-2, IL-6 mRNA gene expressions were significantly increased 761-, 21-, 21-, and 12-fold, respectively (Fig. 5). Compared to IL-6 mRNA gene expression mediated by three types of mT-2s, T-2 induction of IL-6 mRNA gene expression was markedly higher. However, mRNA gene expression of IL-1β and TNF-α was not affected by most treatments except that T-2 induced TNF-α mRNA gene expression up to 15-fold.
Fig. 5. mRNA expression of IL-6, IL-1β and TNF-α by toxins in RAW264.7. The cells were treated with T-2 (60 nM), T-2-GluA (10 μM), hepatopancreas or muscle extract for 24 h. Data are presented as mean ± SEM. Bars with different letters are significantly different (p < 0.05).
3.3. mRNA expression of SOCS family by each toxin
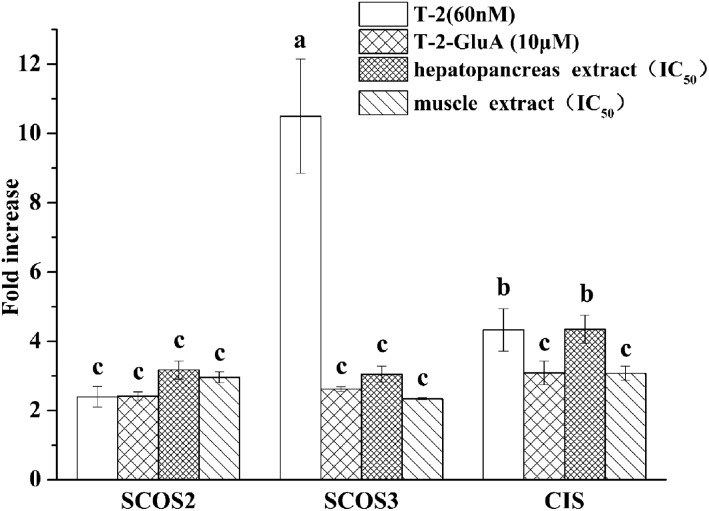
SOCS2, SOCS3, and CIS belong to the SOCS family. The JAK/STAT pathway is closely related to pro-inflammatory cytokine function. Members of the SOCS family provide negative feedback when pro-inflammatory cytokines appear excessive in the JAK/STAT pathway. SOCS2 and CIS mRNA gene expressions were only mildly induced, whereas SOCS3 mRNA gene expression was significantly (10-fold) induced by T-2 (Fig. 6). SOCSs mRNA gene expression induced by the hepatopancreas extract was higher than that induced by the muscle extract.
Fig. 6. mRNA expression of SOCS2, SOCS3, and CIS by toxins in RAW264.7. The cells were treated with T-2 (60 nM), T-2-GluA (10 μM), hepatopancreas or muscle extract for 24 h. Data are presented as mean ± SEM. Bars with different letters are significantly different (p < 0.05).
3.4. JAKs and STATs gene expression
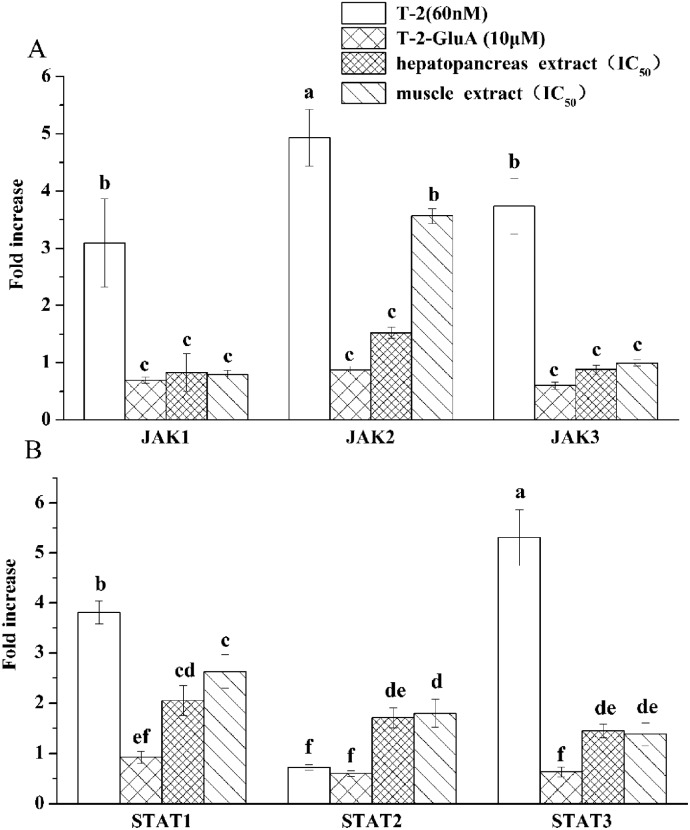
All treatments induced the gene expression of JAK1, JAK2 and JAK3 in RAW264.7 with T-2 > muscle extract > hepatopancreas extract > T-2-GluA (Fig. 7). T-2 markedly induced STAT1 and STAT3 mRNA gene expression (Fig. 7B). STAT1 and STAT3 mRNA gene expressions were also induced with muscle extract > hepatopancreas extract > T-2-GluA. STAT2 mRNA gene expressions induced by hepatopancreas and muscle extracts were higher than those induced by T-2 and T-2 GluA, being different from STAT1 and STAT3 mRNA gene expressions.
Fig. 7. mRNA gene expression of (A) JAKs and (B) STATs by T-2 and mT-2s in RAW264.7 cells. The cells were treated with T-2 (60 nM), T-2-GluA (10 μM), hepatopancreas or muscle extract for 24 h. Data are presented as mean ± SEM. Bars with different letters are significantly different (p < 0.05).
3.5. Phosphorylation of JAKs and STATs
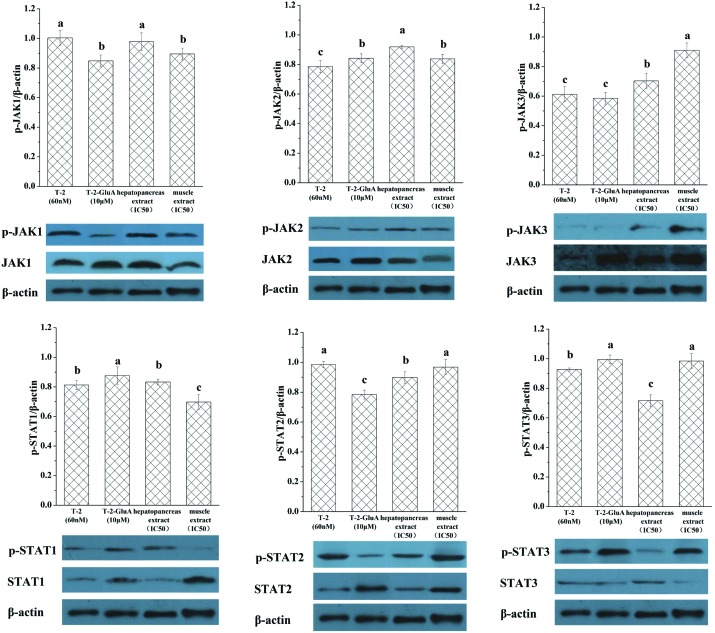
The phosphorylation levels (Fig. 8) of JAK1 and STAT2 induced by T-2 and levels of JAK3 induced by muscle extract were significantly different from other treatments. Phosphorylation levels of STAT1 and JAK2 were significantly induced by T-2-GluA and hepatopancreas extract, respectively. The phosphorylation levels of JAK3 induced by T-2 and T-2-GluA, STAT1 induced by muscle extract, and STAT3 induced by hepatopancreas extract were so low that a band was not visible.
Fig. 8. Protein expression of JAKs, p-JAKs, STATs and p-STATs induced by toxins in RAW264.7 cells. The cells were treated with T-2 (60 nM), T-2-GluA (10 μM), hepatopancreas, or muscle extracts for 24 h. β-Actin was used as an equal loading control. Data are presented as mean ± SEM. Bars with different letters are significantly different (p < 0.05).
4. Discussion
In this study, RAW264.7 cells were exposed to mT-2s from shrimp hepatopancreas and muscle extracts, T-2 and T-2-GluA, to investigate differential toxicities to the JAK/STAT signal pathway.
Direct detection of mT-2s is not possible with currently available analytical techniques. Yang Liu et al.22 and Berthiller, F. et al.23,24 used trichloroacetic acid (TCA) hydrolysis to dissociate modified DON in wheat to convert it into the free form, which was subsequently detected by LC-MS/MS, to determine the concentration of the modified DON. Our studies have shown that free T-2 is not detected in the muscle and hepatopancreas of shrimp fed with T-2 at doses even as high as 12.2 mg kg–1 in feed for 20 days but was toxic to rats fed with tissues from these shrimp (Unpublished observations). However, the two tissue extracts when subjected to TFA hydrolysis or T-2-immunoglobulin Magnetic Beads-Enzyme Linked Immunosorbent Assay (T2-IMB-ELISA) (Unpublished observation) showed a dose-dependent increase in free T-2. These results suggest that mT-2s in the extract were converted back to the T-2 toxin. In this study also, free T-2 could not be detected in the muscle and hepatopancreas extracts (Fig. 3A and 4A) but was detected following the TFA hydrolysis (Fig. 3B and 4B). This shows that consuming foods containing mT-2s is toxic because these are converted to free T-2 in the digestive tract of humans and animals.
T-2 induces a dramatic increase in IL-6 indicating a T-2-induced inflammatory response.17,25,26 Qinghua Wu et al.17 reported a significant increase in IL-6 by T-2 with specific inhibitors for JNK1, p38, and ERK in RAW264.7. Xiaorong Zhou et al. showed increased IL-6 gene expression in serum and cartilages in a group of rats and in selenium-deficient children suffering from Kashin–Beck disease exposed to T-2.25 Yang Fu et al. observed a significant increase of IL-Iβ and IL-6 in supernatants of chondrocytes cultivated for 24 h with T-2 at 8 ng mL–1, following phorbol 12-myristate 13-acetate stimulation of human fetal chondrocytes in vitro.26 Of the macrophage pro-inflammatory cytokines investigated, IL-6 gene expression was significantly elevated by mT-2s of the shrimp muscle and hepatopancreas extracts and also by T-2 and T-2-GluA (Fig. 5). Induction of IL-6 mRNA expression by hepatopancreas and muscle extract mT-2s was weaker than with free T-2. A majority of mRNA gene expressions induced by mT-2s in hepatopancreas and muscle extracts and T-2-GluA were lower than those with T-2 (Fig. 5–7). It has been suggested that the immune toxicity of mT-2s is lower than that of free T-2.27 It is well established that detoxification of free toxin results in metabolites that are less toxic or non-toxic in most instances. Similar to phase II animal biotransformation processes, such as glucuronidation, sulfation and glutathione conjugation,28 water solubility of mycotoxins are also increased to facilitate excretion, and thereby decrease toxicity. T-2 is metabolized to HT-2 and neosolaniol, each of which is about one-tenth as toxic as the parent toxin.27 Other types of modified mycotoxins show a similar phenomenon. Poppenberger, B. et al. confirmed that both DON and the metabolite DON-3 G can inhibit ribosome bonding in wheat protein, but that the effect of DON-3 G was lower than DON.29 Bartholomew, D. M. et al. suggested that Z14N, a modified toxin of ZEN, possesses estrogen activity, but relatively less than that of ZEN. Similarly, mT-2s are less toxic than the parent T-2.30 However, when an mT-2 is converted back to its free T-2 by the gastrointestinal enzymes in humans and animals, the toxic effects are similar to its free toxin.
mRNA expression of SCOS2, SCOS3, CIS (Fig. 6), IL-6, and IL-1β (Fig. 5) induced in the shrimp hepatopancreas by mT-2s was higher than that induced by mT-2s in shrimp muscle. In animals, biotransformation of chemicals occurs mostly in the liver and to a lesser extent in the kidneys and intestinal epithelium,27 but in shrimp the hepatopancreas is the main organ responsible for biotransformation of chemicals. Biotransformation involves phase I (oxidation, reduction, and hydrolysis) and phase II reactions (which are involved in conjugation).5 Phosphorylation of STAT1 mediated by the muscle extract was lower than that induced by the hepatopancreas extract, while the phosphorylation of STAT3 was the reverse. STAT3 counteracts inflammation and promotes cell survival/proliferation and immune tolerance, while STAT1 inhibits proliferation and favors innate and adaptive immune responses.31 This supports the conception that activation of the JAK/STAT pathway by hepatopancreas mT-2s was significantly higher than that by muscles.
Different toxins have various effects on the JAK/STAT family in RAW264.7. Both hepatopancreas and muscle extracts from shrimp significantly activated STAT2 mRNA expression, which was different from the effect on other members in the STAT family (Fig. 7B). Maybe STAT2 mRNA gene expression is the marker of mT-2's effect on the JAK/STAT signal pathway in RAW264.7. T-2 significantly activated the phosphorylation of JAK1 and STAT2, whereas the muscle extract significantly activated the phosphorylation levels of JAK3 (Fig. 8). The phosphorylation of STAT1 and JAK2 was also significantly induced by T-2-GluA and hepatopancreas extract, respectively.
As shown in this study, mT-2s could activate the JAK/STAT pathway via induction of IL-6 rather than IL-1β and TNF-α. mT-2s in different tissues behave differently and in general are less toxic than free T-2 and T-2-GluA. Reports of the toxic effects of mT-2s on the immune system are scarce in the literature and to our knowledge this is the first published report of the effects of mT-2s on the JAK/STAT signal pathway.
5. Conclusion
In this study, our focus was to identify the different effects between mT-2s from hepatopancreas and muscle extracts of Litopenaeus orally fed with T-2 and T-2-GluA on the JAK/STAT pathway in RAW264.7 cells. The mRNA gene expression of several immune system markers induced by the hepatopancreas and muscle extracts and T-2-GluA were lower than those by free T-2, indicating that they are less toxic than T-2. mT-2s in both the hepatopancreas and muscle extracts significantly activated STAT2 mRNA gene expression. mRNA expressions of SOCSs, IL-6 and IL-1β induced by hepatopancreas extracts were higher than those by the muscle extracts. Muscle extract significantly activated the phosphorylation of STAT3 but inhibited phosphorylation of STAT1. Activation of the JAK/STAT pathway in RAW264.7 cells by hepatopancreas mT-2s was significantly higher than that by mT-2s in the muscle extracts. T-2 significantly activated the phosphorylation of JAK1 and STAT2, whereas the muscle extract significantly activated the phosphorylation of JAK3. The phosphorylation of STAT1 and JAK2 was significantly induced by T-2-GluA and hepatopancreas extract, respectively. Both muscle and hepatopancreas extract significantly activated IL-6 mRNA gene expression in RAW264.7 similar to that by the free T-2 but to a lesser degree. This study shows that activation of the JAK/STAT pathway in RAW264.7 cells by T-2 was significantly higher than that by hepatopancreas and muscle mT-2s from the shrimp tissue extracts.
Conflict of interest
There are no conflicts of interest to declare.
Acknowledgments
This study was financially supported by the National Natural Science Foundation of China (NSFC No. 31171634 and No. 31371777), the Science and Technology Planning Project of Guangdong Province (No. 2014B020205006), a Guangdong Oceanic & Fishery Administration project (Guangdong Fiscal Government on Agriculture [2015] No. 115), and the Project of Enhancing School with Innovation of Guangdong Ocean University (No. 2016050205 and No. 2014050203 and GDOU2016050312).
References
- Beyer M., Ferse I., Humpf H. U. Mycotoxin Res. 2009;25:41–52. doi: 10.1007/s12550-009-0006-2. [DOI] [PubMed] [Google Scholar]
- Wu W., Zhou H. R., Pan X., Pestka J. J. Toxicol. Rep. 2015;2:238–251. doi: 10.1016/j.toxrep.2014.12.010. [DOI] [PMC free article] [PubMed] [Google Scholar]
- Krska R., Welzig E., Boudra H. Anim. Feed Sci. Technol. 2007;137:241–264. [Google Scholar]
- Bryden W. L. Anim. Feed Sci. Technol. 2012;173:134–158. [Google Scholar]
- Anders M. W. Kidney Int. 1980;18:636–647. doi: 10.1038/ki.1980.181. [DOI] [PubMed] [Google Scholar]
- Rychlik M., Humpf H. U., Marko D., Danicke S., Mally A., Berthiller F., Klaffke H., Lorenz N. Mycotoxin Res. 2014;30:197–205. doi: 10.1007/s12550-014-0203-5. [DOI] [PMC free article] [PubMed] [Google Scholar]
- Boevre M. D., Graniczkowska K., Saeger S. D. Toxicol. Lett. 2015;233:24–28. doi: 10.1016/j.toxlet.2014.12.011. [DOI] [PubMed] [Google Scholar]
- Lattanzio V. M., Visconti A., Haidukowski M., Pascale M. J. Mass Spectrom. 2012;47:466–475. doi: 10.1002/jms.2980. [DOI] [PubMed] [Google Scholar]
- Welsch T., Humpf H. U. J. Agric. Food Chem. 2012;60:10170–10178. doi: 10.1021/jf302571y. [DOI] [PubMed] [Google Scholar]
- Busman M., Poling S. M., Maragos C. M. Toxins. 2011;3:1554–1568. doi: 10.3390/toxins3121554. [DOI] [PMC free article] [PubMed] [Google Scholar]
- Konigs M., Mulac D., Schwerdt G., Gekle M., Humpf H. U. Toxicology. 2009;258:106–115. doi: 10.1016/j.tox.2009.01.012. [DOI] [PubMed] [Google Scholar]
- Lu P., Wu C., Shi Q., Wang Y., Sun L., Liao J., Zhong S., Xu D., Chen J., Liu Y., Li J., Gooneratne R. Food Anal. Methods. 2016;9:1580. [Google Scholar]
- Zhang X., Wang Y., Sun L., Lu P., Xu D., Liu Y., Chen J., Li J. Mod. Food Sci. Technol. 2016;31:62–67. [Google Scholar]
- Broekaert N., Devreese M., De Baere S., De Backer P., Croubels S. Food Chem. Toxicol. 2015;80:17–31. doi: 10.1016/j.fct.2015.02.015. [DOI] [PubMed] [Google Scholar]
- Murray P. J. J. Immunol. 2007;178:2623–2629. doi: 10.4049/jimmunol.178.5.2623. [DOI] [PubMed] [Google Scholar]
- Stark G. R., Darnell Jr. J. E. Immunity. 2012;36:503–514. doi: 10.1016/j.immuni.2012.03.013. [DOI] [PMC free article] [PubMed] [Google Scholar]
- Wu Q., Wang X., Wan D., Li J., Yuan Z. Cell. Signalling. 2014;26:2951–2960. doi: 10.1016/j.cellsig.2014.09.013. [DOI] [PubMed] [Google Scholar]
- Wang X., Liu Q., Ihsan A., Huang L., Dai M., Hao H., Cheng G., Liu Z., Wang Y., Yuan Z. Toxicol. Sci. 2012;127:412–424. doi: 10.1093/toxsci/kfs106. [DOI] [PubMed] [Google Scholar]
- Kuhn D. D., Smith S. A., Boardman G. D., Angier M. W., Marsh L., Flick G. J. Aquaculture. 2010;309:109–114. [Google Scholar]
- Wang X., Huang X. J., Ihsan A., Liu Z. Y., Huang L. L., Zhang H. H., Zhang H. F., Zhou W., Liu Q., Xue X. J., Yuan Z. H. Toxicology. 2011;280:126–134. doi: 10.1016/j.tox.2010.12.001. [DOI] [PubMed] [Google Scholar]
- Huang X. J., Ihsan A., Wang X., Dai M. H., Wang Y. L., Su S. J., Xue X. J., Yuan Z. H. Toxicol. Lett. 2009;191:167–173. doi: 10.1016/j.toxlet.2009.08.021. [DOI] [PubMed] [Google Scholar]
- Liu Y., Walker F., Hoeglinger B., Buchenauer H. Agric. Food Chem. 2005;53:6864–6869. doi: 10.1021/jf050831u. [DOI] [PubMed] [Google Scholar]
- Berthiller F., Schuhmacher R., Buttinger G., Krska R. J. Chromatogr., A. 2005;1062:209–216. doi: 10.1016/j.chroma.2004.11.011. [DOI] [PubMed] [Google Scholar]
- Berthiller F., Krska R., Domig K. J., Kneifel W., Juge N., Schuhmacher R., Adam G. Toxicol. Lett. 2011;206:264–267. doi: 10.1016/j.toxlet.2011.08.006. [DOI] [PMC free article] [PubMed] [Google Scholar]
- Zhou X., Wang Z., Chen J., Wang W., Song D., Li S., Yang H., Xue S., Chen C. Rheumatol. Int. 2013;34:995–1004. doi: 10.1007/s00296-013-2862-5. [DOI] [PubMed] [Google Scholar]
- Fu Y., Lin W., BaoCheng Z., Quan G. Int Orthop. 2001;25:199–201. doi: 10.1007/s002640000217. [DOI] [PMC free article] [PubMed] [Google Scholar]
- Yiannikouris A., Jouany J.-P. Anim. Res. 2002;51:81–99. [Google Scholar]
- Homolya L., Varadi A., Sarkadi B. BioFactors. 2003;17:103–114. doi: 10.1002/biof.5520170111. [DOI] [PubMed] [Google Scholar]
- Poppenberger B., Berthiller F., Lucyshyn D., Sieberer T., Schuhmacher R., Krska R., Kuchler K., Glossl J., Luschnig C., Adam G. J. Biol. Chem. 2003;278:47905–47914. doi: 10.1074/jbc.M307552200. [DOI] [PubMed] [Google Scholar]
- Bartholomew D. M., Van Dyk D. E., Lau S. M., O'Keefe D. P., Rea P. A., Viitanen P. V. Plant Physiol. 2002;130:1562–1572. doi: 10.1104/pp.008334. [DOI] [PMC free article] [PubMed] [Google Scholar]
- Regis G., Pensa S., Boselli D., Novelli F., Poli V. Semin. Cell Dev. Biol. 2008;19:351–359. doi: 10.1016/j.semcdb.2008.06.004. [DOI] [PubMed] [Google Scholar]


