 Magnetic nanoparticles (MNPs) have been increasingly used for many years as MRI agents and for gene delivery and hyperthermia therapy, although there have been conflicting results on their safety.
Abstract
Magnetic nanoparticles (MNPs) have been increasingly used for many years as MRI agents and for gene delivery and hyperthermia therapy, although there have been conflicting results on their safety. In this study, cobalt ferrite magnetic nanoparticles (CoFe-MNPs) were prepared by the co-precipitation method and their surfaces were modified with silica by the sol–gel method. The particle and hydrodynamic sizes, morphology and crystal structure of the bare and silica-coated CoFe-MNPs were evaluated by transmission electron microscopy (TEM), dynamic light scattering (DLS), X-ray diffraction spectroscopy (XRD) and Fourier transform infrared spectroscopy (FTIR). The size of the bare CoFe-MNPs was in the range 8–20 nm and they were homogeneously coated with 3–4 nm silica shells. The bare and silica-coated CoFe-MNPs were agglomerated at physiological pH. However, the sizes of the agglomerates were below 200 nm both in water and complete medium. The cytotoxic and genotoxic potentials of the bare and silica-coated CoFe-MNPs were evaluated in a metastatic breast cancer cell line, MDA-MB-231, as well as a noncancerous mammary epithelial cell line, MCF-10A, by using XTT cytotoxicity, single-cell gel electrophoresis (comet), and cytokinesis-blocked (CB) micronucleus (CBMN) assays. Characterization studies with TEM, inductively coupled plasma optical emission spectroscopy (ICP-OES) and Prussian blue staining indicated that the CoFe-MNPs were internalized into the cells by energy-dependent endocytosis. The highest amount of uptake was observed in the cancer cells and the uptake of the silica-coated CoFe-MNPs was higher than that of the bare ones in both cell lines. The bare CoFe-MNPs showed higher levels of both cytotoxicity and genotoxicity than the silica-coated CoFe-MNPs. Moreover, the cancer cells seemed to be more susceptible to the CoFe-MNPs’ toxicity compared to the noncancerous cells. There was a concentration and time-dependent increase in DNA damage and the micronucleus (MN) frequency, which was statistically significant starting with the lowest concentration of bare CoFe-MNPs (p < 0.05), while no significance was observed below the concentration of 250 μg mL–1 for the silica-coated MNPs. Also, the extent of both DNA damage and MN frequency was much higher in the cancer cells compared to the noncancerous cells. According to our results, the silica coating ameliorated both the cytotoxicity and genotoxicity as well the internalization of the CoFe-MNPs.
Introduction
Nanoparticles are highly promising tools and have numerous potential uses for a wide range of applications from diagnostics to the treatment of diseases.1–3 Among them, magnetic nanoparticles (MNPs) have unique properties such as high magnetization values and the ability to pass cellular barriers, and they have been used for many years as magnetic resonance imaging (MRI) agents, gene delivery agents, and in hyperthermia therapy and tissue repair.4–6 Especially, cobalt-based MNPs are gaining increasing attention as highly effective MRI contrast agents, in combination with gold, iron and graphite, and platinum.7
Due to the widespread application of MNPs, it is also important to evaluate their potential risks to biological systems.8,9 Results published in the literature indicating the toxic potential of MNPs, especially for the targeted use of drugs/gene delivery and for imaging, are conflicting. Some of these nanoparticles have been shown to generate toxicity, while for others good biocompatibility and also very low toxicity were reported.10,11 The reason behind these conflicting data is that the routes of entry and the fates of the MNPs in the cells12 were influenced by a number of parameters, like the size, shape and surface charge. For example, it was reported that cationic MNPs entered into cells more effectively than anionic MNPs through negatively charged cell surfaces using electrostatic interactions. On the other hand, positively charged MNPs induced more toxicity compared to anionic or neutral MNPs.13 Likewise, if the size was small enough, MNPs could enter easily into the cells through the process of endocytosis, but they could also readily interact with the genetic material of the cells. Furthermore, other biological parameters, such as the cell type used for the study and the particle concentration, medium composition and temperature, also influenced both cyto- and genotoxicity.14 Therefore, the establishment of a relationship between the physicochemical characteristics, such as size distribution, surface properties, surface area and charge, and the toxic effects of MNPs is crucial in understanding their biological reactivity, which seems to be crucially involved in modulating biological interactions.15–17
The surface properties of MNPs are another important factor for determination of their biocompatibility in both in vitro and in vivo applications. The surfaces of MNPs can be modified with a suitable polymer shell, such as polyethylene glycol (PEG), chitosan, dextran, or polyethyleneimine (PEI), to provide a platform for further modifications, such as targeted drug loading.18 Otherwise, MNPs are known to agglomerate and lose stability without surface coating. Another surface coating material, silica, has gained more attention by providing a surface modification potential and also because of its hydrophilicity and stability in physiological environments, which are required in cell imaging and drug/gene delivery.19,20
When MNPs interact with the cell, they can influence the cellular processes and cause cell stress, by changing the metabolic activity, inducing oxidative stress and cytoskeleton disruption, or through DNA damage.21 Consequently, genotoxicity testing and thus the evaluation of the carcinogenic or mutagenic potential of nanoparticles is a requirement before Phase I/II clinical trials.12
Herein, the aim is to prepare bare and silica-coated cobalt ferrite magnetic nanoparticles (CoFe-MNPs) and to evaluate their physicochemical characteristics, internalization, cytotoxicity and genotoxicity in both cancerous and noncancerous cell lines in order to systematically examine how particle design can be optimized towards efficient biomedical applications.
Material and methods
Preparation, functionalization and characterization of CoFe-MNPs
Synthesis of bare CoFe-MNPs
Bare CoFe-MNPs were synthesized by the co-precipitation method.22 0.52 g of FeCl3 (Sigma-Aldrich, USA) and 0.38 g of CoCl2 (Fisher Scientific, USA) (for which the calculated molar ratio of Co(ii) : Fe(iii) is 1 : 2) were dispersed in 3.12 mL of deoxygenated deionized water, and 50 μL of concentrated HCl solution was added to this solution. Then, 31.25 mL of 1.5 M NaOH solution was added to this mixture under stirring at 70 °C. Following stirring for 1 hour, the black precipitate of bare CoFe-MNPs was collected by a magnet and washed three times with a water–ethanol mixture. Finally, the bare CoFe-MNPs were dispersed in 50 mL of water at pH 5.
Synthesis of silica-coated CoFe-MNPs
The Stöber method was used for coating the bare CoFe-MNPs with silica.23 The bare CoFe-MNPs were first dispersed in water and neutralized. 14 mL of this solution was diluted to 500 mL with deoxygenated deionized water. 2.5 mL of 1 mM (3-aminopropyl)triethoxysilane (APTES) (Sigma-Aldrich, USA) was added dropwise to this solution under stirring for 15 min. The particles were collected by a magnet and dispersed again in 500 mL of deionized water–ethanol (1 : 4) mixture. 300 μL of tetraethyl orthosilicate (TEOS) (Sigma-Aldrich, USA) and 2 mL of ammonia solution were added to this solution and stirred overnight. Silica-coated CoFe-MNPs were collected by using a magnet washed twice with deionized water and redispersed in 50 mL of water.
Characterization of bare and silica-coated CoFe-MNPs
Transmission electron microscopy (TEM) (FEI Tecnai G2 Spirit BioTwin) was used for imaging bare and silica coated CoFe-MNPs. The X-ray diffraction (XRD) patterns were obtained by using a Rigaku Mini-flex XRD system (a Cu Kα radiation source was used and the scan speed was adjusted to 2.000 deg min–1). The ICDD database was used in order to analyze the structure. Fourier transform infrared spectroscopy (FT-IR) (Alpha, Bruker) analysis was performed in order to investigate the bonds related to the silica layer formed on the CoFe-MNPs. The zeta potential and average hydrodynamic sizes were measured by dynamic light scattering (DLS) (Malvern Nano ZS90) in water, RPMI-1640 medium and complete medium (containing 10% fetal bovine serum (FBS)) at 25 °C. The nanoparticle dispersions were sonicated in an ultrasonic bath for 5 min using a bath sonicator at 25 °C (100 W, 42 kHz, Fisher Scientific, Fairlawn, New Jersey) before measuring the size and zeta potential. Longer sonication times using the bath sonicator did not change the dispersion size and surface charge. All results for the average size and the size distribution, as well as the zeta potentials, were averaged from more than three measurements. In order to mimic in vitro cell culture conditions, the bare and silica-coated CoFe-MNPs were incubated with cell culture medium supplemented with 10% FBS, containing plentiful protein.
In vitro internalization, cytotoxicity and genotoxicity of CoFe-MNPs
Cell culturing and treatments
Cancerous (MDA-MB-231) and noncancerous (MCF-10A) human breast cell lines were obtained from ATCC (American Type Culture Collection, USA). The MDA-MB-231 cells were grown in RPMI-1640 medium (Lonza, Belgium) supplemented with 10% FBS (Lonza, Belgium) and the MCF-10A cells were grown in DMEM/Ham's F12 medium (Lonza, Belgium) with phenol red containing 5% horse serum (Sigma-Aldrich, USA), 100 mg mL–1 epidermal growth factor (EGF) (Peprotech, USA), 1 mg mL–1 hydrocortisone (Sigma-Aldrich, USA) and 10 mg mL–1 insulin (Sigma-Aldrich, USA). All growth media contained penicillin and streptomycin (100 units per mL) (Sigma-Aldrich, USA). Hereafter, “the cells” will refer to both MDA-MB-231 and MCF-10A cell lines unless otherwise stated in this article. The cells were maintained at 37 °C in a humidified air atmosphere containing 5% CO2 and 95% air, and were used between passages 4 and 15 in the experiments.
In all assays prior to the treatment of the cells, CoFe-MNPs dispersions were prepared by diluting the measured amount of the concentrated stock solutions in the cell culture complete medium at room temperature. The nanoparticle dispersions were sonicated in an ultrasonic bath for 5 min at room temperature and immediately applied to the cells in each assay. Stock suspensions of bare and silica-coated CoFe-MNPs (1 mg mL–1) in complete medium were serially diluted to the concentration range of 15–500 μg mL–1 for cellular uptake, cytotoxicity and genotoxicity assays.
Cellular uptake
Visualization of intracellular CoFe-MNPs by TEM
Qualitative analysis of the internalized bare and silica-coated CoFe-MNPs was performed by TEM. The cells were seeded into six-well plates overnight and treated with 125 μg mL–1 CoFe-MNPs for 24 h. The cells were collected and fixed in 2.5% glutaraldehyde solution at +4 °C and, after phosphate buffer washing, were fixed with 1% osmium tetroxide solution. They were dehydrated with graded alcohol series and embedded in an Araldite mixture (Araldite CY 212 20 mL, DDSA 22 mL, BDMA 1.1 mL, dibutyl phthalate 0.5 mL). The cell blocks obtained were held at 60 °C for 48 h in order to complete the polymerization step. After incubation, ultrathin sections were prepared using a diamond knife to a maximum thickness of 100 nm. The sections were stained with uranyl acetate and Reynolds’ lead citrate. The grids were then examined under TEM (FEI Tecnai G2 Spirit TWIN).
CoFe-MNPs cellular uptake assay by Prussian blue staining
Qualitative iron determination of the cells treated with bare and silica-coated CoFe-MNPs was performed by Prussian blue staining. The samples were prepared according to a previous study.24 The cells were seeded into six-well plates overnight and treated with 125 μg mL–1 of bare and silica-coated CoFe-MNPs at 37 °C in 5% CO2 atmosphere for 24 h. After treatment, the cells were washed at least three times with Dulbecco's phosphate-buffered saline (DPBS) (Lonza, Belgium) to remove the residual MNPs excluded from the cells and detached using 0.25% trypsin (Lonza, Belgium). The cells were fixed with 4% paraformaldehyde, then washed with distilled water three times. The staining solution mixtures, containing 5% potassium ferrocyanide (Sigma-Aldrich, USA) and 5% hydrochloric acid solutions, were freshly prepared and applied to the cells for 30 min at room temperature, which were then washed with distilled water three times and counterstained with nuclear fast red (Sigma-Aldrich, USA) for 5 min. The plates were evaluated under a light microscope (Zeiss, Germany).
CoFe-MNPs cellular uptake assay by ICP-OES
Quantitative iron determination of the internalized bare and silica-coated CoFe-MNPs was performed by ICP-OES. Briefly, 2 × 10⁶ cells were plated in a 60 × 15 mm culture dish and incubated for 2, 4, 8, and 24 h according to the concentration of bare and silica-coated CoFe-MNPs (62–500 μg mL–1). Then, the cells were trypsinized and collected in 15 mL falcon tubes. The cells were counted on a hemocytometer and digested with concentrated HCl acid for at least 24 h to obtain a clear solution. Next, the samples were diluted with water. The iron concentration in the digested samples was measured by ICP-OES (Direct Reading Echelle, Leeman Labs, Inc., with an axial view configuration). Calibration plots were prepared by using 0.1, 0.25, 0.5, 1, 2.5 and 5.0 ppm iron standard solutions.
In order to determine whether the uptake of CoFe-MNPs into the cells was energy-dependent or, more generally, cell function-dependent, the cells were incubated with CoFe-MNPs under varying metabolic conditions. Energy dependence experiments were performed by pre-incubating the cells at 4 °C for 30 min prior to exposure to CoFe-MNPs. After this pre-incubation, the cells were incubated with either bare or silica-coated CoFe-MNPs for 2 h at 4 °C. The other cellular uptake studies were performed at 37 °C. For the inhibition studies, 80–90% confluent cells were preincubated with 0.1% sodium azide, 0.45 M sucrose, and 6 μg mL–1 chlorpromazine (CPZ; Sigma-Aldrich, USA) for 30 min, and then they were incubated with either bare or coated CoFe-MNPs for 2 h at a final concentration of 250 μg mL–1 (derived from IC50 experiments). After this incubation time, the medium was removed and the samples were washed with DPBS, in order to ensure particle removal from the outer cell membrane. Untreated cells and cells treated with only MNPs (no inhibitor) were used as negative and positive controls, respectively.
Cytotoxicity (XTT assay)
The cell proliferation 2,3-bis-(2-methoxy-4-nitro-5-sulfophenyl)-2H-tetrazolium-5-carboxanilide XTT kit (Biological Industries, Israel) was used for the cytotoxicity evaluation according to the manufacturer's instructions. Briefly, the tetrazolium salt XTT was reduced to orange colored formazan compounds by the activity of mitochondrial enzymes of metabolically active cells.25 The formed product was water-soluble and could be readily observed with an ELISA reader (Biotek, Epoch) at 415 nm. The results were given as the percentage of viable cells relative to the control. Eight duplicates were prepared for each condition. The percentage of cell viability in the control group was shown as 100%. The concentration required to inhibit 50% of the cell growth (IC50), as the biomarker of cytotoxicity, was determined from the cytotoxicity curves.
Single-cell gel electrophoresis (SCGE, comet) genotoxicity assay
The alkaline comet assay was performed according to Singh et al.26 with slight modifications. The cells were seeded in 24-well plates. After 24 h incubation, the cells were treated with either bare or silica-coated MNPs for 4 and 24 h. The concentrations of the nanoparticles in the cells were in the range of 15 to 500 μg mL–1. Untreated complete medium and hydrogen peroxide (20 and 40 μM H2O2; Sigma-Aldrich, USA) served as negative and positive controls, respectively. At the end of the treatments, the cells were washed three times with phosphate buffer saline (PBS) and then trypsinized. The cells at a concentration of 2 × 10⁴ cells per mL were suspended in 0.65% low melting-point agarose (LMA; Sigma-Aldrich, USA) and layered onto a microscope slide precoated with 0.65% high melting-point agarose (HMA; Sigma-Aldrich, USA) and covered with a coverslip. After solidification of the agarose, the coverslips were removed and the slides were immersed in light-protected and freshly prepared cold lysing solution (89% lysing buffer, 2.5 M NaCl, 0.1 M Na2EDTA, 10 mM Tris-HCl, 1% Triton X-100, 10% dimethyl sulfoxide; pH 10) overnight at 4 °C. Afterwards, the slides were pretreated for 20 min in freshly prepared electrophoresis buffer (0.3 M NaOH, 1 mM Na2EDTA; pH 13) to allow unwinding of the DNA and then electrophoresis was carried out at 25 V and 300 mA for 20 min at 4 °C (Thermo EC250-90). The slides were neutralized three times for 5 min in neutralizing buffer (0.4 M Tris-HCl; pH 7.5). The gels were then stained with 20 μg mL–1 ethidium bromide (Sigma-Aldrich, USA), and 50 cells per slide were scored using the Comet Assay III image-analysis software system (Perceptive Instruments, UK) attached to a fluorescence microscope (Zeiss Axioscope, Germany). All the steps of the comet assay were conducted under a yellow lamp in a dark room to prevent additional DNA damage. The tail moment (percent DNA in the tail) was chosen as the measure of DNA damage. The experiments were repeated three times and duplicate samples were used. Two slides were prepared for each sample. The cell viability was assessed using trypan blue dye (Biological Industries, Israel) exclusion assay.
Cytokinesis-blocked micronucleus (CBMN) assay
An in vitro CBMN assay was carried out according to the Organization for Economic Co-operation and Development (OECD) Guideline 48727 and Fenech28 with some modifications. The cells were seeded at a concentration of 2.5 × 10⁵ cells per mL and incubated at 37 °C under CO2 atmosphere (5% CO2 in air) for 24 h in T25 flasks (Greiner Bio-one), and were treated with bare or silica-coated MNPs at a concentration range of 15–500 μg mL–1 for 4 and 24 h. The complete medium and mitomycin C (MMC; Sigma-Aldrich, USA; 0.6 μg mL–1 for 4 h and 0.3 μg mL–1 for 24 h) were used as negative and positive controls, respectively. At the end of the treatments, the cells were washed with complete medium, and cytochalasin B (Sigma-Aldrich, USA; final concentration of 6 μg mL–1) was added in the last 24 h of the culture. The cells were harvested with 0.25% trypsin; the cell suspension was centrifuged at 250g for 10 min and re-suspended in 0.075 M KCl at 4 °C for 3 min as a hypotonic treatment. The cells were then fixed with methanol–acetic acid (3 : 1 v/v), dropped onto cold slides, air-dried and stained with Giemsa–May Grünwald solution (Merck). The micronucleus (MN) frequency was evaluated by scoring a total of 2000 binucleated (1000 binucleate cells from each replicate) cells per treatment at 400× or 1000× magnification as necessary (Zeiss Axioscope Microscope, Goettingen, Germany). The cytokinesis-blocked proliferation index (CBPI) was also calculated from 500 cells/concentration as recommended in the OECD Guideline No. 48727 as follows:CBPI = (no. of mononucleate cells + 2 × no. of binucleate cells + 3 × no. of multinucleate cells)/Total no. of cells.
Statistical analysis
The GraphPad Prism VI statistical software (GraphPad Inc. CA, USA) was used to evaluate the statistical significance of the differences between groups by using one-way analysis of variance (ANOVA) for multiple comparisons. A p value of less than 0.05 (p < 0.05) was regarded as statistically significant. Data were presented as mean ± standard deviation of the mean.
Results
Characterization of silica coating on bare CoFe-MNPs
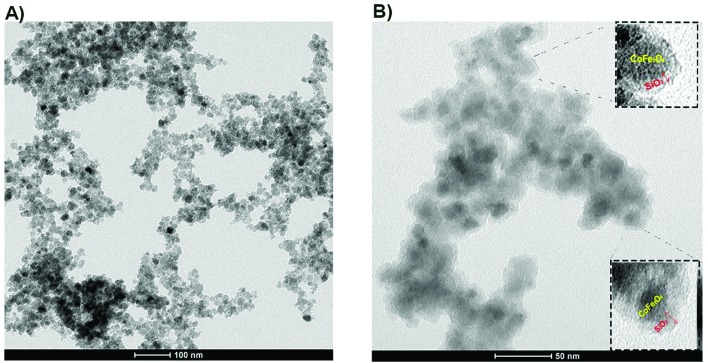
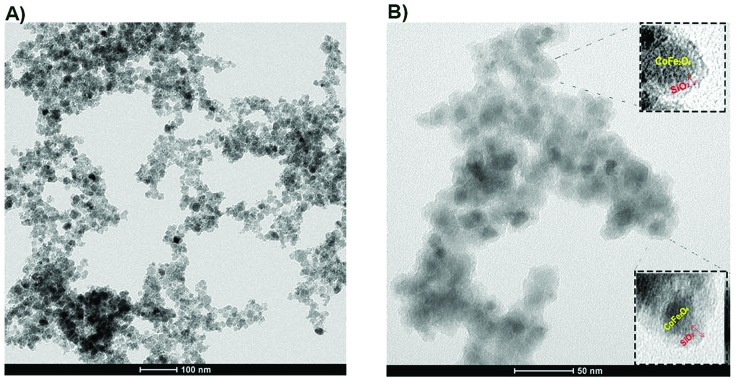
TEM images of the bare and the silica-coated samples of CoFe-MNPs are shown in Fig. 1. According to the TEM image shown in Fig. 1A, the particle size of the bare CoFe-MNPs was in the range of 8–20 nm. From the TEM image of the silica-coated CoFe-MNPs, Fig. 1B, one can see the presence of spherical silica (SiO2) shells approximately 3–4 nm thick around the relatively dark colored CoFe-MNPs.
Fig. 1. TEM images of (A) bare CoFe-MNPs and (B) silica-coated CoFe-MNPs. Red arrows represent silica layers on the surface of the bare CoFe-MNPs. The scale bars in the images are 50 and 100 nm.
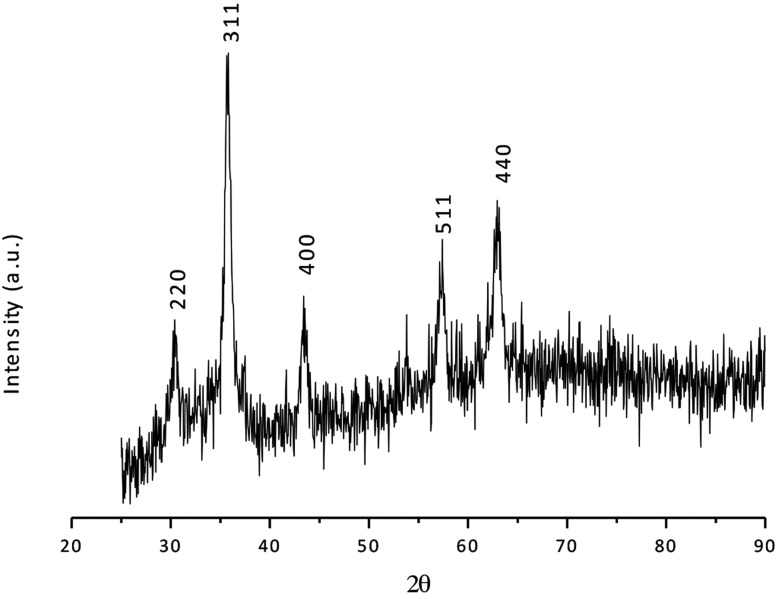
The X-ray powder diffraction technique was used for the characterization of the CoFe-MNPs’ structure. The XRD pattern of the crystalline CoFe-MNPs is given in Fig. 2. According to the ICDD database, card no. 03-0864, the peaks at 30.400 (220), 35.450 (311), 43.400 (400), 57.150 (511), and 62.800 (440) belong to crystalline cubic CoFe-MNPs.
Fig. 2. XRD diffraction pattern of bare CoFe-MNPs.
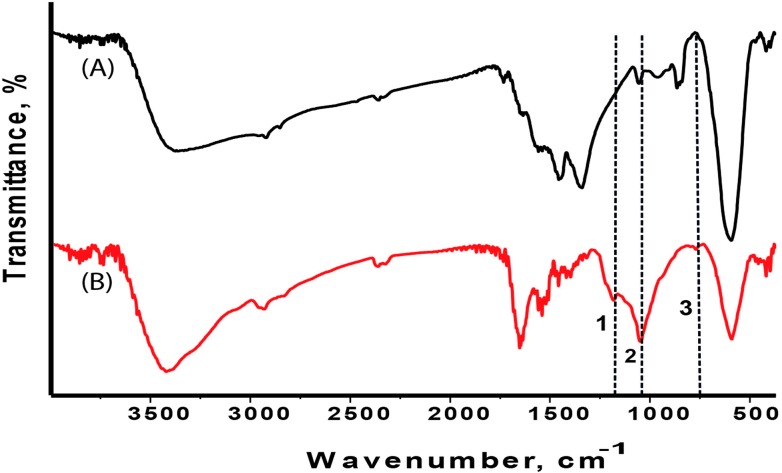
The presence of a silica coating on the nanoparticles was confirmed by the FTIR measurements. The silica coating protects the CoFe-MNPs from possible decomposition induced by the surrounding environment. The FTIR spectra of bare (A) and silica-coated (B) CoFe-MNPs are depicted in Fig. 3. The peak positions are shown with dotted lines, and numbers (1–3) are also given in Fig. 3. The bands around (1) 1197 cm–1, (2) 1084 cm–1 and (3) 800 cm–1 represent the characteristic peaks of Si–O–Si stretching and Si–O bending.29
Fig. 3. FTIR results of (A) bare CoFe-MNPs and (B) silica-coated CoFe-MNPs.
As seen in Fig. 3, asymmetric and symmetric stretching of silica (SiO2) and bending vibrations all emerged on the FTIR spectrum of the silica-coated CoFe-MNPs at the expected peak positions. Their existence was correlated to the coating of a silica layer on the cobalt ferrite particles.
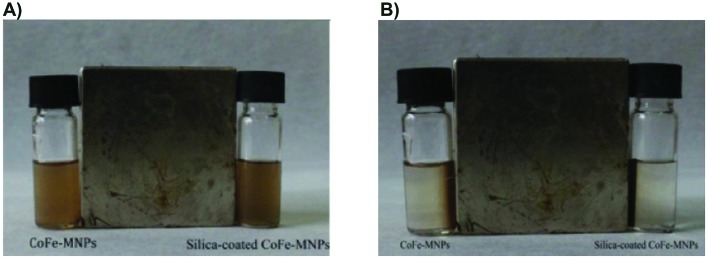
The magnetic behaviors of the CoFe-MNPs under the influence of an external magnetic field are shown in Fig. 4A and B.
Fig. 4. Photographs of magnetic behavior of the (A) bare and silica-coated CoFe-MNPs in the presence of an external magnetic field. (B) It can be seen that both the bare and silica-coated CoFe-MNPs were attracted to the external magnet within 60 s.
As can be seen from Fig. 4B, the collection of the CoFe-MNPs after the application of an external magnetic field (1.6 T) was completed after 60 s. A similar observation was noted for the silica-coated CoFe-MNPs (Fig. 4B). The collection of the silica-coated CoFe-MNPs was as rapid as that of the bare CoFe-MNPs. Thus, the magnetic nanoparticles can be removed or recycled in water using a simple magnetic device. After the removal of the magnetic force, the magnetic nanoparticles can easily be dispersed by simple shaking.
Stability of bare and silica-coated CoFe-MNPs in water, RPMI-1640 and RPMI-1640 10% FBS media
The hydrodynamic sizes and zeta potentials of both the bare and silica-coated CoFe-MNPs are summarized in Table 1. The DLS results showed that there was no difference between the bare and silica-coated CoFe-MNPs. The average sizes of the bare and silica-coated CoFe-MNPs were found as 189.75 ± 4.20 nm and 160.03 ± 10.15 nm, respectively, in complete medium and the zeta potentials of the bare and silica-coated CoFe-MNPs (50 μg ml–1) obtained in complete medium were found as –9.8 mV and –11.3 mV, respectively.
Table 1. Zeta potential and average hydrodynamic sizes of aggregates of investigated CoFe-MNPs in different media.
| Particle (CoFe-MNPs) | Media | Zeta potential (mV) | DLS mean size (nm) |
| Bare | Water | –33.5 | 192.70 ± 15.13 |
| RPMI-1640 | –15.4 | 869.00 ± 12.00 | |
| RPMI-1640 10%FBS | –11.3 | 189.75 ± 4.20 | |
| SiO2 coated | Water | –39.5 | 175.73 ± 4.63 |
| RPMI-1640 | –20.6 | 708.40 ± 14.28 | |
| RPMI-1640 10%FBS | –9.8 | 160.03 ± 10.15 | |
As seen from Table 1, the stability of both the bare and silica-coated CoFe-MNPs was evaluated in the media water, RPMI-1640 and RPMI-1640 containing 10% FBS (complete medium) by measuring the hydrodynamic size and zeta potential of these particles. Aggregation of colloid particles will result in a change in their hydrodynamic size and their zeta potential values.
The hydrodynamic sizes of the bare and silica-coated CoFe-MNPs in water were calculated as 192.70 ± 15.13 and 175.73 ± 4.63 nm, respectively. However, when the light scattering experiments were carried out in RPMI-1640 medium, an approximately four-fold increase in the size of the nanoparticles compared to those in water was observed, and their sizes became 869.00 ± 12.0 and 708.40 ± 14.28 nm for the bare and silica-coated CoFe-MNPs, respectively. Since RPMI-1640 is a nutrient medium containing several amino acids and vitamins, it is normal to have larger agglomerates under this condition. The positive charges of these species can diminish the negative zeta potential of the particles, and the electrostatic repulsion between these particles may not be sufficient to keep them stabilized in the medium.
In the case of RPMI-1640 10% FBS medium, on the other hand, the hydrodynamic size of the bare and silica-coated CoFe-MNPs did not change significantly as compared to those in water, indicating the stability of the particles in the presence of proteins under physiological condition, whereas their zeta potentials decreased to around –10 mV. Colloidal systems lose their stability when their zeta potentials are less than 30 mV, regardless of their charge. Hence the stability of the particles in the presence of serum proteins under these conditions can only be explained by the conjugation of proteins around the NPs.
The bare and silica-coated CoFe-MNPs are negatively charged at pH 7.0. Bovine serum albumin (BSA), which is the major component of FBS, is also negatively charged at pH 7. Although it seems impossible to have adsorption through simple electrostatic attraction, it is known that BSA spontaneously binds to negatively charged surfaces, probably through the 60 surface lysine groups having a positive charge at physiological pH. Dispersive and van der Waals forces also contribute to the attachment of the proteins on the nanoparticle surfaces.30,31 Once the proteins are adsorbed on the surface of the CoFe-MNPs, steric interactions of the bulky proteins prevent the approach of other nanoparticles to a distance where van der Waals forces are effective for aggregation.
Consequently, while electrostatic stabilization alone failed to stabilize the bare and silica-coated MNPs in the nutrient medium at zeta potentials of –15.4 and –20.6 mV, both bare and silica-coated MNPs were stable in the same nutritional medium containing 10% protein, at much lower zeta potentials of –11.3 and –9.8 mV, respectively.
Qualitative and quantitative analysis of CoFe-MNPs’ cellular uptake
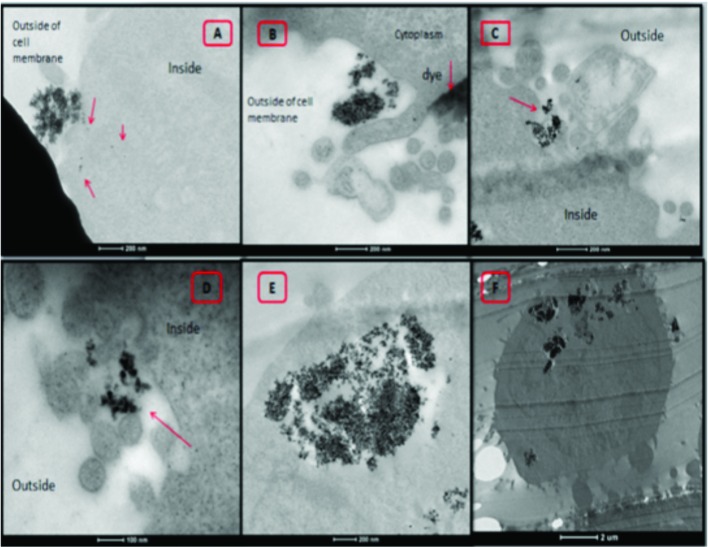
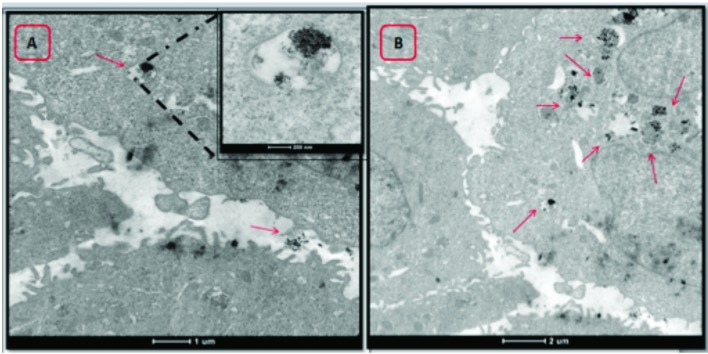
The cellular uptake of the CoFe-MNPs, including the locations and distribution of the nanoparticles in the cells, are shown in the TEM micrographs of both cancerous and noncancerous cells incubated with bare and silica-coated CoFe-MNPs for 24 h (Fig. 5 and 6).
Fig. 5. Representative TEM microphotographs of MDA-MB-231 cells treated with CoFe-MNPs. The sections (A, C, D, E) were not stained with any reagent for detecting the cellular uptake of nanoparticles. Uptake of bare (A, B) and silica-coated (C, D) CoFe-MNPs was initiated upon the invagination of the plasma membrane (red arrows show MNPs). Some cells (B, C) still in the process of uptake at the plasma membrane. Some bare nanoparticles had already been internalized into the cells (E). Silica-coated MNPs were trapped inside the endosome (F). The scale bar is 200 nm for (A, B, C, E), 2 μm for (F) and 100 nm for (D). Images were collected using TEM and a digital camera.
Fig. 6. Representative TEM microphotographs of MCF-10A cells treated with CoFe-MNPs. (A) Magnified images of bare CoFe-MNPs showed that the cluster was composed of individual nanoparticles inside the endosome. (B) Image shows endosomes in cytosol that are loaded with silica-coated CoFe-MNPs. The scale bar is 1 μm (A) and 2 μm (B) and the magnified image has a scale bar of 200 nm.
The overall response of the cancerous MDA-MB-231 and noncancerous MCF-10A cells was similar for both bare and silica-coated CoFe-MNPs. Although most of the CoFe-MNPs were found to be surrounded by a membrane, it was also possible to detect CoFe-MNP clusters within cell cytoplasm. However, no CoFe-MNPs were observed in the nucleus. Due to the long incubation time (24 h), denser and multivesicular features were also detected (Fig. 5 and 6).
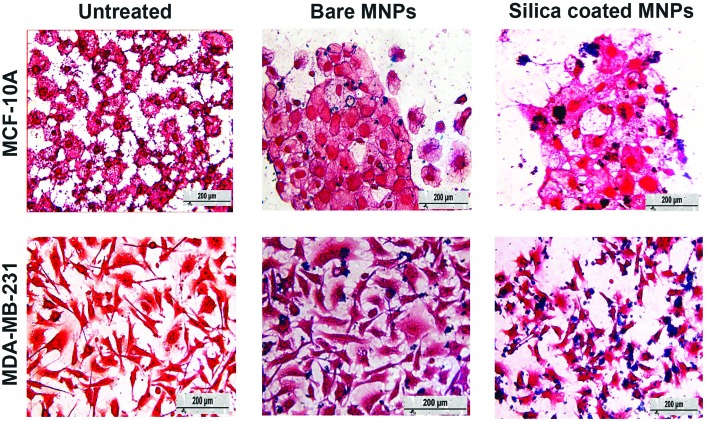
Both Prussian blue staining and ICP-OES analysis were performed in order to quantify and visualize the bare and silica-coated CoFe-MNPs taken up by the cells. For this reason, the cells were treated with the bare or silica-coated CoFe-MNPs for 24 h and stained with Prussian blue and nuclear fast red. The optical micrographs are given in Fig. 7.
Fig. 7. Light microscopy images of MDA-MB-231 and MCF-10A cells that are stained with Prussian blue, followed by the counterstain nuclear fast red. Light pink coloring of cytoplasm, dark pink coloring of nuclei and blue coloring of the iron core of the molecules were seen. The cells were treated with bare or silica-coated CoFe-MNPs at concentrations of 125 μg mL–1 for 24 h. The scale bar in the images is 200 μm.
Comparing the blue granules, which are the MNPs, it can be seen that although the silica-coated MNPs were internalized by all cell types, the nanoparticle uptake was much greater in cancerous cells than the noncancerous cells. Furthermore, it is also clear that the uptake of silica-coated MNPs was higher than that of bare MNPs. MDA-MB-231 cells have a higher uptake capacity compared to noncancerous cells, because of their higher nutritional requirement for proliferation and growth. Thus, they are likely to internalize more material with respect to noncancerous cells.
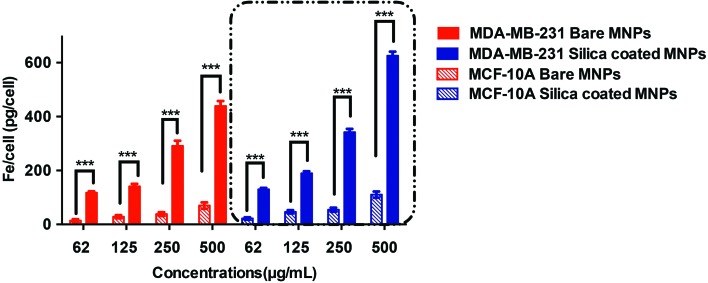
To confirm the uptake of the bare and silica-coated CoFe-MNPs by the cells, elemental analysis was employed by ICP-OES according to the iron content of the cells treated with various concentrations of MNPs. The iron concentrations per cell (pg per cell) were correlated with the initial concentrations of the MNPs used in the experiment, as seen in Fig. 8.
Fig. 8. ICP-OES measurements and comparison of intracellular uptake of bare and silica-coated CoFe-MNPs in MDA-MB-231 vs. MCF-10A cells for 24 h. The iron concentrations of untreated cells were used as background. *p < 0.05, **p < 0.01, ***p < 0.001.
It can be clearly seen both for cancerous and noncancerous cells that the uptake of the silica-coated and bare CoFe-MNPs increased as the concentrations of the MNPs incubated with the cells were increased, that is, cellular uptake was a concentration-dependent process. In addition, silica-coated CoFe-MNPs were internalized significantly more than bare ones (p < 0.001). When the uptake values of the cancerous and noncancerous cell lines were compared, as observed in the TEM measurements, there was a significant difference between them, and the difference became more significant at higher MNP concentrations.
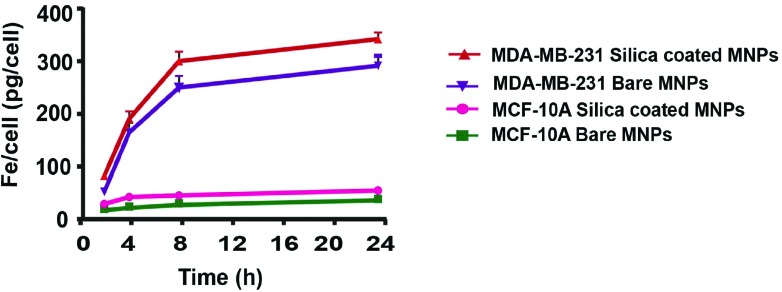
As seen from Fig. 9, the uptake of CoFe-MNPs significantly increased in the first 4 h, but the uptake rate gradually slowed and reached a plateau at 8 h. The average uptake rates during the first 4 h were calculated as 24 and 42 pg per cell per hour for bare and silica-coated CoFe-MNPs in MCF-10A cells, respectively, and as 165 and 191 pg per cell per hour for bare and silica-coated MNPs in MDA-MB-231 cells, respectively. Moreover, compared to the bare CoFe-MNPs, the silica-coated ones exhibited a higher uptake rate and the number of internalized CoFe-MNPs was significantly higher for MDA-MB-231 cells than for MCF-10A cells.
Fig. 9. ICP-OES measurements of intracellular uptake of bare and silica-coated CoFe-MNPs in MDA-MB-231 and MCF-10A cells after 2 h, 4 h, 8 h and 24 h incubation. The iron concentrations of untreated cells were used as background.
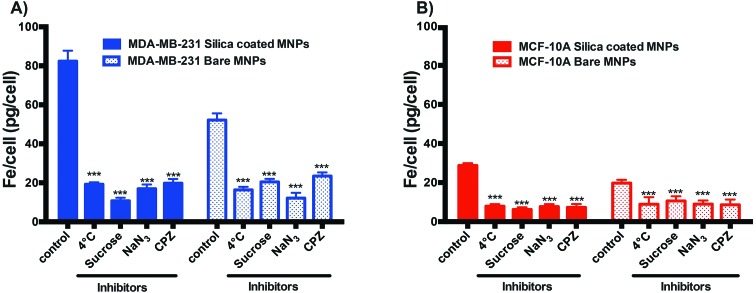
To clarify the route responsible for the cellular uptake of bare and silica-coated CoFe-MNPs, the cells were subjected to inhibitors. As can be seen from Fig. 10, the uptakes of the coated and bare CoFe-MNPs were significantly reduced by 27.5% and 45.32% in the MDA-MB-231 cell line and by 23.35% and 31.38% in the MCF-10A cell line at 4 °C, respectively, when compared to 37 °C (p < 0.001). Similarly, the metabolic inhibitors 0.45 M sucrose, 0.1% sodium azide, and 6 μg mL–1 chlorpromazine significantly prevented the delivery of the bare and coated CoFe-MNPs into both cell lines when compared to the control (p < 0.001).
Fig. 10. Uptake of bare and silica-coated CoFe-MNPs at 4 °C, in the presence of different endocytic inhibitors, 0.45 M sucrose, 0.1% NaN3 and 6 μg mL–1 chlorpromazine, compared to controls at 37 °C in (A) MDA-MB-231, (B) MCF-10A cells. The iron concentrations of untreated cells were used as background. *p < 0.05 vs. control, **p < 0.01 vs. control, ***p < 0.001 vs. control.
Evaluation of cytotoxicity by XTT assay
The cytotoxic effects of the bare and silica-coated CoFe-MNPs on MDA-MB-231 and MCF-10A cells were studied by using the XTT assay, at a final concentration of 3000 μg mL–1.
The lowest IC50 value was obtained in MDA-MB-231 cells treated with bare CoFe-MNPs for 48 h, followed by those treated for 24 h, as seen from Table 2. Treatment of both MDA-MB-231 and MCF-10A cells with bare CoFe-MNPs caused a strong reduction in viability, whereas the silica-coated CoFe-MNPs showed only slight toxicity, regardless of the surface charge. In general, MCF-10A cells were found to be more resistant to both types of CoFe-MNP treatment compared to MDA-MB-231 cells.
Table 2. IC50 values obtained on MDA-MB-231 and MCF-10A cells after exposure to bare and silica coated CoFe-MNPs.
| Particles CoFe-MNPs | IC50 (μg mL–1) 95% CI (confidence interval) |
||||
| Exposure time (h) | MDA-MB-231 | 95% CI | MCF-10A | 95% CI | |
| Silica coated MNPs | 4 | 1184 | 977 to 1436 | 2356 | 1719 to 3227 |
| 24 | 488 | 375 to 635 | 2076 | 1525 to 2826 | |
| 48 | 633 | 518 to 775 | 2256 | 1581 to 3218 | |
| Bare MNPs | 4 | 876 | 733 to 1046 | 1532 | 1164 to 2015 |
| 24 | 444 | 368 to 535 | 973 | 783 to 1210 | |
| 48 | 322 | 261 to 397 | 1289 | 951 to 1749 | |
MCF-10A cells did not exhibit cytotoxicity after exposure to either bare or silica-coated CoFe-MNPs at low concentrations; however, at the high concentration of 1500 μg mL–1, the viability decreased with bare CoFe-MNPs at all three time points (Table 2). Both bare and silica-coated CoFe-MNPs caused a dose-dependent decrease in cell viability for all cell lines and for all treatment durations (4, 24, 48 h) according to the XTT assay.
Evaluation of genotoxicity by the alkaline comet assay
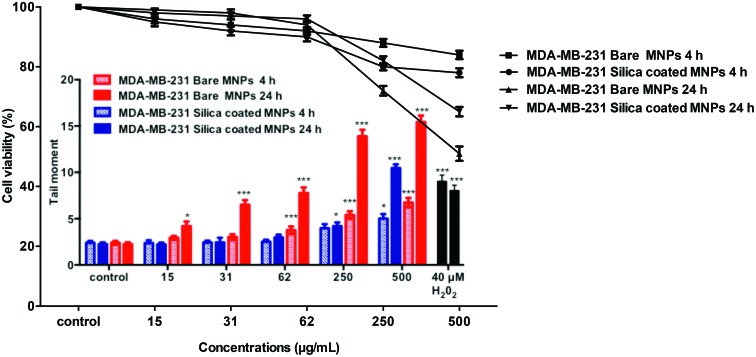
As seen in Fig. 11, bare CoFe-MNPs caused a concentration-dependent increase in the tail moment as the measure of DNA damage, which was statistically significant starting at a concentration of 62 μg mL–1 (p < 0.001) for 4 h and at 15 μg mL–1 (p < 0.05) for 24 h. Treatment of the cells with silica-coated CoFe-MNPs also caused a concentration-dependent increase in the tail moment, but a statistically significant increase was only found at 500 μg mL–1 (p < 0.001) for 4 h and at 250 μg mL–1 (p < 0.05) for 24 h in MDA-MB-231 cells.
Fig. 11. DNA damage in MDA-MB-231 cells after 4 and 24 h of exposure to different concentrations of bare and silica-coated CoFe-MNPs vs. olive tail moment (arbitrary units) and cell viability (%). *p < 0.05 vs. control, **p < 0.01 vs. control, ***p < 0.001 vs. control.
The cell viability measurements with trypan blue assay during the treatments exceeded 70% for all concentrations and time points used for MDA-MB-231 cells, except at a concentration of 500 μg mL–1 bare CoFe-MNPs for 24 h, in which case the viability decreased below 70% (Fig. 11).
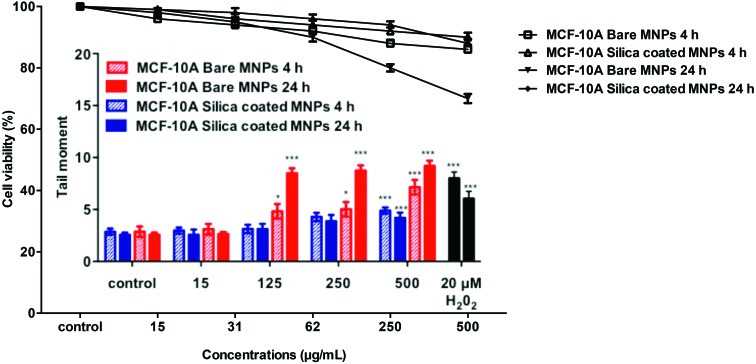
DNA damage was also found to be concentration-dependent for MCF-10A cells treated both with bare and silica-coated CoFe-MNPs for 4 and 24 h treatments (Fig. 12). A statistically significant increase in the tail moment was calculated throughout the concentration range of 125–500 μg mL–1 for both 4 and 24 h treatments with bare MNPs, but only at 500 μg mL–1 concentration and 24 h treatment for the silica-coated ones (p < 0.001). Also, in MCF-10A cells, the DNA damage was found to be lower compared to MDA-MB-231 cells. The cell viability exceeded 70% for all concentrations and time points used for MCF-10A cells (Fig. 12).
Fig. 12. DNA damage in MCF-10A cells after 4 and 24 h of exposure to different concentrations of bare and silica-coated CoFe-MNPs vs. olive tail moment (arbitrary units) and cell viability (%). Some of the concentrations (31–62 μg mL–1) are not shown, as their effects were not significant. *p < 0.05 vs. control, **p < 0.01 vs. control, ***p < 0.001 vs. control.
Evaluation of the genotoxicity by cytokinesis-blocked micronucleus (CBMN) assay
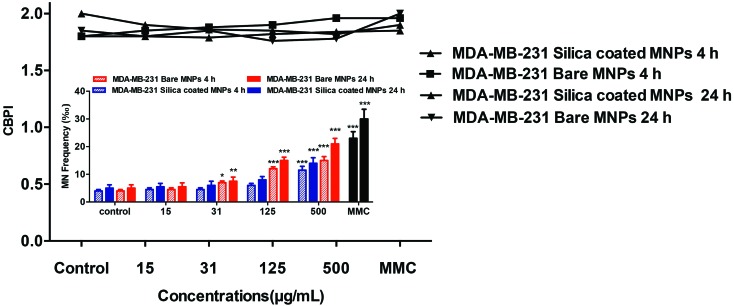
MDA-MB-231 cells treated with either bare or silica-coated CoFe-MNPs showed a concentration-dependent increase in the MN frequency (‰) as the measure of genotoxicity, which was statistically significant starting at 31 μg mL–1 (p < 0.01) in 4 and 24 h treatments for bare CoFe-MNPs. The silica-coated CoFe-MNPs caused a significant increase at 500 μg mL–1 concentration (p < 0.001) for 4 h and at concentrations of 250 μg mL–1 and 500 μg mL–1 (p < 0.001) for 24 h incubations. The results are given in Fig. 13. There was no statistically significant difference in the cytokinesis-blocked proliferation index (CBPI) among the treatments.
Fig. 13. Micronucleus (MN) frequency (‰) of MDA-MB-231 cells treated with bare and silica-coated CoFe-MNPs showing binucleated cell and CBPI (cytokinesis-blocked proliferation index). The data represent 2000 binucleated cells for MDA-MB-231. *p < 0.05 vs. control, **p < 0.01 vs. control, ***p < 0.001 vs. control.
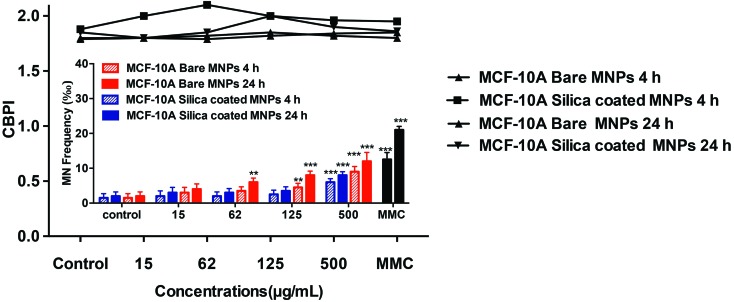
As seen in Fig. 14, MCF-10A cells treated with bare or silica-coated CoFe-MNPs also showed a concentration-dependent increase in the MN frequency (‰), which was statistically significant starting at 125 μg mL–1 (p < 0.01) in 4 h treatment and at 62 μg mL–1 (p < 0.01) in 24 h treatment with bare CoFe-MNPs. In contrast, there was no statistically significant MN induction below the concentration of 250 μg mL–1 for the silica-coated CoFe-MNPs in MCF-10A (p < 0.001) for 4 and 24 h treatments. The MN frequency (‰) in the bare-MNP-treated MCF-10A cells was higher than in those treated with the coated ones. Also, MN formation in MDA-MB-231 cells was higher than in MCF-10A cells for both 4 and 24 h treatments.
Fig. 14. Micronucleus (MN) frequency (‰) of MCF-10A cells treated with bare and silica-coated CoFe-MNPs showing binucleated cell and CBPI (cytokinesis-blocked proliferation index). The concentration 31 μg mL–1 is not given in this figure, as its effect was not significant. The data represent 2000 binucleated cells for MCF-10A. *p < 0.05 vs. control, **p < 0.01 vs. control, ***p < 0.001 vs. control.
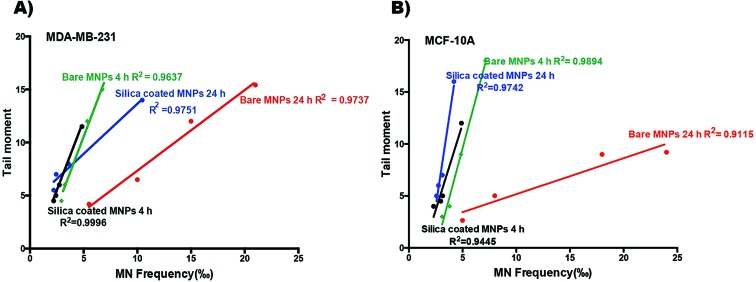
Moreover, a linear correlation was observed between the comet tail moment (DNA damage) and the MN frequency in MDA-MB-231 and MCF-10A cells after 4 h and 24 h exposure to 15, 32, 125 and 500 μg mL–1 of bare and silica-coated CoFe-MNPs (Fig. 15). Taken together, the correlation analysis between the overall MN frequency and the tail moment suggests that the MN assay and the comet assay have similar accuracy and precision for the genotoxicity assessment of CoFe-MNPs in both cells.
Fig. 15. Correlation between comet tail moment and MN frequency in (A) MDA-MB-231 and (B) MCF-10A cells after 4 and 24 h exposure to 15, 32, 125 and 500 μg mL–1 of bare and silica-coated CoFe-MNPs.
Discussion
In this study, bare and silica-coated CoFe-MNPs were prepared and characterized, and then their cellular uptake, cytotoxicity and genotoxicity were evaluated in both cancerous and noncancerous human breast cell lines in order to understand how these nanomaterials interact with living systems.
The characterization of NPs is essential for toxicity studies in terms of size and surface reactivity in biological systems.15,32 Accordingly, the size range of the CoFe-MNPs was smaller than 200 nm, which can be assumed as quite suitable for biomedical applications.33 All the CoFe-MNPs acquired a negatively charged surface. The absolute values of the zeta potentials were decreased to some extent when they were dispersed in the complete medium, revealing the adsorption of serum proteins which were less negatively charged at physiological conditions. In the culture media, the CoFe-MNPs were more stable and the serum proteins stabilized the particles by preventing strong aggregation.
It is also crucial to study NP uptake into the cell and to correlate it with the cellular response, which could also be linked to toxicity. Our studies revealed a clear relationship between the NP uptake and the incubation time. The cellular uptake and potential-saturated accumulation of both types of CoFe-MNPs were cell- and time-dependent. According to our results, the highest iron content, representing internalized CoFe-MNPs, was measured in cancerous MDA-MB-231 cells. Also, other studies have found that cancerous cells were more prone to the internalization of MNPs compared to noncancerous cells.34 The reason is that cancerous cells show more capacity for endocytosis compared to normal cells because of their metabolic activity.35 The TEM images demonstrated that the MNPs were localized in the cytoplasm, both for bare and silica-coated MNPs, while the nuclear membranes of the cells were still intact.
Our results also demonstrated that the uptake of CoFe-MNPs into the cells required an appropriate temperature. Several proteins and enzymes are sensitive to temperature, and they are inhibited at low temperatures.36,37 Exposure of the cells to MNPs in the presence of other metabolic inhibitors at 4 °C resulted, as expected, in a very strong inhibition of endocytosis and the internalization of CoFe-MNPs in both cell lines. Further results clearly showed that the CoFe-MNPs entered into the cells in an energy-dependent manner. Hence, endocytic pathways including macropinocytosis and clathrin-mediated endocytosis are possible as the predominant uptake mechanisms for both bare and silica-coated CoFe-MNPs.
The promising outcome of the cytotoxicity studies revealed that cancerous cells and bare MNPs were more vulnerable to toxicity compared to noncancerous cells and silica-coated MNPs, respectively. Similarly, in a previous study, high cytotoxicity was observed in the fast-growing human lung cancer cells (A549) compared to the slower-proliferating human dermal fibroblasts (HDFs).38 In our study, the cytotoxicity of the CoFe-MNPs was found to be decreased by surface coating, which was in concordance with the scientific literature.10,39 Bregar et al. reported that polyacrylic acid (PAA)-coated CoFe-MNPs did not exhibit cytotoxicity for short-term exposure.39 Additionally, Lee et al. observed that silica-coated functionalized cobalt ferrite MNPs had lower in vivo and in vitro cytotoxicity compared to the bare MNPs.10
Genotoxicity as an intermediate step of carcinogenesis has a diagnostic utility for hazard identification via genotoxicity testing methods. It is a prerequisite to use validated and standardized genotoxicity assays for newly developed or synthesized diverse arrays of NPs in order to determine their toxicity profiles.40 For NPs, primary (direct contact with DNA and indirect contact with the genetic material, i.e. via reactive oxygen species (ROS) generation) and secondary (inflammation-mediated) genotoxicity mechanisms are prevalent.12,41 Importantly, there is no genotoxicity study on CoFe-MNPs in the scientific literature. Thus, in this study, as a valuable contribution to MNP research, the in vitro genotoxicity of bare and silica-coated CoFe-MNPs was also evaluated for the first time by the in vitro cytokinesis-blocked micronucleus (CBMN) method and comet assay in both cancerous and noncancerous breast cell lines. In the mechanistic toxicity assessment of NPs, in vitro micronucleus assay and comet assay are used as valuable tools. In vitro micronucleus assay has been validated and appears in the OECD guidelines with the capability of reflecting clastogenic and aneugenic chromosomal anomalies.27
The comet assay, which we have used in parallel to the in vitro CBMN assay, is a sensitive method for detecting DNA strand breaks at the level of individual cells, by detecting many types of DNA damage, such as strand breaks, alkali labile sites, and incomplete excision repair sites.42 Since NPs have a large surface area to mass ratio, they are highly reactive for adsorbing or releasing free radicals, which can cause DNA damage,41 and these damages can be detected by the comet assay.
Both of the genotoxicity assays revealed similar results for the CoFe-MNPs even though they use different mechanisms to assess the genotoxicity. The micronucleus frequency and DNA damage in all cells were found to be increased by treatment with both bare and coated CoFe-MNPs in a concentration-dependent manner at non-cytotoxic concentrations. According to our results, bare CoFe-MNPs caused more cytotoxicity compared to silica-coated ones. Also, cancerous cells were more vulnerable to the genotoxic effects of the NPs. One reason is that noncancerous and cancerous cells have different tolerances to the same NPs depending on time and concentration. Cancer cells show increased oxidative stress due to oncogenic stimulation, high metabolic activity and mitochondrial dysfunction. These effects lead to DNA damage in cells which cannot be quickly repaired, causing gene instability, which may be triggered by nanoparticles.43 Even though the cellular uptake of the silica-coated CoFe-MNPs was higher than that of the bare ones, the higher genotoxicity of the bare CoFe-MNPs could be explained by the reactive surface effect of the bare MNPs. The modification of the MNP surface through the silica layer provides an additional protective coating, which reduces their toxicity and improves their biocompatibility. This strengthens the degradation process of the cobalt/iron core of the MNPs due to the acidic lysosomal environment. The results of this study suggest that silica-coated CoFe-MNPs can be safely and effectively used as nanocarriers for biomedical applications such as gene or drug delivery agents with effective uptake, especially into cancerous cells. In conclusion, for assessing the potential toxicity of different MNPs, the cell types, culture conditions, and surface modifications are very important. The results of international research suggest that each species of NPs should be considered as a different entity41 and a case-by-case44 approach should be used for hazard identification. In that respect, our results will contribute new data on CoFe-MNP-induced cytotoxicity, especially genotoxic effects, as there is no available data in the literature.
Acknowledgments
This research was supported by METU-BAP-07-02-2011-004 and TUBITAK 113Z557 grants.
References
- Kong L., Alves C. S., Hou W., Qiu J., Möhwald H., Tomás H., Shi X. ACS Appl. Mater. Interfaces. 2015;7:4833–4843. doi: 10.1021/am508760w. [DOI] [PubMed] [Google Scholar]
- Li L., Zhang L., Wang T., Wu X., Ren H., Wang and C., Su Z. Small. 2015;11:3082–3082. doi: 10.1002/smll.201403517. [DOI] [PubMed] [Google Scholar]
- Nelson K., Winter P., Shokeen M., Wang S. and Berezin M. Y., Nanoparticles for Bioimaging, in Nanotechnology for Biomedical Imaging and Diagnostics: From Nanoparticle Design to Clinical Applications, ed. M. Y. Berezin, John Wiley & Sons, Inc, Hoboken, NJ, 2014, 10.1002/9781118873151.ch6. [DOI] [Google Scholar]
- Mornet S., Vasseur S., Grasset F., Duguet E. J. Mater. Chem. 2004;14:2161–2175. [Google Scholar]
- Dähring H., Grandke J., Teichgräber U., Hilger I. Mol. Imaging Biol. 2015:1–7. doi: 10.1007/s11307-015-0848-2. [DOI] [PubMed] [Google Scholar]
- Majidi S., Zeinali Sehrig F., Samiei M., Milani M., Abbasi E., Dadashzadeh K., Akbarzadeh A. Artif. Cells, Nanomed., Biotechnol. 2015:1–8. doi: 10.3109/21691401.2015.1014093. [DOI] [PubMed] [Google Scholar]
- Amiri S., Shokrollahi H. Mater. Sci. Eng., C. 2013;33:1–8. doi: 10.1016/j.msec.2012.09.003. [DOI] [PubMed] [Google Scholar]
- Liu Y., Tourbin M., Lachaize S., Guiraud P. Powder Technol. 2014;255:149–156. [Google Scholar]
- Reddy L. H., Arias J. L., Nicolas J., Couvreur P. Chem. Rev. 2012;112:5818–5878. doi: 10.1021/cr300068p. [DOI] [PubMed] [Google Scholar]
- Lee D. S., Kim S. J. Nucl. Med. 2012;53:106–112. doi: 10.2967/jnumed.111.088443. [DOI] [PubMed] [Google Scholar]
- Choi J. Y., Lee S. H., Na H. B., An K., Hyeon T., Seo T. S. Bioprocess Biosyst. Eng. 2010;33:21–30. doi: 10.1007/s00449-009-0354-5. [DOI] [PubMed] [Google Scholar]
- Singh N., Manshian B., Jenkins G. J. S., Griffiths S. M., Williams P. M., Maffeis T. G. G., Wright C. J., Doak S. H. Biomaterials. 2009;30:3891–3914. doi: 10.1016/j.biomaterials.2009.04.009. [DOI] [PubMed] [Google Scholar]
- Fröhlich E. Int. J. Nanomed. 2012;7:5577–5591. doi: 10.2147/IJN.S36111. [DOI] [PMC free article] [PubMed] [Google Scholar]
- Love S. A., Maurer-Jones M. A., Thompson J. W., Lin Y.-S., Haynes C. L. Annu. Rev. Anal. Chem. 2012;5:181–205. doi: 10.1146/annurev-anchem-062011-143134. [DOI] [PubMed] [Google Scholar]
- Albanese A., Tang P. S., Chan W. C. W. Annu. Rev. Biomed. Eng. 2012;14:1–16. doi: 10.1146/annurev-bioeng-071811-150124. [DOI] [PubMed] [Google Scholar]
- Rivera-Gil P., Jimenez De Aberasturi D., Wulf V., Pelaz B., Del Pino P., Zhao Y., De La Fuente J. M., Ruiz De Larramendi I., Rojo T., Liang X.-J. Acc. Chem. Res. 2012;46:743–749. doi: 10.1021/ar300039j. [DOI] [PubMed] [Google Scholar]
- Zhu M., Nie G., Meng H., Xia T., Nel A., Zhao Y. Acc. Chem. Res. 2012;46:622–631. doi: 10.1021/ar300031y. [DOI] [PMC free article] [PubMed] [Google Scholar]
- Hoskins C., Wang L., Cheng W. P., Cuschieri A. Nanoscale Res. Lett. 2012;7:1–12. doi: 10.1186/1556-276X-7-77. [DOI] [PMC free article] [PubMed] [Google Scholar]
- Ye F., Laurent S., Fornara A., Astolfi L., Qin J., Roch A., Martini A., Toprak M. S., Muller R. N., Muhammed M. Contrast Media Mol. Imaging. 2012;7:460–468. doi: 10.1002/cmmi.1473. [DOI] [PMC free article] [PubMed] [Google Scholar]
- Malvindi M. A., De Matteis V., Galeone A., Brunetti V., Anyfantis G. C., Athanassiou A., Cingolani R., Pompa P. P. PLoS ONE. 2014;9(1):e85835. doi: 10.1371/journal.pone.0085835. [DOI] [PMC free article] [PubMed] [Google Scholar]
- Stone V., Johnston H., Schins R. P. Crit. Rev. Toxicol. 2009;39:613–626. doi: 10.1080/10408440903120975. [DOI] [PubMed] [Google Scholar]
- Kang Y. S., Risbud S., Rabolt J. F., Stroeve P. Chem. Mater. 1998;10:1733–1733. [Google Scholar]
- Liz-Marzán L. M., Giersig M., Mulvaney P. Langmuir. 1996;12:4329–4335. [Google Scholar]
- Aşık E., Aslan T. N., Volkan M., Güray N. T. Environ. Toxicol. Pharmacol. 2016;41:272–278. doi: 10.1016/j.etap.2015.12.004. [DOI] [PubMed] [Google Scholar]
- Roehm N. W., Rodgers G. H., Hatfield S. M., Glasebrook A. L. J. Immunol. Methods. 1991;142:257–265. doi: 10.1016/0022-1759(91)90114-u. [DOI] [PubMed] [Google Scholar]
- Singh N. P., Stephens R. E., Schneider E. L. Int. J. Radiat. Biol. 1994;66:23–28. doi: 10.1080/09553009414550911. [DOI] [PubMed] [Google Scholar]
- OECD, Test No. 487: In Vitro Mammalian Cell Micronucleus Test, 2015)
- Fenech M. Mutat. Res., Fundam. Mol. Mech. Mutagen. 2000;455:81–95. doi: 10.1016/s0027-5107(00)00065-8. [DOI] [PubMed] [Google Scholar]
- Lien Y.-H., Wu T.-M. J. Colloid Interface Sci. 2008;326:517–521. doi: 10.1016/j.jcis.2008.06.020. [DOI] [PubMed] [Google Scholar]
- Brewer S. H., Glomm W. R., Johnson M. C., Knag M. K., Franzen S. Langmuir. 2005;21:9303–9307. doi: 10.1021/la050588t. [DOI] [PubMed] [Google Scholar]
- Fu C., Yang H., Wang M., Xiong H., Yu S. Chem. Commun. 2015;51:3634–3636. doi: 10.1039/c4cc08372e. [DOI] [PubMed] [Google Scholar]
- Fadeel B., Garcia-Bennett A. E. Adv. Drug Delivery Rev. 2010;62:362–374. doi: 10.1016/j.addr.2009.11.008. [DOI] [PubMed] [Google Scholar]
- Ozpolat B., Sood A. K., Lopez-Berestein G. J. Intern. Med. 2010;267:44–53. doi: 10.1111/j.1365-2796.2009.02191.x. [DOI] [PubMed] [Google Scholar]
- Yu C., Zhao J., Guo Y., Lu C., Ma X., Gu Z. J. Biomed. Mater. Res., Part A. 2008;87:364–372. doi: 10.1002/jbm.a.31786. [DOI] [PubMed] [Google Scholar]
- Sincai M., Ganga D., Ganga M., Argherie D., Bica D. J. Magn. Magn. Mater. 2005;293:438–441. [Google Scholar]
- Kim J.-S., Yoon T.-J., Yu K.-N., Noh M. S., Woo M., Kim B.-G., Lee K.-H., Sohn B.-H., Park S.-B., Lee J.-K. J. Vet. Sci. 2006;7:321–326. doi: 10.4142/jvs.2006.7.4.321. [DOI] [PMC free article] [PubMed] [Google Scholar]
- Saraste J., Palade G. E., Farquhar M. G. Proc. Natl. Acad. Sci. U. S. A. 1986;83:6425–6429. doi: 10.1073/pnas.83.17.6425. [DOI] [PMC free article] [PubMed] [Google Scholar]
- Emanet M., Şen Ö., Çobandede Z., Çulha M. Colloids Surf., B. 2015;134:440–446. doi: 10.1016/j.colsurfb.2015.07.036. [DOI] [PubMed] [Google Scholar]
- Bregar V. B., Lojk J., Šuštar V., Veranič P., Pavlin M. Int. J. Nanomed. 2013;8:919. doi: 10.2147/IJN.S38749. [DOI] [PMC free article] [PubMed] [Google Scholar]
- Borm P. J. A., Robbins D., Haubold S., Kuhlbusch T., Fissan H., Donaldson K., Schins R., Stone V., Kreyling W., Lademann J. Part. Fibre Toxicol. 2006;3:11. doi: 10.1186/1743-8977-3-11. [DOI] [PMC free article] [PubMed] [Google Scholar]
- Stone V., Johnston H., Schins R. P. F. Crit. Rev. Toxicol. 2009;39:613–626. doi: 10.1080/10408440903120975. [DOI] [PubMed] [Google Scholar]
- Collins A. R. ochim. Biophys. Acta, Gen. Subj. 2014;1840:794–800. doi: 10.1016/j.bbagen.2013.04.022. [DOI] [PubMed] [Google Scholar]
- Pelicano H., Carney D., Huang P. Drug Resist. Updates. 2004;7:97–110. doi: 10.1016/j.drup.2004.01.004. [DOI] [PubMed] [Google Scholar]
- SCENIHR, Risk Assessment of Products of Nanotechnologies, 2015. [Google Scholar]


