Summary
The thymus is responsible for generating a diverse yet self-tolerant T cell pool 1. While the thymic medulla is largely composed of developing and mature AIRE+ epithelial cells, recent evidence suggests far greater heterogeneity amongst medullary thymic epithelial cells than previously appreciated 2. Here we describe in detail an epithelial subset which shares striking similarity to peripheral tuft cells found at mucosal barriers 3. As in the periphery, thymic tuft cells express the canonical taste transduction pathway and IL25. However, they are unique in their spatial association with cornified aggregates, ability to present antigen, and expression of a broad diversity of taste receptors. Some thymic tuft cells pass through an Aire-expressing stage and depend on a known AIRE-binding partner, HIPK2 for their development. Remarkably, the taste chemosensory protein TRPM5 is required for their thymic function where they support the development and polarization of thymic iNKT cells and act to establish a medullary microenvironment enriched in the type 2 cytokine, IL4. These findings suggest a compartmentalized medullary environment where differentiation of a minor and highly-specialized epithelial subset plays a non-redundant role in shaping thymic function.
Medullary thymic epithelial cells (mTECs) develop through a coordinated pathway where Aire-negative MHCIIlo precursors receive inductive signals, including RANKL and CD40L, mature into MHCIIhi CD80hi (mTEChi) Aire- and tissue specific antigen (TSA)-expressing cells, and promote central tolerance through negative selection and generation of thymically derived tTregs 2. We developed a lineage tracing model in which Aire-expressing cells were inducibly labelled with a fluorescent reporter (Aire-CreERT2-R26-CAG-Stopfl-tdTomato or zsGreen; inducible Aire Lineage Trace, iALT) 4. In iALT mice treated with a single dose of tamoxifen, four mTEC subsets could be distinguished based on MHCII expression and RFP, including a post-Aire (MHCIIlo RFP+) population 4.
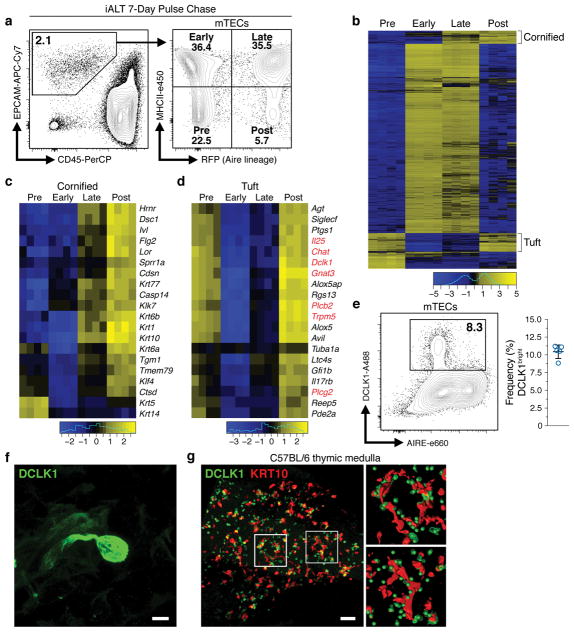
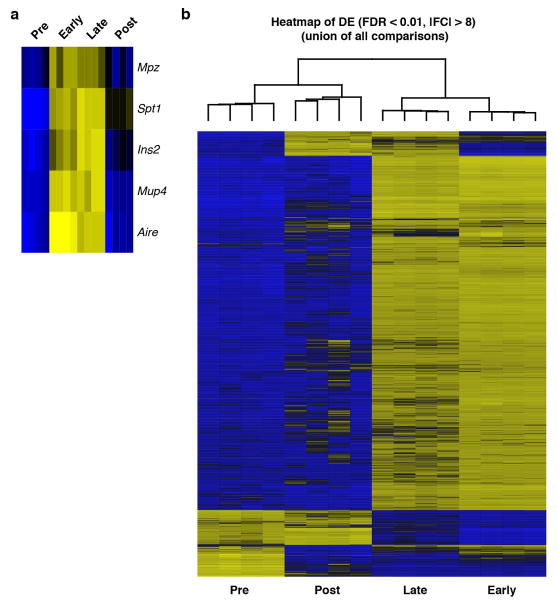
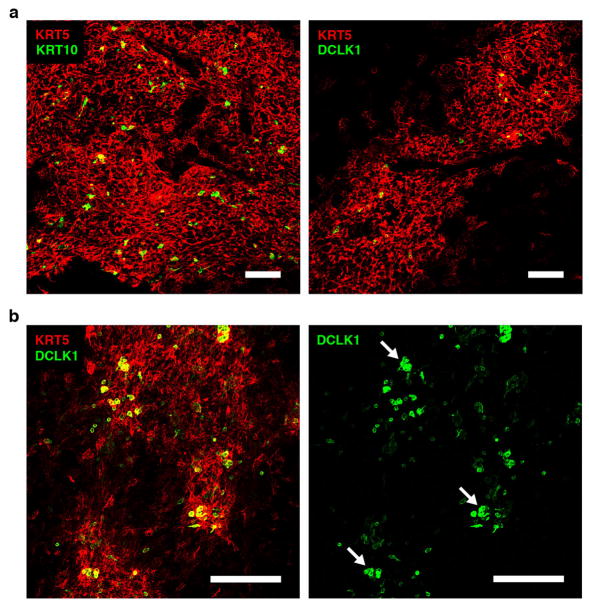
To interrogate mTEC heterogeneity we flow sorted (FACS) iALT-labeled mTECs and examined their transcriptomes (Fig. 1a, b). Bulk RNA sequencing (RNA-seq) revealed the highest levels of Aire and TSA transcripts in the early-Aire (MHCIIhi RFPlo) and late-Aire (MHCIIhi RFPhi) subsets and unsupervised hierarchical clustering showed these populations to be most related to one another (Extended Data Fig. 1a, b). In the post-Aire subset, two distinct transcriptional signatures emerged. The first was enriched for markers of the soft cornified epithelial pathway, including the late-stage cytokeratin, Krt10 (Fig. 1b, c) 5. This is consistent with the observation of cornified bodies within human thymus, known as Hassall’s corpuscles, and recent reports of cornified markers within murine thymus 6–10. Immunofluorescent (IF) analysis confirmed robust expression of KRT10 protein in wild-type thymus and confocal microscopy revealed the distinctive morphology of medullary KRT10+ structures (KRT10 bodies) (Extended Data Fig. 2a).
Figure 1. Tuft-like cells are closely associated with cornified bodies in the thymic medulla.
a, Gating of mTEC subsets within CD11c− CD45− EPCAM+ thymic epithelial cells. Sorted in quadruplicate for RNA-seq (12 pooled thymi per replicate, n = 4 sorted replicates). b, Heatmap of differentially expressed genes (FDR < 0.01 and |FC| > 8). c, d, Selected genes from regions marked ‘Cornified’ or ‘Tuft’. Log2 fold change relative to mean expression. e, DCLK1 intracellular staining in mTECs (mean +/− SD). n = 5 mice; 3 independent experiments. f, Confocal maximum projection of a DCLK1bright cell. Scale, 5 μm. n = 5 mice, 3 independent experiments. g, Confocal maximum projection (z = 77 μm) of a medullary region at low magnification. Right, regions of interest (white squares) with KRT10 converted to surfaces and DCLK1 converted to center of intensity coordinates. Scale, 100 μm. n = 3 thymic slices, 2 independent experiments.
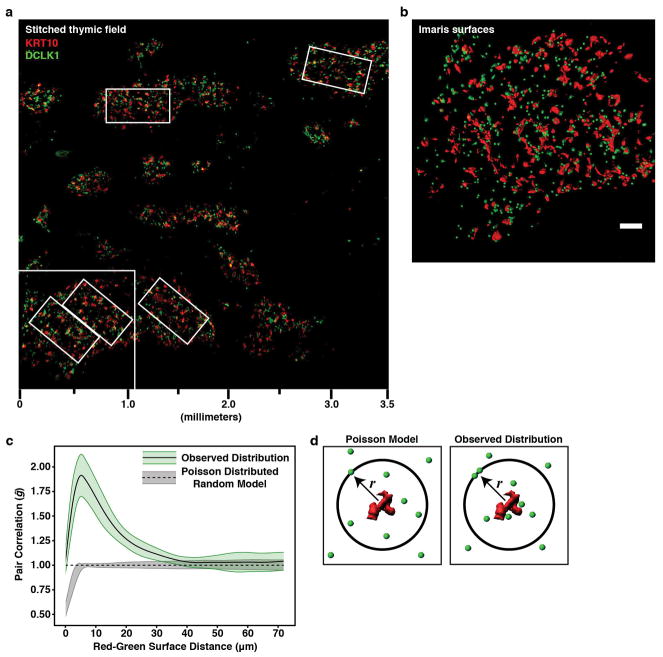
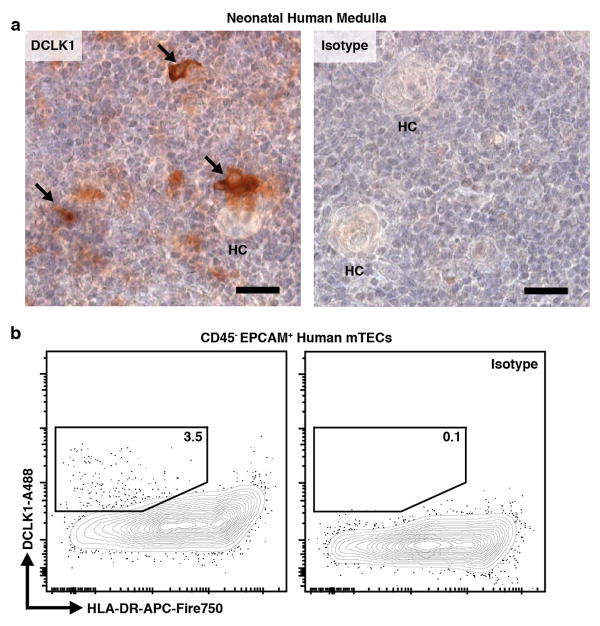
The second transcriptional signature included genes associated with an enigmatic epithelial subset called tuft cells (Fig. 1b, d) 11. Recent reports have shown these cells to play a non-redundant chemosensory role in the intestine where they orchestrate a feed-forward loop driving the type 2 response to helminths and protozoa 12–14. Tuft cells are notable for their expression of the canonical taste transduction pathway (i.e. Gnat3, Plcg2/Plcb2, and Trpm5), choline O-acetyltransferase (Chat), doublecortin-like kinase 1 (Dclk1), and as the sole source of the barrier associated cytokine, Il25 (Fig. 1d) 3,15. The downstream cation channel, Trpm5, is required for tuft function in the intestine, but the upstream sensory receptor(s) remain unknown, though some peripheral tuft cells express a limited repertoire of type II taste receptors from the bitter ligand family (Tas2r) 16,17. Flow cytometric analysis of mTECs demonstrated that approximately 10% of mTECs in adult C57BL/6 thymus were DCLK1bright and IF staining showed DCLK1bright mTECs distributed throughout the medulla (Fig. 1e and Extended Data Fig. 2a, b). These cells frequently had a bulbous morphology, narrow protruding base, and were often grouped into small multicellular clusters (Fig. 1f and Extended Data Fig. 2b) 15. Unexpectedly, DCLK1bright cells were closely associated with KRT10 bodies and quantitative image analysis confirmed they were significantly more likely to be adjoining KRT10 surfaces than predicted by random modeling (Fig. 1g and Extended Data Fig. 3a–d). In human thymus, medullary DCLK1bright cells regularly abutted Hassall’s corpuscles, and were 3.5% of CD45− EPCAM+ TECs (Extended Data Fig. 4a, b).
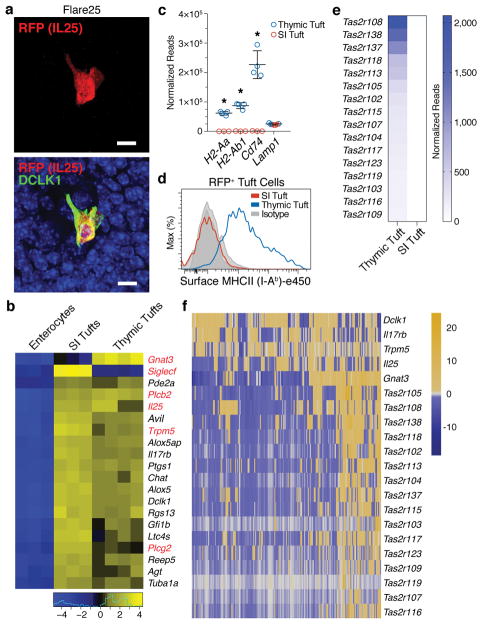
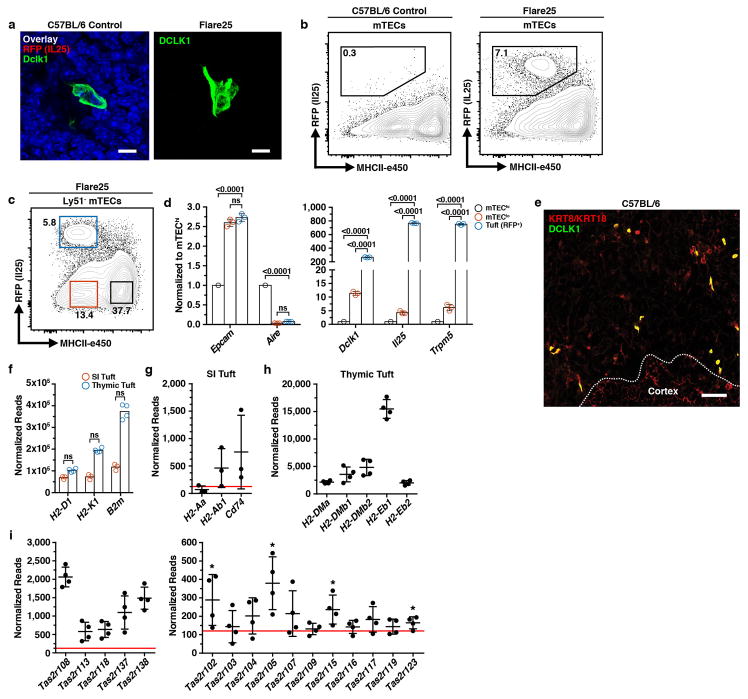
While the presence of CHAT, GNAT3, and expression of several Tas2r family members has been reported in AIRE− mTECs by Panneck et al. and Soultanova et al., the significance of these observations has been unclear 18,19. Therefore, we wished to understand how closely related DCLK1bright mTECs were to intestinal tuft cells. We used the Flare25 IL25-RFP reporter to confirm that DCKL1bright mTECs expressed IL25 12. RFP+ cells were dispersed throughout the medulla and co-localized with DCLK1, confirming tonic IL25 production, and were approximately 7–10% of mTECs (Fig. 2a and Extended Data Fig. 5a, b). We then used the Flare25 reporter to sort small intestinal (SI) enterocytes (RFP−), SI tuft cells (RFP+), and thymic RFP+ cells for bulk RNA-seq and compared expression of 20 tuft markers (Fig. 2b) 11,20. Of these, 18 were highly-expressed in SI tuft cells and thymic RFP+ mTECs, whereas none were expressed in RFP− SI enterocytes. Notably, only RFP+ mTECs strongly expressed Gnat3, the Gα subunit of gustducin and upstream mediator of the taste signal transduction pathway, but both populations expressed Trpm5 (Fig. 2b) 21,22. Flow sorting and qRT-PCR analysis confirmed that RFP+ mTECs were the dominant source of Il25 and Trpm5 mRNA (Extended Data Fig. 5c, d). Finally, DCLK1bright mTECs were also observed to be KRT8/18+, consistent with peripheral tuft cells (Extended Data Fig. 5e). These data confirm that thymic DCLK1bright cells represent a novel subset of tuft cells.
Figure 2. Thymic Dclk1bright cells are a novel subset of tuft cells.
a, Co-localization of DCLK1 and RFP (IL25) in Flare25 thymus. Confocal maximal projection. Scale, 5 μm. n = 3 mice, 2 independent experiments. b, Differential expression of 20 tuft markers comparing sorted enterocytes and SI tuft cells (n = 3 mice) and thymic tuft cells (n = 4 mice) from Flare25 mice. Log2 fold change relative to mean expression. c, Expression (normalized reads from b) of MHCII genes in SI and thymic tuft cells (mean +/− SD). * FDR < 0.00001. Lamp, FDR = 1. d, MHCII (I-Ab) surface staining on SI and thymic tuft cells. n = 3 mice; 2 independent experiments. e, Heatmap of select Tas2r genes comparing expression (normalized reads from b) between thymic and SI tuft cells. f, Single cell RNA sequencing of RFP+ (IL25+) thymic tuft cells. Heatmap shows selected tuft and Tas2r gene expression. Columns are single cells (n = 195), values are mean-centered log-normalized.
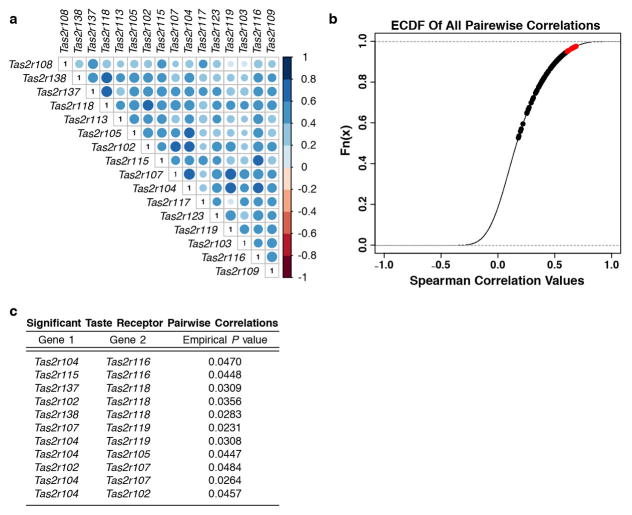
Despite shared core transcriptional features, we hypothesized thymic tuft cells might differ from their peripheral counterparts in important ways, such as the ability to present antigen. SI tuft cells expressed MHCI and β2-microglobulin but only thymic tuft cells expressed MHCII genes and CD74 (Fig. 2c and Extended Data Fig. 5f–h). MHCII protein on the surface of thymic tuft cells was confirmed by flow cytometry, though overall surface levels were lower than AIRE+ mTEChi (Fig. 1a and 2d). While SI tuft cells don’t express any of the known Tas2r family members, at the bulk RNA level thymic tuft cells express a broad array of these receptors (Fig 2e and Extended Data Fig. 5i). When examined at the single cell level, Tas2r genes tended to be co-expressed in single cells, though Tas2r expression was far more heterogeneous than Dclk1 or Trpm5 (Fig. 2f and Extended Data Fig. 6a and 7b). When co-expression of Tas2r genes was compared to the background gene set, many Tas2r gene pairs were significantly highly correlated (empirical P < 0.05), suggesting that expression is not random and subsets of thymic tuft cells may be coordinated in their chemosensory specificities (Extended Data Fig. 6a–c). Those cells expressing Tas2r family members also tended to express Gnat3 and co-express 3–8 family members (Fig. 2f and Extended Data Fig. 7b). These unique properties of thymic tuft cells raised the possibility that they participate in antigen presentation to developing thymocytes and may use their chemosensory abilities as part of their thymic function.
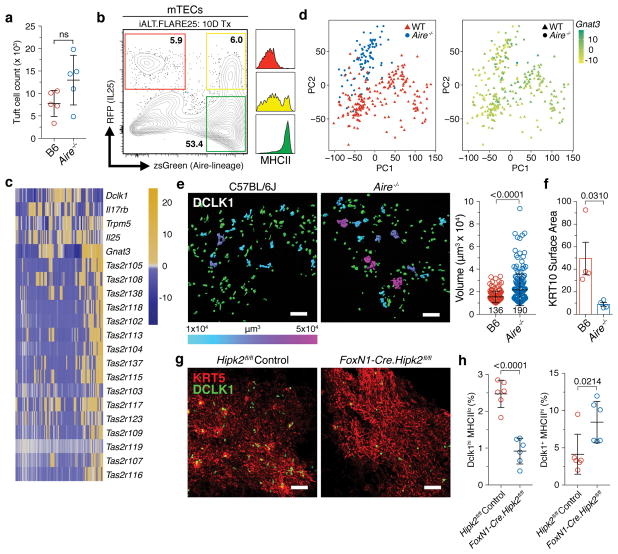
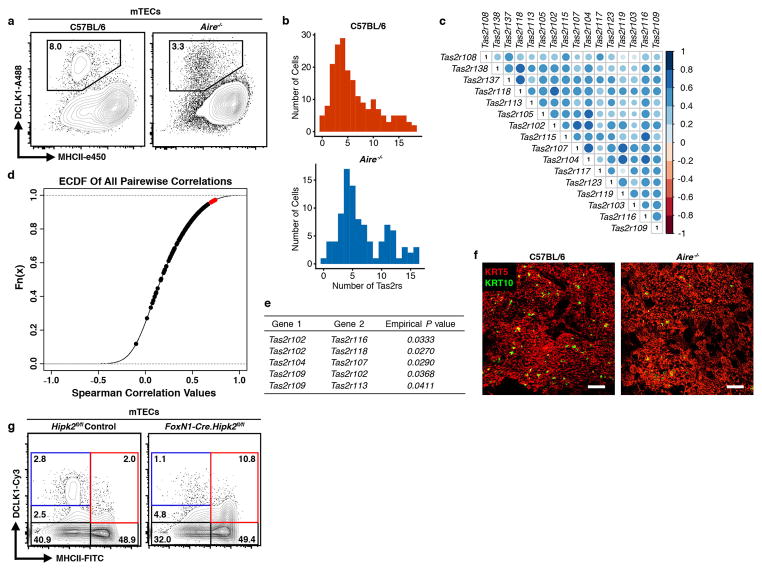
Surprisingly, Aire−/− animals had normal numbers of thymic tuft cells (Fig. 3a and Extended Data Fig. 7a) 23. Following tamoxifen treatment for 10 days, iALT x Flare25 reporter thymi had an RFP single-positive population as well as a clear double-positive mTEC population, confirming that some thymic tuft cells pass through an Aire-expressing stage but also suggesting the existence of an Aire-independent pathway (Fig. 3b). This is consistent with the thymic tuft signature appearing in both the pre- and post-Aire populations (Fig. 1b). At the single cell level, Aire−/− thymic tuft cells showed a similar pattern of expression of core markers and Tas2r family members as in wild-type cells (Fig. 3c and Extended Data Fig. 7b–e and 8a, b). However, principal component analysis (PCA) showed that the majority of Aire−/− thymic tuft cells largely separated from wild-type (Fig. 3d). Interestingly, Gnat3 was a driver of the variation observed in PC1 and showed heterogeneous expression across both wild-type and Aire−/− cells (Fig. 3d). This separation was supported by quantitative image analysis of Aire−/− thymic sections which had a marked increase in the frequency and size of tuft cell aggregates (Fig. 3e). Notably, there was a marked decrease in KRT10 bodies in Aire−/− thymus which may contribute to the observed disorganization of the thymic tuft compartment (Fig. 3e, f and Extended Data Fig. 3c and 7f) 23.
Figure 3. Aire is expressed by some thymic tuft cells but is not required for their development.
a, DCLK1bright mTEC counts. n = 5 mice per genotype; 3 independent experiments. b, mTECs from iALT.Flare25 double-reporter mice after 10-day tamoxifen treatment. Right, MHCII (I-Ab) surface expression within each gated population. n = 5 mice; 2 independent experiments. c, Single cell RNA sequencing of RFP+ (IL25) Aire−/− thymic tuft cells. Heatmap shows selected tuft and Tas2r gene expression. Columns are single cells (n = 95), values are mean-centered log-normalized. d, PCA of single cell RNA sequencing data from RFP+ tuft cells. Right, Gnat3 expression overlaid. e, DCLK1 staining with signal converted to Imaris surfaces; volumes > 5x mean single-cell volume (1×104 μm3) are pseudocolored according to size. Right, pooled data. n = 3 mice per genotype. f, KRT10 surface area in thymic medulla (per unit area). Three regions analyzed per thymus. n = 4 mice per genotype; 2 independent experiments. g, h, Analysis of DCLK1bright cells in Hipk2fl/fl controls or FoxN1-Cre.Hipk2fl/fl thymus. g, Confocal imaging of IF staining. h, Frequencies of DCLK1hi MHCIIlo or DCLK1+ MHCIIhi mTECs from flow analysis. n = 6 mice; 3 independent experiments. e, g, Scale, 100 μm. a, e, f, h, Mean +/− SD; unpaired, parametric, 2-tailed Student’s t test.
Hipk family members mediate signal integration and cell fate decisions during the differentiation of complex tissues. Rattay et al. reported Hipk2 as a novel AIRE binding partner but, surprisingly, mTEC-specific ablation of Hipk2 had a minor effect on mTEChi gene expression, including TSAs 24. Instead, there was decreased expression of a subset of genes within MHCIIlo mTECs, including a preponderance of tuft-associated genes. As such, we hypothesized that HIPK2 might promote differentiation of thymic tuft cells. Indeed, FoxN1-Cre-Hipk2fl/fl mice had a profound reduction in the frequency of MHCIIlo DCLK1bright cells with a concomitant increase in MHCIIlo and MHCIIhi DCLK1dim cells, suggesting a developmental blockade (Fig. 3g, h and Extended Data Fig. 7g). Therefore, we describe a novel Hipk2-dependent mechanism for tuft cell differentiation.
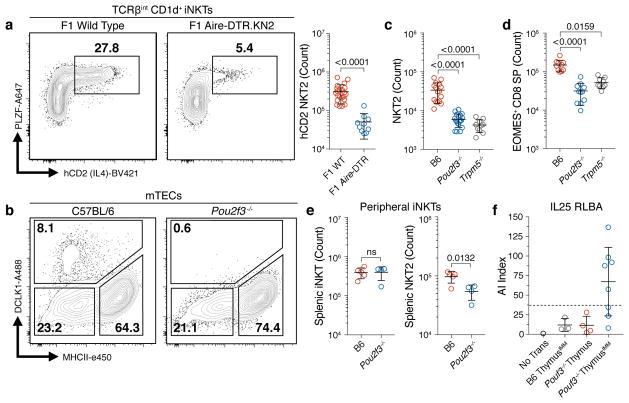
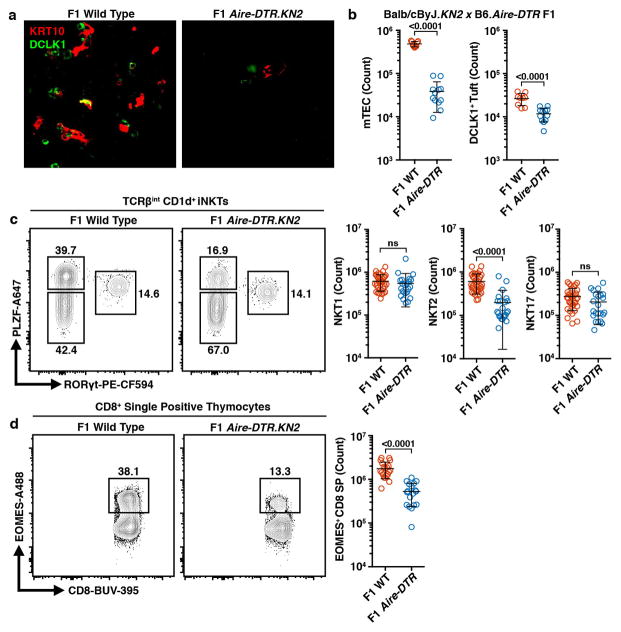
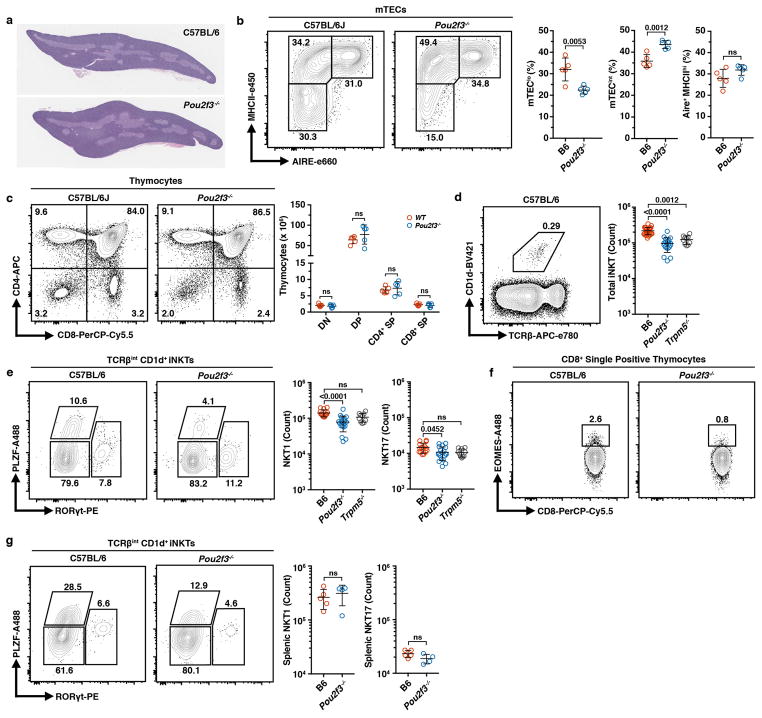
Because tuft cells drive intestinal type 2 immune responses, we hypothesized they might promote a type 2 microenvironment in the thymus. Previous work has shown type 2 invariant natural killer T (NKT2) cells to be the dominant source of interleukin-4 (IL4) in the medulla 25,26. We utilized the Balb/cByJ × C57BL/6.Aire-DTR F1 model, characterized by increased numbers of thymic NKT2 cells and IL4-dependent EOMES+ CD8+ single-positive (SP) thymocytes, and ablated post-Aire tuft cells with a 9-day course of DT (Extended Data Fig. 9a, b) 26. This resulted in a selective reduction in the number of NKT2 cells and EOMES+ CD8+ SP thymocytes (Extended Data Fig. 9c, d) 26. Importantly, there was a dramatic decrease in IL4 production by remaining NKT2 cells (Fig. 4a). Because this model ablates both mTEChi and post-Aire mTECs, we exploited the requirement for the transcription factor Pou2f3 for peripheral tuft cell development 27. As in the periphery, we found no thymic tuft cells in Pou2f3−/− mice but a normal frequency of AIRE+ mTECs, grossly normal thymic architecture, and normal numbers of double negative, double positive, and SP thymocytes (Fig. 4b and Extended Data Fig. 10a–c). However, there were fewer TCRβint CD1d+ iNKTs and, as in the F1 model, there was a marked decrease in NKT2 cells and EOMES+ CD8+ SP thymocytes (Fig. 4c, d and Extended Data Fig. 10d–f). Remarkably, Trpm5−/− mice phenocopied the Pou2f3−/− thymocyte perturbations, demonstrating its requirement for thymic tuft cell function (Fig. 4c, d). Finally, the number of splenic NKT2 cells was selectively reduced in Pou2f3−/− mice, mirroring the thymic defect (Fig. 4e and Extended Data Fig. 10g). Together, these data show that thymic tuft cells are critical for the development and intrathymic function of NKT2s, require components of the canonical taste chemosensory pathway, and contribute to the availability of thymic IL4.
Fig. 4. Thymic tuft cells promote an IL4-enriched medullary microenvironment and enforce tolerance.
a, DT-treated Balb/cByJ.KN2 x C57BL/6.Aire-DTR F1 thymus (n = 10 mice) or non-Tg controls (n = 22 mice) gated on TCRβint CD1d+ iNKTs. Right, counts of IL4-producing (hCD2+) NKT2s (PLZF+). b, DCLK1 intracellular staining in mTECs. n = 5 mice; 3 independent experiments. c, Thymic NKT2 (TCRβint CD1d+ PLZF+ RORγt−) cell counts in B6 (n = 15 mice), Pou2f3−/− (n = 19 mice) and Trpm5−/− (n = 10 mice). d, Thymic EOMES+ TCRβ+ CD8+ SP cell counts in B6 (n = 10 mice), Pou2f3−/− (n = 11 mice) and Trpm5−/− (n = 9 mice). e, Splenic total iNKT and NKT2 cell counts in B6 (n = 5 mice) and Pou2f3−/− (n = 4 mice). f, Serum anti-IL25 autoantibody indices (AI) in nude mice transplanted with C57BL/6 (n = 3 mice) or Pou2f3−/− (n = 12 mice) neonatal thymus and immunized with IL25 protein. IMM = immunized. Dashed line = average of C57BL/6 AI values plus 3 standard deiviations. of a, c–f, Mean +/− SD. a, e, Unpaired, parametric, 2-tailed Student’s t test. c, d, One-way, non-parametic ANOVA (Kruskal-Wallis test). a, c, d, Pooled from 3 independent experiments.
Given that thymic tuft cells express surface MHCII, they could present self-antigens not covered by the mTEChi population. To test this directly, we utilized a thymic transplant model in which C57BL/6 or Pou2f3−/− thymocyte-depleted neonatal thymi were transplanted into athymic FoxN1−/− nude mice, allowed to reconstitute, and immunized with IL25 protein. Remarkably, only Pou2f3−/− transplant recipients, which had peripheral tuft cells but lacked thymic tuft antigen expression, generated an IL25-specific antibody response (Fig. 4f). Therefore, thymic tuft cells are required to enforce tolerance to a canonical tuft-restricted antigen and likely serve this purpose for other such proteins.
Our findings reveal a previously undescribed microanatomical niche consisting of terminally differentiated cornified epithelial cell aggregates and thymic tuft cells. Thymic tuft cells are a novel tuft subset displaying characteristics of both mTECs and peripheral tuft cells. Their development is dependent on the transcription factors Pou2f3 and Hipk2, a known AIRE-binding partner. We demonstrate a role for thymic tuft cells in the establishment of an IL4-enriched medullary microenvironment through NKT2-mediated IL4 production. Thymic tuft cells depend on Trpm5 for their function, strongly implying they respond to local environmental cues through their chemosensory abilities. In sum, our findings provide a novel source of antigen required for the establishment of tolerance and an upstream mediator of thymic IL4 production via an innate-like (iNKT) lymphoid pathway. The former extends our knowledge of an established role for the thymus in immune function and the latter underscores an emerging role for adaptive effector cytokines beyond peripheral immune responses, including thymocyte development.
Methods
Mice
Aire−/−, Aire-CreERT2, Aire-DTR, iALT, Flare25, Hipk2fl/fl, Trpm5−/−, Balbc/ByJ.KN2, and FoxN1-Cre have been previously described 4,12,24,26–30. Pou2f3−/− (Pou2f3tm1.1(KOMP)Vlcg, Project ID #VG18280) sperm were obtained from the DTCC-KOMP2 Consortium and animals were rederived by the UCSF Rederivation Core. Flare25 and Trpm5−/− mice were kindly provided by J.v.M. and R.M.L. (UCSF). C57BL/6 (Jax #000664), Balbc/ByJ (Jax #001026), B6.Cg-Gt(ROSA)26Sortm14(CAG-tdTomato)Hze/J (Jax #007914), B6.Cg-Gt(ROSA)26Sortm6(CAG-ZsGreen1)Hze/J (Jax # #007906) mice were obtained from The Jackson Laboratory 31.
Most mice were maintained in the University of California San Francisco (UCSF) specific pathogen-free animal facility in accordance with the guidelines established by the Institutional Animal Care and Use Committee (IACUC) and Laboratory Animal Resource Center and all experimental procedures were approved by the Laboratory Animal Resource Center at UCSF. Some mice were maintained in the German Cancer Research Center (DKFZ) specific pathogen-free animal facility in accordance with the European Convention for the Protection of Vertebrate Animals used for Experimental and Other Specific Purposes and the German Legislation. Some mice were maintained at the University of Minnesota under specific-pathogen-free conditions in accordance with the guidelines established by the IACUC. Mice aged 4–8 weeks were used for all experiments unless otherwise specified in the text or figure legends. Mice were age-matched in figures displaying a single representative experiment and in pooled data. Mice were sex matched when possible.
In vivo mouse treatments
Diphtheria toxin (DT, Sigma-Aldrich) was administered Aire-DTR mice at a dose of 25–50 ng/g every other day via intraperitoneal (i.p.) injections for a total of 5 injections for all experiments. For Tamoxifen treatment of mice possessing conditional alleles, Tamoxifen (Sigma-Aldrich) was dissolved in corn oil (Sigma-Aldrich) and 2mg doses were administered by oral gavage with flexible plastic feeding tubes (Instech). For continuous treatment, animals were gavaged every other day until the experimental endpoint.
Mice were immunized with 100 μg of recombinant mouse IL25 protein in PBS (rmIL25, R&D Systems) emulsified 1:1 v/v in CFA containing 4 mg/ml heat-inactivated Mycobacterium Tuberculosis, strain H37a (Chondrex). A total of 200ul was injected subcutaneously, divided equally between both sides. Three weeks later serum was collected for analysis and stored at −20°C until radioligand binding analysis.
Bulk RNA sequencing sample preparation and analysis
Single-cell epithelial suspensions were isolated and stained as described below and then sorted using a FACS Aria III or Aria Fusion (BD Biosciences). Cells were sorted directly into DMEM (ThermoFisher) containing 10% FBS, pelleted, and snap frozen in liquid nitrogen before total RNA extraction. For lineage tracing, approximately 80,000 pre-Aire, 150,000 early-Aire, 150,000 late-Aire, and 25,000 post-Aire cells were collected for each biological replicate. For Flare25 RFP+ small intestine (SI) and thymic tuft cells, approximately 35,000 SI RFP+ and 1,750 thymic RFP+ cells were collected for each biological replicate. Intact mRNA was isolated using the Dynabead mRNA Purification Kit for total RNA (ThermoFisher) and amplified cDNA was prepared using the NuGen Ovation RNA-Seq system V2 kit, according to the manufacturer’s protocol (NuGen Technologies). Sequencing libraries were generated using the Nextera XT library preparation kit with multiplexing primers, according to manufacturer’s protocol (Illumina). Library fragment size distributions were assessed using the Bioanalyzer 2100 and the DNA high-sensitivity chip (Agilent Technologies). Library sequence quality was assessed by sequencing single-end 50 base pair reads using the Illumina MiSeq platform and were pooled for high-throughput sequencing on the Illumina HiSeq 4000 by using equal numbers of uniquely mapped reads (Illumina). 12 samples per lane were multiplexed to ensure adequate depth of coverage. The analytic pipeline included de-multiplexing raw sequencing results, trimming adapter sequences, and aligning to the reference genome. Sequence alignment and splice junction estimation was performed using the STAR (https://code.google.com/p/rna-star) software program. For differential expression testing, the genomic alignments were restricted to those that map uniquely to the set of known Ensembl IDs (including all protein coding mRNAs and other coding and noncoding RNAs). STAR aggregated mappings on a per-gene basis were used as raw input for normalization by DESeq2 software.
Single-cell RNA sequencing and computational analysis
Single-cell epithelial suspensions were isolated and stained as described below and sorted using a FACS Aria Fusion (BD Biosciences). Single cells were sorted into individual wells of a 96 well plate (Bio-Rad) containing 5 μl of lysis solution and sequencing libraries were prepared using the smart-seq2 method as reported with the following modifications 32. Batch one: 0.1 μl of a 1:1,000,000 dilution of ERCC Spike-In Mix (Life Technologies) in RNase-free water was include in the reverse transcription master mix. Batch 2: 1 μl of a 1:1,000,000 dilution of ERCC Spike-In Mix (ThermoFisher) in RNase-free water was included in a total volume of 5 μl lysis buffer. For both batches 21 cycles of initial PCR amplification were performed and a ratio of 0.56:1.0 (beads/total PCR volume; instead of 1.0:1.0) of Ampure XP beads (Beckman Coulter) was used for the first PCR purification to minimize primer dimer carryover. After the first PCR amplification, cDNA libraries were screened via quantitative PCR (we used a 1:10 dilution of purified cDNA libraries for quantitative PCR) for expression of a mouse housekeeping gene (Ubc), and the distribution of library size was checked on a Bioanalyzer instrument (Agilent) as reported. Only cDNA libraries that passed both quality controls were processed further. 50 pg of cDNA was used for the “tagmentation” (transposase-based fragmentation) reaction and 12 cycles were applied for the final enrichment PCR. The final purification step was performed with a ratio of 0.6:1.0 (as above) of Ampure XP beads (Beckman Coulter).
In batch one, 96 cells were initially ‘multiplexed’ with 48 samples per Illumina HiSeq 2500 lane. 31 additional cells were then ‘multiplexed’ with 96 samples per Illumina HiSeq 2500 lane and 58 base pair single end sequencing was performed. We observed no batch effect between these two sets. In batch two, 92 Flare25 cells and 96 Flare25.Aire−/− cells were ‘multiplexed’ with 96 samples per Illumina HiSeq 2500 lane. A negative control and a 50-cell positive control were sequenced from each sample. Flare25 and Flare25.Aire−/− cells were split evenly between sequencing lanes and 85 base pair single end sequencing was performed. HiSeq sequencing lanes typically yielded between ~150 × 106 and ~200 × 106 reads for both batches.
Raw data reads were aligned to the GRCm38 build of the Mus musculus genome using the STAR alignment software 33. Cells were required to have a minimum of 40% total reads mapping to the genome, which all our cells met. Reads uniquely aligned to mRNA genes were counted with featureCounts, a part of the Subread software package 34. Genes present in a minimum of 5 cells and with at least 10 reads were retained in the analysis. Cells expressing fewer than 750 genes with 10 reads were removed from the analysis. All cells were required to have a minimum of 100,000 total reads mapping to genes, and less than 10% percent of reads mapping to mitochondrial genes. This resulted in 197 Flare25 cells and 95 Flare25.Aire−/− cells for further downstream analysis.
Data were normalized using the indeXplorer pipeline (https://git.embl.de/velten/indeXplorer) 35. Briefly, data were fitted to error models using the SCDE software to model dropout events and over-dispersion of genes and the posterior odds ratio (POR) was used as a normalized measure of gene expression values 35,36.
The effect of mitochondrial read counts were regressed out before all further downstream analysis. Principle component analyses were performed on the total set of cells, included both Flare25 and Flare25.Aire−/− cells, using the “prcomp” function from the “stats” R package. Heatmaps were generated by calculating the mean centered expression values for each gene across all cells and clustered within genotype (independently for Flare25 and Flare25.Aire−/−) using hierarchical clustering with Ward linkage (“hclust” from the “stats” R package). Genes were ordered by hierarchical clustering with Ward linkage across all cells. Histograms were generated by counting the number of cells with the associated number of Tas2r genes present or not present (defined as normalized expression value greater than 0). Correlation values between Tas2r gene pairs were calculated using Spearman’s rank correlation. Statistically significant correlations were established by constructing an empirical cumulative distribution function for all pairwise correlation values for all genes. Pairwise correlation values falling within the high correlation cutoff of 0.05 were determined significantly high by an empirical P value of P < 0.05.
Immunofluorescent staining and imaging
For immunofluorescence, tissues were fixed in 2% paraformaldehyde (Pierce) in PBS for 2 hrs at 4 °C followed by overnight incubation in 30% (w/v) sucrose (Sigma-Aldrich) in PBS. Tissues were embedded in Optimal Cutting Temperature Compound (Tissue-Tek) and stored at −80 °C before sectioning (50–200 μm) on a cryostat (Leica). Thin sections were dried on Superfrost Plus (Fisher Scientific) slides and semi-thick (200 μm) sections were moved directly to 0.3% Triton X-100 (Sigma-Aldrich), 0.2% BSA (Sigma-Aldrich), 0.1% sodium azide (Sigma-Aldrich) in PBS (Immunomix). Slides were stained in a humidified chamber and semi-thick sections were stained in 24-well plates with one section per well. Slides were briefly rehydrated in PBS before permeabilization in Immunomix for 1hr at RT followed blocking with BlockAid (ThermoFisher), primary antibody staining at RT, and, when necessary, secondary antibody staining at RT for 1hr. Semi-thick sections were permeabilized in Immunomix with shaking at RT overnight followed by blocking with BlockAid at RT for 2hr, primary antibody staining at RT for 2hr, and, when necessary, secondary antibody staining at RT for 2hr. Semi-thick sections were then moved to Superfrost Plus slides and all sections were mounted with ProLong Diamond Antifade Mountant (ThermoFisher). Images were acquired on a Leica SP5 (Leica) laser scanning confocal microscope. The following antibodies were used in this study: Dclk1 (Abcam polyclonal ab31704), Krt10 (EP1607IHCY), Krt5 (EP1601Y), Krt8 (EP1628Y), tdTomato (632496). Antibodies were purchased from Abcam or Clontech.
Human thymic tissue
Thymus samples were collected from pediatric patients undergoing corrective cardiothoracic surgery. All experiments were performed in accordance with protocols approved by the UCSF Human Research Protection Program Institutional Review Board and written informed consent was obtained before sample collection.
Immunohistochemistry
Tissue was fixed in 4% paraformaldehyde (ThermoFisher) for 3 hr at 4°C, washed with PBS, embedded in paraffin, and sectioned. Antigen retrieval was performed on rehydrated tissue by boiling sections in antigen retrieval Citra Solution (Biogenex). Sections were blocked for 30 min at RT using CAS-Block (ThermoFisher) with 0.2% Triton X-100 (Sigma-Aldrich), followed by incubation with anti-Dclk1 primary antibody (Abcam, ab31704) overnight at 4°C. Staining with biotinylated secondary antibody was performed for one hour at RT. Slides were developed using ABC kit (Vector labs) and DAB kit (Vector labs) and counterstained with Hematoxylin.
Image processing and quantitative image analysis
The spatial distribution of tuft cells was evaluated using the Spatstat R library. Raw Leica image files of three large scans (3670 × 3670 × 77 μm) were imported into Imaris 8.3.1 (Bitplane). Intensity-based 3D segmentation was then applied to 12 identically sized regions of interest (586 × 272 × 77 μm) using identical thresholding parameters to generate surface coordinates of KRT10 bodies and center of intensity coordinates of tuft cells. These coordinates were flattened to two dimensions (xy) and duplicates were removed. 2D coordinates were imported into R for spatial analysis and the relationship between surfaces and center of intensity coordinates was calculated using R’s multi-type pair correlation function (PCF), pcfcross (spatstat.org). The pair correlation function is defined as g = K′(r)/2πr, where K′(r) is the first derivative of Ripley’s K-function. Because PCF analysis is sensitive to spatial inhomogeneities within a field, the 12 ROIs were selected to avoid inhomogeneities at the field margins.
To measure the range of cluster sizes of the tuft cell aggregates, raw Leica images of fixed thymic slices were analyzed in Bitplane’s Imaris 8.3.1 software package. Intensity-based 3D segmentation was applied to the image voxels and volumes of the tuft cells were measured. Surface volumes < 5 times the mean single cell volume (1×104 μm3) were shown in green and surface volumes > 5 (1×104 μm3) were pseudocolored based on aggregate size.
Single-cell tissue preparation
Mouse thymi were isolated, cleaned of fat and transferred to DMEM (UCSF Cell Culture Facility) containing 2% FBS (Atlanta Biologics) on ice. Single cell suspensions of thymocytes were prepared by mashing through a 40-micron filter (Falcon). For mTEC preparations, thymi were minced with a razor blade. Up to five thymi were pooled into a single digestion. Tissue pieces were moved with a glass Pasteur pipette to 15 ml tubes and vortexed briefly in 10 ml of media. Fragments were allowed to settle before removing the media and replacing it with 4 ml of digestion media containing 2% FBS, 100 μg/ml DNase I (Roche), and 100 μg/ml Liberase TM (Sigma-Aldrich) in DMEM. Tubes were moved to a 37 °C water bath and fragments were triturated through a glass Pasteur pipette at 0 min and 6 min to mechanically aid digestion. At 12 min tubes were spun briefly to pellet undigested fragments and the supernatant was moved to 20 ml of 0.5% BSA (Sigma-Aldrich), 2 mM EDTA (TekNova), in PBS (MACS buffer) on ice to stop the enzymatic digestion. This was repeated twice for a total of three 12 min digestion cycles, or until there were no remaining tissue fragments. The single cell suspension was then pelleted and washed once in MACS Buffer. Density-gradient centrifugation using a three-layer Percoll gradient (GE Healthcare) with specific gravities of 1.115, 1.065, and 1.0 was used to enrich for stromal cells. Cells isolated from the Percoll-light fraction, between the 1.065 and 1.0 layers, were then resuspended in 0.5% BSA (Sigma-Aldrich), 2 mM EDTA (TekNova) (FACS buffer) and counted. For tuft cell sorting, single-cell intestinal epithelial cell suspensions were prepared as previously described 12.
Human thymus was transferred to RPMI (ThermoFisher) and cut into small pieces using scissors. Tissue pieces were mashed gently using the back of a sterile syringe to extract most of the thymocytes. The supernatant was removed and replaced with fresh RPMI. Tissue pieces were moved to a 15 ml tube using a 5 ml pipette. Fragments were allowed to settle before discarding the media and replacing it with 5 ml of digestion media containing 100 μg/ml DNase I (Roche) and 100 μg/ml Liberase TM (Sigma-Aldrich) in RPMI. Tubes were moved to a 37 °C water bath and fragments were triturated through a 5 ml pipette at 0 min and 6 min to mechanically aid digestion. At 12 min tubes were spun briefly to pellet undigested fragments and the supernatant was discarded. Fresh digestion media was added to remaining fragments and the digestion was repeated using a glass Pasteur pipette for trituration. Supernatant from this second round of digestion was also discarded. A third round of enzymatic digestion was performed using 5 ml of digestion media supplemented with Trypsin/EDTA (ThermoFisher) for a final concentration of 0.05%. Remaining thymic fragments were digested for an additional hour with trituration every 15 min. The cells were moved to cold MACS buffer to stop the enzymatic digestion. TECs were enriched and prepared for flow cytometry using the same protocol as murine mTECs with the following modifications: blocking was done with human Fc Receptor Binding Inhibitor Monoclonal Antibody (eBioscience) and human specific antibodies for Epcam, CD45, and HLA-DR were used for surface staining.
Small intestines were flushed with PBS, opened, and rinsed with PBS to remove luminal contents. Two-and-a-half- to five-cm-long segments of jejunum were incubated with rocking for 20 min at 37 °C in 5 ml PBS containing 2.5 mM EDTA (Sigma-Aldrich), 0.75 mM dithiothreitol (DTT; Sigma-Aldrich), and 10 μg ml−1 DNaseI (Sigma-Aldrich). Tissues were shaken vigorously for 30 s and released cells were incubated with rocking for 10 min at 37 °C in 5 ml HBSS (Ca2+/Mg2+ free) containing 1.0 U ml−1 Dispase (Gibco) and 10 μg ml−1 DNaseI. Digested cells were passed through a 70 μm filter and washed once before staining for flow cytometry.
Flow cytometry and antibodies
For surface staining, single-cell suspensions were prepared as described and incubated with Live/Dead Fixable Blue Dead Cell Stain (ThermoFisher) in PBS for 20 min at 4 °C followed by blocking with anti-mouse CD16/CD32 (24G2) (UCSF Hybridoma Core Facility) and 5% normal rat serum for 20 min at 4 °C. Cells were then washed in FACS buffer and stained for surface markers for 30–45 min at 4 °C. For CD1d tetramer staining, thymocytes were incubated with BV421-conjugated PBS-57-loaded CD1d tetramer (NIH Tetramer Core) for 1 hr at room temperature. DCLK intracellular staining of mTECs was performed as described previously 12. For staining of intracellular transcription factors, thymocytes were fixed and permeabilized with FoxP3 staining buffer set (eBioscience) according to manufacturer’s instructions. Flow cytometry data was collected on a LSRII Flow Cytometer (BD Biosciences) housed within the UCSF Single Cell Analysis Center, and analyzed using FlowJo 10.3 software (TreeStar Software). The following antibodies were used in this study: Dclk1 (Abcam polyclonal ab31704), Dclk1 (EPR6085) Ly51 (6C3), CD11c (N418), CD45 (30-F11), Epcam (G8.8), Aire (5H12), I-Ab (25-9-17), I-Ad (39-10-8), TCRβ (H57-597), CD4 (GK1.5), CD8 (53-6.7), FoxP3 (MF-14), CD25 (3C7), PLZF (Mags21F7), T-bet (4B10), RORγ (Q31-378), Eomes (Dan11mag), CD2 (S5.2) hEpcam (HEA-125), hCD45 (HI30), hHLA-DR (L243). Antibodies were purchased from Abcam, BioLegend, BD Biosciences, eBioscience, or Miltenyi.
Quantitative RT–PCR
Single-cell epithelial suspensions were isolated and stained as described above and then sorted using a FACS Aria Fusion (BD Biosciences). Cells were sorted directly into TRIzol LS (ThermoFisher Scientific) and the aqueous phase was isolated using Phasemaker Tubes (ThermoFisher) and RNA was isolated using the Micro Plus RNeasy kit (Qiagen) and reverse transcribed using the SuperScript IV Vilo Master Mix with ezDNase (ThermoFisher). The resulting cDNA was used as template for quantitative PCR with Taqman Gene Expression Assays on a 7500 Fast Real-Time PCR System (Applied Biosystems). Transcripts were normalized to Actb (Mm00607939_s1) expression. Aire (Mm00477461_m1), Dclk1 (Mm00444950_m1), Epcam (Mm00493214_m1), Il25 (Mm00499822_m1) Trpm5 (Mm01129032_m1).
Radioligand binding assay
Full-length mouse IL-25 cDNA (MMM1013-211691449, Dharmacon) was transcribed, in vitro translated, and biosynthetically labeled with 35S-methionine using the TNT Quick Coupled Transcription/Translation System (Promega). Radiolabeled protein was immunoprecipitated with serum samples loaded in triplicate in 96-well PVDF filtration plates (Millipore). Radioactivity retained in the filter was measured using a liquid scintillation counter (1450 MicroBeta Trilux; PerkinElmer). A polyclonal goat anti-mouse IL25 antibody (R&D Systems, af1399) was used as a positive control. IL25 autoantibody indices for samples were calculated as: (cpm of unknown – cpm of negative standard) ÷ (cpm of positive standard – cpm of negative standard) × 100. The limit of detection was defined as the average of autoantibody indices for all wild-type samples plus three standard deviations.
Statistical analysis
All experiments were performed using randomly assigned mice without investigator blinding. No data were excluded. Statistical significance between two groups was calculated using an unpaired, parametric, 2-tailed Student’s t test. Where more than two groups were plotted together, statistical significance was calculated either by using one-way, non-parametic ANOVA (Kruskal-Wallis test) or using two-way non-parametric ANOVA with multiple comparisons. Experimental groups included a minimum of three biological replicates. Intragroup variation was not assessed. All statistical analysis was performed using Prism 7 (GraphPad Software). Figures display means ± standard deviation. A P-value of less than 0.05 was considered statistically significant. No statistical methods were used to predetermine sample size.
Code availability
Code used to align, perform quality control, and analyze single cell RNA-seq data can be found at https://github.com/mTEC-pipelines/tufts-pipelines. Bulk RNA-seq and quantitative image analysis pipelines are described and code is available upon request or through publicly available GitHub repositories.
Data Availability
RNA-seq data that support the findings of this study have been deposited in the GEO database. Source data for figures 1e, 2c, 3e,f,h, 4c–f and extended data figures 5d,f–i, 9b–d, and 10b–e,g are provided with the paper. All other data that support the findings of this study are available from the corresponding author upon reasonable request.
Extended Data
Extended Data Figure 1. RNA sequencing of FACS sorted iALT mTEC subsets.
a, Heatmap of Aire and representative Aire-dependent TSAs in pre- early- late- and post-Aire populations as defined in Fig. 1a. b, Heatmap of differentially expressed genes with a FDR < 0.01 and |FC| > 8. Columns are organized by unsupervised hierarchical clustering (union of all comparisons) with a dendrogram representing similarity between clustered columns. Note that the early-, and late- Aire-expressing populations are grouped, as expected.
Extended Data Figure 2. Medullary localization of DCLK1bright cells and KRT10 bodies.
Representative confocal maximum projections (25 μm) of IF staining of thymic slices at low magnification. a, Left, KRT5 (red) and KRT10 (green) and right, KRT5 (red) and DCLK1 (green) showing medullary localization of KRT10 and DCLK1 signal. b, Left, KRT5 (red) and DCKL1 (green) and right, DCLK1 alone. Region was selected for presence of multicellular DCLK1bright cell clumps as indicated by white arrows. Scale bars, 100 μm. n = 3 mice; images are representative of 3 independent experiments.
Extended Data Figure 3. Non-random distribution of medullary DCLK1bright cells.
a, Stitched confocal maximum projection (77μm) of IF staining of semi-thick (200μm) C57BL/6 thymic slice at low magnification. KRT10 (red) and DCLK1 (green). Field, 3670 × 3670 μm. Small rectangles indicate volumes selected for quantitative image analysis from this slice. b, Expanded area from (a) indicated in lower left corner with KRT10 signal converted into surfaces and DLCK1 signal converted to center of intensity coordinates. Scale bar, 100 μm. c, Pair correlation function analysis (PCF) of 12 identically sized regions of interest (586 × 272 × 77μm) from three different stitched thymic slices (n = 3 thymic slices). Results are presented as a histogram for a range of distances from KRT10 surfaces and are interpreted as follows: g = 1 indicates a spatial distribution that follows a random Poisson distribution, illustrated by a dashed line and gray envelope; g < 1 indicates regularity in the distribution; g > 1 indicates clustering. d, Schematic representation of the PCF analysis. The PCF counts the number of objects from a surface at a radial distance (r) and compares this number to the expected number of events for a random Poisson distributed population at this distance.
Extended Data Figure 4. Human thymus contains medullary DCLK1bright cells.
a, Representative immunohistochemistry of neonatal (21d) human thymus stained for DCLK1 or isotype control. Arrows point to individual DCLK1bright cells or cluster. HC, Hassall’s Corpuscle. Scale bars, 25 μm. b, Flow plot from enzymatically digested prenatal human thymus (22.3 gestational weeks) gated on CD45− EPCAM+ TECs showing intracellular DCLK1 or isotype control. Note that human DCLK1+ events are approximately 3.5% of prenatal TECs. Data are representative of 2 independent experiments.
Extended Data Figure 5. Characterization of thymic tuft cells.
a, DCLK1 and RFP (IL25) in C57BL/6 control and Flare25 thymus. Confocal maximal projection. Scale, 5 μm. n = 3 mice, 2 independent experiments. b, RFP (IL25) in C57BL/6 control and Flare25 mTECs (CD11c− CD45− EPCAM+). n = 5 mice; 3 independent experiments. c, Gating strategy for FACS sorting of CD11c− CD45− Epcam+ Ly51− mTECs from Flare25 reporter mice for qPCR analysis of mTEChi (RFP− MHCIIhi), mTEClo (RFP+ MHCIIlo), and thymic tuft (RFP+) populations. d, qPCR analysis of expression of indicated genes of interest on populations sorted in (c) normalized to mTEChi (mean +/− SD). n = 3 mice. Two-way non-parametric ANOVA with multiple comparisons. e, Representative confocal maximum projection (10 μm) stained for KRT8/KRT18 (red) and DCLK1 (green). Scale bars, 50 μm. n = 3 mice, 2 independent experiments. f–i, Expression levels (normalized reads from Fig. 2b) from bulk RNA sequencing of SI (n = 3 mice) and thymic tuft (n = 4 mice) cells. f, Major MHCI genes and B2m. FDR > 0.1. g, Major MHCII genes and CD74 in SI tuft cells. h, Minor MHCII genes in thymic tuft cells. i, Tas2r family members in thymic tuft cells. g–i, Mean +/− SD. g, i, Red line corresponds to a cutoff of 5 reads/million; * mean and SD fall above this cutoff.
Extended Data Figure 6. Tas2r expression in single thymic tuft cells is not stochastic.
a, Correlation plot of Tas2r genes in single Flare25 tuft cells as analyzed in Fig. 2f. Color and circle size represent pairwise correlation value. b, Empirical Cumulative Distribution Function plot of pairwise gene expression correlation of single Flare25 tuft cells. Red points represent Tas2r genes that were significantly highly correlated compared to the background gene set (P < 0.05). c, List of correlated Tas2r gene pairs from (b) and their corresponding empirical P values.
Extended Data Figure 7. Analysis of Tas2r expression in single Flare25 and Flare25Aire−/− thymic tuft cells.
a, Intracellular DCLK1 in C57BL/6 control and Aire−/− mTECs (CD11c− CD45− EPCAM+). n = 5 mice; 3 independent experiments. b, Histogram showing the number of Tas2r family members expressed per individual thymic tuft cell. Note that the distribution is similar between wild type and Aire−/− cells. c, Correlation plot of Tas2r genes in single Flare25.Aire−/− tuft cells as analyzed in Fig. 3c. Color and circle size represent pairwise correlation value. d, Empirical Cumulative Distribution Function plot of pairwise gene expression correlation of single Flare25.Aire−/− tuft cells. Red points represent Tas2r genes that were significantly highly correlated compared to the background gene set (P < 0.05). e, List of correlated Tas2r gene pairs from (d) and their corresponding empirical P values. f, Representative confocal maximum projections (25 μm) of IF analysis of C57BL/6 and Aire−/− thymi stained for KRT5 (red) and KRT10 (green). Scale bars, 100 μm. n = 3 mice; 2 independent experiments. f, Analysis of DCLK1+ cells in Hipk2fl/fl controls or FoxN1-Cre.Hipk2fl/fl (mTEC Hipk2−/−) thymus gated on CD45− CDR1− EPCAM+ mTECs as quantified in Fig. 3h. n = 6 mice; 3 independent experiments.
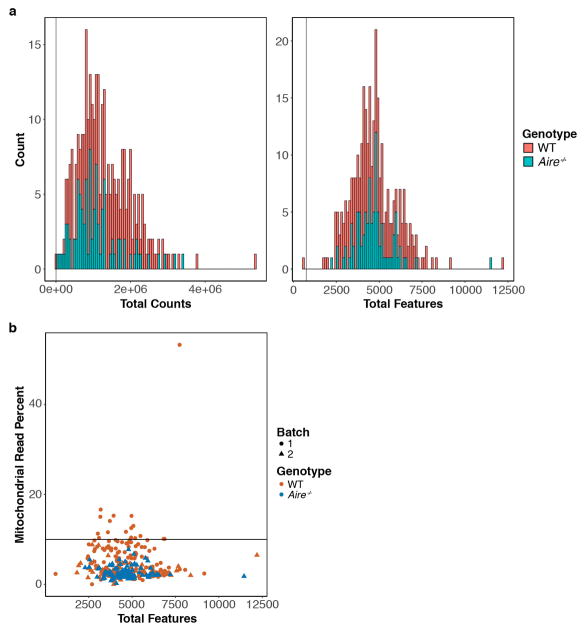
Extended Data Figure 8. Single cell RNA sequencing data quality and inclusion criteria.
a, Histograms of total read counts (left) or features (right) for each single cell. Red represents Flare25 thymic tuft cells and blue represents Flare25.Aire−/− thymic tuft cells. Cells with fewer than 100,000 reads or 750 detected features were discarded from further analysis. b, Scatter plot of total features vs mitochondrial read percent. Red represents Flare25 thymic tuft cells and blue represents Flare25.Aire−/− thymic tuft cells. Triangles and circles denote cells from two separate sorts. Cells with more than 10 percent of their reads mapping to mitochondrial genes were discarded from further analysis as indicated by the black line.
Extended Data Figure 9. DT ablation of thymic tuft cells in Balb/cByJ.KN2 x C57BL/6.Aire-DTR F1 mice disrupts the medullary NKT2-IL4 axis.
a–d, Analysis of thymus from Balb/cByJ.KN2 x C57BL/6.Aire-DTR F1 mice or Aire-DTR− F1 controls treated for 9 days with DT. a, IF staining of thin thymic sections for KRT10 (red) and DCLK1 (green). n = 3 mice; 2 independent experiments. b, Counts of CD11c− CD45− EPCAM+ mTECs and DCLK1+ tuft cells in non-Tg controls (n = 9 mice) or F1 thymus (n = 12 mice). c, Flow plots gated on TCRβint CD1d+ iNKTs showing intracellular PLZF and RORγt staining for iNKT subset analysis. Right, counts of NKT1 (PLZF−RORγt−), NKT2 (PLZF+RORγt−), and NKT17 (PLZF−RORγt+) in non-Tg controls (n = 35 mice) or F1 thymus (n = 23 mice). d, Flow plots gated on TCRβ+ CD8+ SP thymocytes showing intracellular EOMES. Right, counts of EOMES+ cells in non-Tg controls (n = 20 mice) or F1 thymus (n = 18 mice). b–d, Mean +/− SD. Unpaired, parametric, 2-tailed Student’s t test. Pooled from 3 independent experiments.
Extended Data Figure 10. Characterization of Pou2f3−/− mice.
a, Representative on-edge, full-face mid-thymic sections (5μm) stained with hematoxylin and eosin showing grossly normal thymic architecture in Pou2f3−/− mice. n = 3 mice; 2 independent experiments. b, Flow plots (left) and frequencies (right) of mTEC subsets from C57BL/6J and Pou2f3−/− mice. n = 5 mice per genotype; 3 independent experiments. c, Flow plots (left) and counts (right) of thymocyte subsets from C57BL/6J and Pou2f3−/− mice. n = 5 mice per genotype; 3 independent experiments. d, Flow plots (left) of TCRβint CD1d+ thymic iNKTs in B6 (n = 26 mice), Pou2f3−/− (n = 19 mice), or Trpm5−/− (n = 10 mice). e, Gating strategy of iNKT subset analysis (left) and counts (right) of NKT1 (PLZF−RORγt−) and NKT17 (PLZF−RORγt+) in B6 (n = 15 mice), Pou2f3−/− (n = 19 mice), or Trpm5−/− (n = 10 mice). f, Flow plots gated on TCRβ+ CD8+ SP thymocytes showing intracellular EOMES. Quantified in Fig. 4d. g, Flow plots gated on splenic TCRβint CD1d+ iNKTs showing intracellular PLZF and RORγt staining for iNKT subset analysis, NKT1 (PLZF−RORγt−), NKT2 (PLZF+RORγt−), and NKT17 (PLZF−RORγt+). Right, counts of NKT1 and NKT17 in B6 (n = 5 mice) or Pou2f3−/− (n = 4 mice). 2 independent experiments. b–e, g, Mean +/− SD. b, c, g, Unpaired, parametric, 2-tailed Student’s t test. d, e, One-way, non-parametic ANOVA (Kruskal-Wallis test). Pooled from 3 independent experiments.
Supplementary Material
Acknowledgments
We thank A. Chan, M. Waterfield, L. Velten, and the Anderson, Locksley, and Steinmetz laboratories for helpful discussions; K. Wu, Y. Wang, and E. Li for experimental support. Tetramers were from the NIH Tetramer Core Facility. Pou2f3−/− mice were from the DTCC-KOMP2 Consortium from The Canadian Mouse Mutant Repository. Biostatistics support was provided by the UCSF Functional Genomics Core. This work was supported by NIH grant R01 AI097457 (C.N.M, I.P. I.S.K, T.C.M., M.S.A.); Larry Hillblom Foundation 2017-D-012-FEL (I.P.); NIH Medical Scientist Training Program grant T32 GM007618 to UCSF (I.S.K.); NSF GRFP DGE 1656518 (K.L.W.); NSF GRFP DGE 1656518 (A.R.R.); NIH grant R37 AI039560 (H.W., K.A.H.); Damon Runyon Cancer Research Foundation DRG-2162-13 (J.v.M.); Howard Hughes Medical Institute (J.v.M., R.M.L.); Sandler Asthma Basic Research Center (A.C.F. J.v.M., R.M.L.); German Cancer Research Center (K.R.); European Research Council grant ERC-2012-AdG (B.K.); NIH grant UO1 DK107383 (A.V.P., M.S.A.); NIH grant P01 HG00020527 (L.M.S.). NIH grant R01 AI026918 (R.M.L.); NIH Diabetes Research Center grant P30 DK063720 (A.C.F., M.S.A., Single Cell Analysis Center); NIH Shared Instrument Grant 1S10OD021822-01 (Single Cell Analysis Center).
Footnotes
Author Contributions:
C.N.M conceived the study, designed and performed experiments, analyzed data. I.P. conceived and designed experiments with C.N.M., performed thymocyte flow cytometry, and analyzed data. J.v.M. designed and performed bulk tuft RNA-seq, provided Flare25 and Trpm5−/− animals, and analyzed data with R.M.L. K.L.W. and A.R.R. designed and performed single cell RNA-seq and analyzed data with L.M.S. H.W. designed and performed F1 experiments and analyzed data with K.A.H. K.R. designed and performed Hipk2 flow cytometry and analyzed data with B.K. I.S.K. and T.C.M. designed and performed mTEC iALT RNA-seq. J.L.P. designed and performed biostatistical analysis of RNA-seq data and analyzed data with D.J.E. A.C.F. designed and performed quantitative immunofluorescent image analysis. A.V.P. designed and performed human mTEC experiments. E.J.W. designed and performed immunofluorescence experiments and analyzed data. W.W.L. performed RLBA experiments. M.S.A directed the study and wrote the manuscript with C.N.M and I.P.
The authors declare no competing interests.
References
- 1.Kyewski B, Klein L. A CENTRAL ROLE FOR CENTRAL TOLERANCE. Annual Review of Immunology. 2006;24:571–606. doi: 10.1146/annurev.immunol.23.021704.115601. [DOI] [PubMed] [Google Scholar]
- 2.Takahama Y, Ohigashi I, Baik S, Anderson G. Generation of diversity in thymic epithelial cells. Nat Rev Immunol. 2017 doi: 10.1038/nri.2017.12. [DOI] [PubMed] [Google Scholar]
- 3.Gerbe F, Jay P. Intestinal tuft cells: epithelial sentinels linking luminal cues to the immune system. Mucosal Immunol. 2016;9:1353–1359. doi: 10.1038/mi.2016.68. [DOI] [PubMed] [Google Scholar]
- 4.Metzger TC, et al. Lineage tracing and cell ablation identify a post-Aire-expressing thymic epithelial cell population. Cell Rep. 2013;5:166–179. doi: 10.1016/j.celrep.2013.08.038. [DOI] [PMC free article] [PubMed] [Google Scholar]
- 5.Eckhart L, Lippens S, Tschachler E, Declercq W. Cell death by cornification. Biochimica et Biophysica Acta (BBA) - Molecular Cell Research. 2013;1833:3471–3480. doi: 10.1016/j.bbamcr.2013.06.010. [DOI] [PubMed] [Google Scholar]
- 6.Derbinski J, et al. Promiscuous gene expression in thymic epithelial cells is regulated at multiple levels. J Exp Med. 2005;202:33–45. doi: 10.1084/jem.20050471. [DOI] [PMC free article] [PubMed] [Google Scholar]
- 7.White AJ, et al. Lymphotoxin Signals from Positively Selected Thymocytes Regulate the Terminal Differentiation of Medullary Thymic Epithelial Cells. The Journal of Immunology. 2010;185:4769–4776. doi: 10.4049/jimmunol.1002151. [DOI] [PMC free article] [PubMed] [Google Scholar]
- 8.Odaka C, et al. TGF-β type II receptor expression in thymic epithelial cells inhibits the development of Hassall’s corpuscles in mice. International Immunology. 2013;25:633–642. doi: 10.1093/intimm/dxt026. [DOI] [PMC free article] [PubMed] [Google Scholar]
- 9.Hassall AH. The Microscopic Anatomy of the Human Body in Health Disease, Illustrated with numerous Drawings in Colour. Provincial Medical and Surgical Journal. 1849 [Google Scholar]
- 10.Farr AG, Dooley JL, Erickson M. Organization of thymic medullary epithelial heterogeneity: implications for mechanisms of epithelial differentiation. Immunol Rev. 2002;189:20–27. doi: 10.1034/j.1600-065x.2002.18903.x. [DOI] [PubMed] [Google Scholar]
- 11.Gerbe F, Legraverend C, Jay P. The intestinal epithelium tuft cells: specification and function. Cell Mol Life Sci. 2012;69:2907–2917. doi: 10.1007/s00018-012-0984-7. [DOI] [PMC free article] [PubMed] [Google Scholar]
- 12.von Moltke J, Ji M, Liang H-E, Locksley RM. Tuft-cell-derived IL-25 regulates an intestinal ILC2–epithelial response circuit. Nature. 2016;529:221–225. doi: 10.1038/nature16161. [DOI] [PMC free article] [PubMed] [Google Scholar]
- 13.Howitt MR, et al. Tuft cells, taste-chemosensory cells, orchestrate parasite type 2 immunity in the gut. Science. 2016;351:1329–1333. doi: 10.1126/science.aaf1648. [DOI] [PMC free article] [PubMed] [Google Scholar]
- 14.Gerbe F, et al. Intestinal epithelial tuft cells initiate type 2 mucosal immunity to helminth parasites. Nature. 2016;529:226–230. doi: 10.1038/nature16527. http://www.nature.com/nature/journal/v529/n7585/abs/nature16527.html#supplementary-information. [DOI] [PMC free article] [PubMed] [Google Scholar]
- 15.Hoover B, et al. The intestinal tuft cell nanostructure in 3D. Sci Rep. 2017;7:1652. doi: 10.1038/s41598-017-01520-x. [DOI] [PMC free article] [PubMed] [Google Scholar]
- 16.Krasteva G, et al. Cholinergic chemosensory cells in the trachea regulate breathing. Proc Natl Acad Sci U S A. 2011;108:9478–9483. doi: 10.1073/pnas.1019418108. [DOI] [PMC free article] [PubMed] [Google Scholar]
- 17.Deckmann K, et al. Bitter triggers acetylcholine release from polymodal urethral chemosensory cells and bladder reflexes. Proc Natl Acad Sci U S A. 2014;111:8287–8292. doi: 10.1073/pnas.1402436111. [DOI] [PMC free article] [PubMed] [Google Scholar]
- 18.Panneck AR, et al. Cholinergic epithelial cell with chemosensory traits in murine thymic medulla. Cell Tissue Res. 2014;358:737–748. doi: 10.1007/s00441-014-2002-x. [DOI] [PMC free article] [PubMed] [Google Scholar]
- 19.Soultanova A, et al. Cholinergic chemosensory cells of the thymic medulla express the bitter receptor Tas2r131. Int Immunopharmacol. 2015;29:143–147. doi: 10.1016/j.intimp.2015.06.005. [DOI] [PubMed] [Google Scholar]
- 20.Bezencon C, et al. Murine intestinal cells expressing Trpm5 are mostly brush cells and express markers of neuronal and inflammatory cells. J Comp Neurol. 2008;509:514–525. doi: 10.1002/cne.21768. [DOI] [PubMed] [Google Scholar]
- 21.Wong GT, Gannon KS, Margolskee RF. Transduction of bitter and sweet taste by gustducin. Nature. 1996;381:796–800. doi: 10.1038/381796a0. [DOI] [PubMed] [Google Scholar]
- 22.Zhang Y, et al. Coding of Sweet, Bitter, and Umami Tastes. Cell. 2003;112:293–301. doi: 10.1016/S0092-8674(03)00071-0. [DOI] [PubMed] [Google Scholar]
- 23.Yano M, et al. Aire controls the differentiation program of thymic epithelial cells in the medulla for the establishment of self-tolerance. J Exp Med. 2008;205:2827–2838. doi: 10.1084/jem.20080046. [DOI] [PMC free article] [PubMed] [Google Scholar]
- 24.Rattay K, et al. Homeodomain-Interacting Protein Kinase 2, a Novel Autoimmune Regulator Interaction Partner, Modulates Promiscuous Gene Expression in Medullary Thymic Epithelial Cells. The Journal of Immunology. 2015;194:921–928. doi: 10.4049/jimmunol.1402694. [DOI] [PubMed] [Google Scholar]
- 25.Lee YJ, et al. Tissue-Specific Distribution of iNKT Cells Impacts Their Cytokine Response. Immunity. 2015;43:566–578. doi: 10.1016/j.immuni.2015.06.025. [DOI] [PMC free article] [PubMed] [Google Scholar]
- 26.Lee YJ, Holzapfel KL, Zhu J, Jameson SC, Hogquist KA. Steady-state production of IL-4 modulates immunity in mouse strains and is determined by lineage diversity of iNKT cells. Nat Immunol. 2013;14:1146–1154. doi: 10.1038/ni.2731. [DOI] [PMC free article] [PubMed] [Google Scholar]
- 27.Matsumoto I, Ohmoto M, Narukawa M, Yoshihara Y, Abe K. Skn-1a (Pou2f3) specifies taste receptor cell lineage. Nat Neurosci. 2011;14:685–687. doi: 10.1038/nn.2820. doi: http://www.nature.com/neuro/journal/v14/n6/abs/nn.2820.html#supplementary-information. [DOI] [PMC free article] [PubMed] [Google Scholar]
- 28.Anderson MS, et al. Projection of an immunological self shadow within the thymus by the aire protein. Science. 2002;298:1395–1401. doi: 10.1126/science.1075958. [DOI] [PubMed] [Google Scholar]
- 29.Damak S, et al. Trpm5 null mice respond to bitter, sweet, and umami compounds. Chem Senses. 2006;31:253–264. doi: 10.1093/chemse/bjj027. [DOI] [PubMed] [Google Scholar]
- 30.Gordon J, et al. Specific expression of lacZ and cre recombinase in fetal thymic epithelial cells by multiplex gene targeting at the Foxn1 locus. BMC Dev Biol. 2007;7:69. doi: 10.1186/1471-213X-7-69. [DOI] [PMC free article] [PubMed] [Google Scholar]
- 31.Madisen L, et al. A robust and high-throughput Cre reporting and characterization system for the whole mouse brain. Nat Neurosci. 2010;13:133–140. doi: 10.1038/nn.2467. [DOI] [PMC free article] [PubMed] [Google Scholar]
- 32.Picelli S, et al. Full-length RNA-seq from single cells using Smart-seq2. Nat Protoc. 2014;9:171–181. doi: 10.1038/nprot.2014.006. [DOI] [PubMed] [Google Scholar]
- 33.Dobin A, et al. STAR: ultrafast universal RNA-seq aligner. Bioinformatics. 2013;29:15–21. doi: 10.1093/bioinformatics/bts635. [DOI] [PMC free article] [PubMed] [Google Scholar]
- 34.Liao Y, Smyth GK, Shi W. featureCounts: an efficient general purpose program for assigning sequence reads to genomic features. Bioinformatics. 2014;30:923–930. doi: 10.1093/bioinformatics/btt656. [DOI] [PubMed] [Google Scholar]
- 35.Velten L, et al. Human haematopoietic stem cell lineage commitment is a continuous process. Nat Cell Biol. 2017;19:271–281. doi: 10.1038/ncb3493. [DOI] [PMC free article] [PubMed] [Google Scholar]
- 36.Kharchenko PV, Silberstein L, Scadden DT. Bayesian approach to single-cell differential expression analysis. Nat Methods. 2014;11:740–742. doi: 10.1038/nmeth.2967. [DOI] [PMC free article] [PubMed] [Google Scholar]
Associated Data
This section collects any data citations, data availability statements, or supplementary materials included in this article.
Supplementary Materials
Data Availability Statement
RNA-seq data that support the findings of this study have been deposited in the GEO database. Source data for figures 1e, 2c, 3e,f,h, 4c–f and extended data figures 5d,f–i, 9b–d, and 10b–e,g are provided with the paper. All other data that support the findings of this study are available from the corresponding author upon reasonable request.


