

Abstract
Aims and Objectives:
Metabolic syndrome (MetS) is fairly common in India. International Diabetes Federation (IDF) has defined it as the presence of central obesity with region/ethnicity-specific waist circumference as a mandatory defining criterion along with the presence of two other features from dysglycemia, systolic and/or diastolic hypertension, hypertriglyceridemia, and low high-density lipoprotein. Although obesity is not prevalent in rural parts of India, especially among the underprivileged population, other individual components of the syndrome are not infrequent among these lean/nonobese persons. In this study, we evaluated the prevalence of MetS in rural West Bengal. We also examined that if those persons above the recommended cutoff for waist are excluded, and thus only lean/nonobese persons are included, and the same definition of MetS (herein termed as lean MetS) is applied (three out of four criteria), what will be the prevalence of MetS and will it be lower in the nontribal population compared to the tribal population?
Materials and Methods:
A population-based study was done in the rural area of West Bengal comprising 200 peoples from scheduled tribe (ST) population and 205 people from the neighborhood community from non-ST population to compare the metabolic health with respect to anthropologic and biochemical parameters.
Results:
The prevalence of MetS from rural areas of West Bengal was found to be 21.48% as per IDF criterion, but applying NCEP ATP III criteria, the overall prevalence of MetS rose to 31.1%. The prevalence of normal waist/lean MetS was 12.8%, and there was no significant difference between nontribals versus tribal cohort (14.6% of the nontribes versus 11.6% of the tribal cohort, P = 0.436).
Conclusion:
A significant number of persons with nonobese/lean MetS exist in the rural area. We suggest that if region-specific waist criteria are not satisfied, the diagnosis should still be sorted by NCEP ATP III criteria.
Keywords: International Diabetes Federation criteria, metabolic syndrome, NCEP ATP III, rural India
INTRODUCTION
The prevalence of metabolic syndrome (MetS) in Asian Indians varies according to the region, the extent of urbanization, lifestyle patterns, and socioeconomic/cultural factors.[1,2,3] Recent data also show that about one-third of the urban population in large cities in India have MetS.[4,5] Central obesity remains one of the major constituents of such definition of MetS. Although International Diabetes Federation (IDF) guideline[6] has regarded it as the defining criteria, subsequent consensus by IDF along with American Heart Association and National Heart Lung and Blood Institute (AHA and NHLBI) has recommended to include central obesity as just one of the criteria and also recommended to incorporate ethnicity-specific waist circumference (separately for males and females). As such, the waist circumference cutoff for Asian-Indian population is ≥90 cm for males and ≥80 cm for females.[7,8] Thus, any three of the following lead to a diagnosis of MetS:[9] (i) elevated waist circumference (population- and country-specific definitions), (ii) triglycerides ≥150 mg/dL, (iii) high-density lipoprotein (HDL) cholesterol <40 mg/dL in men and <50 mg/dL in women, (iv) BP ≥130/85 mmHg or greater and (v) fasting blood glucose ≥100 mg/dL.
Obesity is now considered as a major risk factors for many of the metabolic disorders. Increased prevalence of obesity is mostly seen in urbanized area throughout the globe and is primarily related to the combined effect of affluence-related increased intake of high-calorie foods, lack of exercise, increased intake of alcohol, psychological stress including depression and so on. Furthermore, this is the most important constituent of MetS; it is primarily related to environmental factors rather than to genetic factors. Again, the population in the underprivileged area is also not commonly obese because of poor socioeconomic status. They also do significant exercise through their daily activities. In this study, we wanted to examine the prevalence of MetS in rural West Bengal and whether it is different between tribal population and nontribal population? The primary objective of this study was also to examine that if the major environmental factor is excluded and the same definition of MetS applied (three out of four criteria) what will be the prevalence of MetS and will it be lower in the nontribal population?
MATERIALS AND METHODS
A population-based observational study was undertaken to compare the metabolic health (anthropologic and biochemical) between scheduled tribe (ST) population (Article 366 (25) and Article 342 of Constitution of India) and non-ST population in underdeveloped rural areas in the District of Birbhum, West Bengal, India. The results presented herein are part of the data collected in the aforementioned study.
Clearance from the Institutional Ethics Committee of Institute of Post Graduate Medical Education and Research, Kolkata 20, was obtained. The study was sponsored by the Department of Science and Technology of Government of West Bengal, India, after stringent scrutiny of the proposal by a panel of scientists adopted by the department.
We selected areas with high concentration of ST population around Santiniketan and Sriniketan areas affiliated to Rural Extension Centre, PSV Visva-Bharati, and continued consecutive sampling till 205 samples were collected from ST population although about 200 samples were targeted initially.
A sample of 200 consecutive population from the same or neighborhood areas not belonging to ST population was also selected. Thus, 405 individuals including all ethnicity/caste were included in the study to make an appropriate representation of rural West Bengal. The sample size was chosen on the basis of available resources.
Awareness among the selected area was done by doing sensitization camp at every 2–3 months. This was done with the help of Rural Extension Centre, Viswa-Bharati. Several camps were held in early morning within 2 weeks of each sensitization camp. The persons were explained about the study. Individuals were included in the study only if they agreed to give informed written consent and did not have any definite documented chronic infective or inflammatory illness.
Anthropometric data including height, weight, waist circumference, and hip circumference were measured by trained personnel obeying the standard procedure of measurement as described below. Blood pressure was measured using standard methods in “right arm sitting posture” by an aneroid manometer, and body mass index (BMI) was calculated. History of addiction, including tobacco and alcohol, was documented.
Height (to ± 0.1 cm) was measured in all included patients at baseline using a wall-mounted stadiometer. The participant stands straight, with feet placed together and flat on the ground, heels, buttocks, and scapulae against the vertical backboard, and arms loose and relaxed with the palms facing medially. His head would be carefully positioned in the Frankfurt plane, with the lower margins of the orbit in the same horizontal plane as the upper margin of the external auditory meatus.
Body weight (to ± 0.1 kg) was measured using an electronic calibrated scale (BMI was calculated as weight in kilograms divided by the square of height in meters (kg/m2). Waist circumference and hip circumference were measured in all patients and waist–hip ratio (WHR) calculated as a measure of truncal obesity. Waist circumference was measured at the end of a gentle expiration midway between the lower rib margin and iliac crest, with the patient standing with feet 23–30 cm apart. Hip circumference was measured at the level of maximum extension of the buttocks, at the same level all around the body with feet together.
Blood samples were collected for biochemical tests in fasting state in camps to which individuals came in the early morning hours. Samples drawn were allowed to clot and serum was separated by centrifuging on site and samples were immediately sent for biochemical examination at a NABL accredited laboratory of West Bengal (appropriately transported on dry ice). About 10 ml of blood was collected for obtaining serum levels of fasting blood sugar (FBS), glycated hemoglobin (HbA1c), fasting serum insulin, creatinine, lipid profile, uric acid, alanine transaminase (ALT), aspartate transaminase (AST), and alkaline phosphatase. The samples were analyzed using standard laboratory procedure. Capillary blood sugar was also checked by a standard glucometer.
Diabetes was defined as per the standard diagnostic criteria satisfying either FBS or HbA1c. The presence of MetS was ascertained using the consensus criteria by IDF criteria along with AHA and NHLBI.
All analyses were conducted using SAS 9.4 (SAS Institute). Continuous data are presented as the mean ± standard deviation (SD) (if normally distributed) or median (interquartile range) (if skewed), and categorical variables are presented as proportions.
RESULTS
Four hundred and five individuals were included in the study, of whom 205 persons (50.62%) were from ST population in extremely rural areas and 200 persons (49.38%) were from the nontribal population from rural/semiurban areas. Of those 405 persons, 232 were females (57.28%) and 173 were males (42.72%) (range was 18–68 years). The mean (±SD) age was 38.53 years ± 11.74 years.
Table 1 shows the comparison of different anthropological and biochemical parameters which were distributed normally. Of note, BMI, waist circumference, and WHR were found to be significantly lower in the ST population. Both the systolic and diastolic blood pressures were significantly lower in the ST population [Table 1]. Glycemic parameters such as fasting venous plasma glucose, capillary blood glucose, and HbA1c were also significantly lower in STs. LDL and triglyceride levels were significantly lower in STs, but HDL was not significantly different between the groups.
Table 1.
Baseline data (normally distributed)
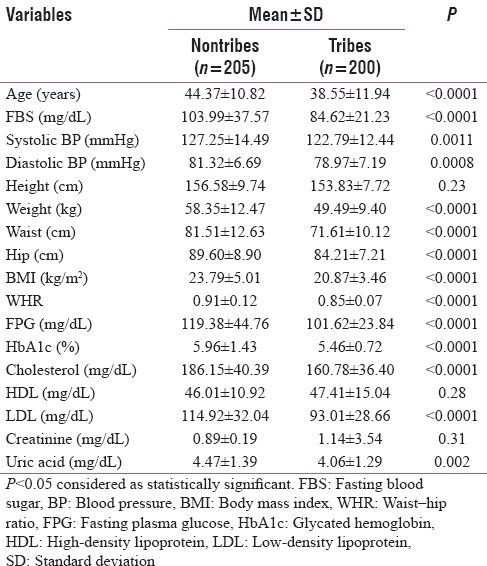
Table 2 shows the comparison of different biochemical parameters which were not distributed normally. Liver enzymes (ALT and AST) levels were significantly higher in the tribal population. However, serum insulin, triglyceride, and ALP levels were significantly lower in the tribal population.
Table 2.
Baseline data (not normally distributed)

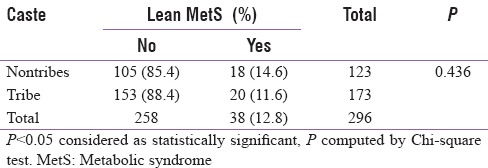
Overall, the prevalence of MetS as per IDF criterion was 21.48%. However, 35% of the nontribes qualified for MetS as per IDF criterion as compared to only 8.3% of the tribal cohort, P < 0.0001 [Table 3]. Going by NCEP ATP III, the overall prevalence of MetS was 31.1%, with 44.5% of the nontribes qualifying for MetS compared to only 18.1% of the tribal cohort, P < 0.0001 [Table 4]. The prevalence of normal waist/lean MetS in general was 12.8% and it was 14.6% of the nontribes compared to only 11.6% of the tribal cohort (p = NS) [Table 5]. This was analyzed after excluding those with a waist circumference more than or equal to 90 cm in males and more than or equal to 80 cm for females. After subgroup analysis of both the genders, there was no statistical difference in lean MetS between nontribal and tribal cohort (16.4% in nontribal males vs. 6.9% in tribal males, P = 0.08; 12.9% of the nontribal females vs. 14.9% of the tribal females, P = 0.729, NS).
Table 3.
Prevalence of metabolic syndrome (as per International Diabetic Federation criterion)
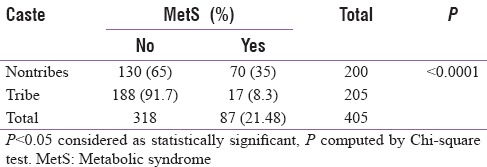
Table 4.
Prevalence of metabolic syndrome (as per National Cholesterol Education Program-Adult Treatment Panel III criteria)
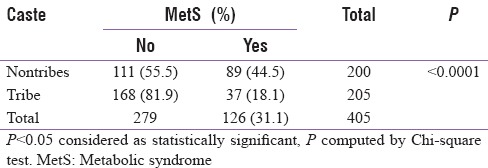
Table 5.
Prevalence of lean metabolic syndrome
DISCUSSION
Although MetS is defined in many different ways by different international bodies, the component criteria are similar. The primary objective for bringing these abnormal anthropologic and biochemical parameters under the umbrella of a single syndrome is primarily two-fold. First, people with this syndrome are strongly predisposed to type 2 diabetes (if they have not yet developed diabetes) and coronary artery disease (CAD), and second, they all are believed to stem from a same or similar genetic aberration related to insulin resistance.
IDF makes central obesity as increased waist circumference mandatory for such definition with recommendation for region-specific waist circumference cutoff, which is more than or equal to 90 cm for Asian males and more than or equal to 80 cm for Asian females. However, NCEP ATP III guidelines recommend defining the syndrome in a simpler way, with any three or more from the criteria mentioned above. Although IDF recommendation should be more applicable in countries such as India (NCEP ATP III guidelines appear to be more applicable for US population), there are several caveats for such assumption. In India, significant proportions of persons with diabetes are lean. At the same time, lean nonalcoholic fatty liver[10] (NAFL) is now a recognized entity, especially in rural areas and NAFL is a known risk factor for diabetes and its complication.[11,12] Thus, if a lean person with the presence of all criteria for MetS will be having a high risk for developing diabetes or CAD, yet will not be categorized as MetS by IDF criteria, thereby demeaning the importance of MetS as a risk factor. This problem is overcome by NCEP ATP III criteria. However individually, all criteria have been proved to be an independent risk factor for diabetes or CAD.
In the present study, the overall waist circumference was 76.53 ± 12.45 cm. There was a significant difference between nontribal population (81.51 ± 12.63 cm) and in tribal population (71.61 ± 10.12 cm) (P < 0.0001). Sex-specific waist circumference for the nontribal population was 86.38 ± 11.13 cm for males and 77.52 ± 11.60 cm for females. The same for the tribal population was 74.51 ± 12.11 cm for males and 69.71 ± 9.98 cm for females.
The overall WHR was 0.87 ± 0.10. There was significant difference between nontribal population (0.91 ± 0.12) and tribal population (0.85 ± 0.07) (P < 0.0001). Sex-specific WHR for nontribal population was 0.93 ± 0.16 for males and 0.88 ± 0.13 for females. The same for tribal population was 0.86 ± 0.09 cm for males and 0.83 ± 0.08 cm for females.
The overall weight was 53.79 ± 11.81 kg. Statistically significant difference was found between nontribal population (58.35 ± 12.47 kg) and tribal population (49.49 ± 9.40 kg) (P < 0.0001). Overall, BMI in the population was 22.32 ± 4.53 kg/m2. Here also, significant difference was found between nontribal population (23.79 ± 5.01 kg/m2) and tribal population (20.87 ± 3.46 kg/m2) (P < 0.0001).
Very little data on the prevalence of MetS in India are available. A recent survey in Central India observed an overall MetS prevalence as per ATP III criteria to be 5.0% in the adult rural population.[13] The prevalence of MetS in the semiurban area was found to be at an intermediate level between the rural and the urban prevalence levels. A recent population survey conducted in a semiurban area in South India showed that the prevalence of MetS is 29.7% (26.5% in men and 31.2% in women).[14] A recent community-based study from eastern India has measured a prevalence of MetS of 31.4%, with females having a much higher prevalence (48.2%) than males (16.3%).[15]
In this study, applying IDF criteria, we found MetS in the rural area to 21.48%. However, applying NCEP ATP III criteria, the prevalence is found to be higher, amounting to 31.1%. This is quite significant in view of preventing noncommunicable diseases such as diabetes and CAD.
Although it was reported earlier that Asian Indians have an excess cardiovascular risk at BMI and waist values considered “normal,”[16] there is no data to suggest lean MetS from any parts in India. Hence, we calculated the prevalence of lean MetS from this population after excluding those exceeding the sex-specific cutoff for waist circumference and then applying NCEP ATP III criteria. The prevalence of normal waist/lean MetS was 12.8%, and there was no significant difference between nontribal versus tribal cohort (14.6% of the nontribes vs. 11.6% of the tribal cohort, P = 0.436 [Table 5]). Thus, though the lean MetS appears to have relatively low prevalence compared to the standard definition, a significant proportion of lean MetS exists in rural India. This also stresses the fact that NCEP ATP III definition should be more appropriate for our country. Furthermore, the recognition of the presence of a large number of patients with lean MetS may have a huge impact in the society, suggesting factors other than nutritional affluence may also have an impact in the etiology of MetS.
Financial support and sponsorship
Nil.
Conflicts of interest
There are no conflicts of interest.
Acknowledgment
We acknowledge the grant provided by Department of Science and Technology, Government of West Bengal, Bikash Bhawan, Kolkata- 700 091 for conducting the study.
REFERENCES
- 1.Misra A, Khurana L. The metabolic syndrome in South Asians: Epidemiology, determinants, and prevention. Metab Syndr Relat Disord. 2009;7:497–514. doi: 10.1089/met.2009.0024. [DOI] [PubMed] [Google Scholar]
- 2.Misra A, Khurana L. Obesity and the metabolic syndrome in developing countries. J Clin Endocrinol Metab. 2008;93:S9–30. doi: 10.1210/jc.2008-1595. [DOI] [PubMed] [Google Scholar]
- 3.Pandit K, Goswami S, Ghosh S, Mukhopadhyay P, Chowdhury S. Metabolic syndrome in South Asians. Indian J Endocrinol Metab. 2012;16:44–55. doi: 10.4103/2230-8210.91187. [DOI] [PMC free article] [PubMed] [Google Scholar]
- 4.Ramachandran A, Snehalatha C, Satyavani K, Sivasankari S, Vijay V. Metabolic syndrome in urban Asian Indian adults – A population study using modified ATP III criteria. Diabetes Res Clin Pract. 2003;60:199–204. doi: 10.1016/s0168-8227(03)00060-3. [DOI] [PubMed] [Google Scholar]
- 5.Misra A, Misra R, Wijesuriya M, Banerjee D. The metabolic syndrome in South Asians: Continuing escalation & possible solutions. Indian J Med Res. 2007;125:345–54. [PubMed] [Google Scholar]
- 6.The IDF Consensus Worldwide Definition of the Metabolic Syndrome. [Last accessed on 2018 May 22]. Available from: http://www.pitt.edu/~super1/Metabolic/IDF1.pdf .
- 7.Mohan V, Deepa M, Farooq S, Narayan KM, Datta M, Deepa R, et al. Anthropometric cut points for identification of cardiometabolic risk factors in an urban Asian Indian population. Metabolism. 2007;56:961–8. doi: 10.1016/j.metabol.2007.02.009. [DOI] [PubMed] [Google Scholar]
- 8.Razak F, Anand SS, Shannon H, Vuksan V, Davis B, Jacobs R, et al. Defining obesity cut points in a multiethnic population. Circulation. 2007;115:2111–8. doi: 10.1161/CIRCULATIONAHA.106.635011. [DOI] [PubMed] [Google Scholar]
- 9.Alberti KG, Eckel RH, Grundy SM, Zimmet PZ, Cleeman JI, Donato KA, et al. Harmonizing the metabolic syndrome: A joint interim statement of the international diabetes federation task force on epidemiology and prevention; national heart, lung, and blood institute; American Heart Association; World Heart Federation; International Atherosclerosis Society; and International Association for the Study of Obesity. Circulation. 2009;120:1640–5. doi: 10.1161/CIRCULATIONAHA.109.192644. [DOI] [PubMed] [Google Scholar]
- 10.Das K, Chowdhury A. Lean NASH: Distinctiveness and clinical implication. Hepatol Int. 2013;7(Suppl 2):806–13. doi: 10.1007/s12072-013-9477-5. [DOI] [PubMed] [Google Scholar]
- 11.Targher G, Byrne CD. Clinical review: Nonalcoholic fatty liver disease: A novel cardiometabolic risk factor for type 2 diabetes and its complications. J Clin Endocrinol Metab. 2013;98:483–95. doi: 10.1210/jc.2012-3093. [DOI] [PubMed] [Google Scholar]
- 12.Targher G, Bertolini L, Rodella S, Tessari R, Zenari L, Lippi G, et al. Nonalcoholic fatty liver disease is independently associated with an increased incidence of cardiovascular events in type 2 diabetic patients. Diabetes Care. 2007;30:2119–21. doi: 10.2337/dc07-0349. [DOI] [PubMed] [Google Scholar]
- 13.Kamble P, Deshmukh PR, Garg N. Metabolic syndrome in adult population of rural Wardha, central India. Indian J Med Res. 2010;132:701–5. [PMC free article] [PubMed] [Google Scholar]
- 14.Pemminati S, Prabha Adhikari MR, Pathak R, Pai MR. Prevalence of metabolic syndrome (METS) using IDF 2005 guidelines in a semi urban South Indian (Boloor Diabetes Study) population of Mangalore. J Assoc Physicians India. 2010;58:674–7. [PubMed] [Google Scholar]
- 15.Das M, Pal S, Ghosh A. Association of metabolic syndrome with obesity measures, metabolic profiles, and intake of dietary fatty acids in people of Asian Indian origin. J Cardiovasc Dis Res. 2010;1:130–5. doi: 10.4103/0975-3583.70911. [DOI] [PMC free article] [PubMed] [Google Scholar]
- 16.Vikram NK, Pandey RM, Misra A, Sharma R, Devi JR, Khanna N, et al. Non-obese (body mass index < 25 kg/m2) Asian Indians with normal waist circumference have high cardiovascular risk. Nutrition. 2003;19:503–9. doi: 10.1016/s0899-9007(02)01083-3. [DOI] [PubMed] [Google Scholar]