

Abstract
Milk oligosaccharides (OS) are bioactive molecules that impart a variety of health benefits to the consumer. Techniques commonly used to analyse and quantify OS require optimised extraction methods to separate the OS from more abundant milk components. Solid phase extraction (SPE) is frequently used to isolate milk OS from lactose; however, the literature contains no formal studies on its efficacy in this application. In this study, established SPE conditions were modified to improve the technique’s effectiveness in purifying OS from lactose. Low concentrations of acetonitrile (ACN) and trifluoroacetic acid (TFA) were tested for solid phase washing. Lactose removal and retention of many OS were significantly improved when using 4% ACN/0.1% TFA compared with the more common water washing technique. Different behaviours between acidic and neutral OS were evident. The new SPE technique improves extraction efficiency for bovine milk OS in applications that do not require prior lactose hydrolysis.
1. Introduction
Milk is a complex mixture made up of many components and essential nutrients such as lipids, carbohydrates, proteins, vitamins, minerals and other physiologically active substances. Carbohydrates are one of the most predominant components of both human and bovine milk (4–7%) (Fox & McSweeney, 1998) and besides the main milk sugar, lactose, more complicated carbohydrate structures, known as oligosaccharides (OS), are present in milk in lower abundance. While lactose is a disaccharide composed of glucose and galactose, milk OS are composed of several key monosaccharides: glucose (Glc or Hex), galactose (Gal or Hex), N-acetylhexosamine (HexNAc), fucose (Fuc) and sialic acids (N-acetylneuraminic acid or NeuAc and N-glycolylneuraminic acid or NeuGc). These complex sugars are characterised by a lactose core linked to a variable number of lactosamine units followed by the addition of fucose or sialic acids. The OS containing at least one sialic acid belong to the acidic category, whereas all OS lacking the sialic acid substitution are classified as neutral. Despite being indigestible, OS possess many physiological functions, including the promotion of mineral absorption (Hirayama, 2002), the ability to modulate glycan expression of intestinal cells (Angeloni et al., 2005), and the ability to act as prebiotics for commensal bacteria (LoCascio et al., 2007) and decoys for pathogen binding (Newburg, Ruiz-Palacios, & Morrow, 2005).
A complete understanding of milk and its bioactive functions requires optimised techniques for OS purification and analysis to facilitate detection, characterisation and quantification. Methods based on nuclear magnetic resonance (Guérardel, Morelle, Plancke, Lemoine, & Strecker, 1999), high performance liquid chromatography (HPLC) coupled with mass spectrometry (MS) (Ninonuevo et al., 2006; Sundekilde et al., 2012; Wu et al., 2012), capillary electrophoresis (Shen, Warren, & Newburg, 2000), and high performance anion-exchange chromatography (HPAEC) (Lee, de MeloSilva, Liu, & Barile, 2015; Thurl, Müller-Werner, & Sawatzki, 1996) have been developed to analyse and quantify OS. Purifying OS prior to using these techniques is sometimes challenging due to the similarity in physical properties between OS and lactose. The smallest OS, with a degree of polymerisation of 3, will often behave similarly to lactose when OS are enriched by polarity or size-based methods. Lactose can be hydrolysed enzymatically during sample preparation (Ninonuevo et al., 2007; Ward, 2009). The resulting monosaccharides are smaller and may be separated by size-exclusion approaches; however, it is often preferable to forgo this hydrolysis to avoid OS degradation and improve throughput. In many cases, residual lactose content will not preclude instrumental analysis of milk OS. However, minimisation of residual lactose can also be advantageous, particularly for chromatographic separation or when modifying OS with expensive derivatising agents that bind to carbohydrate reducing ends. Furthermore, it is crucial that lactose and simple sugars are eliminated prior to functional testing as they may interfere with many of the functionalities (e.g., pathogen binding) and would produce false positives when testing for prebiotic activity.
Graphitised carbon solid phase extraction (SPE) is a well-established glycan purification technique that is commonly used in many glycomics workflows, including characterisation of protein N-glycomes (Aldredge, An, Tang, Waddell, & Lebrilla, 2012; Hua et al., 2013; Stumpo & Reinhold, 2010), biomarker discovery (Alley, Madera, Mechref, & Novotny, 2010; Balog et al., 2012; Vieira et al., 2012), and profiling of free milk OS (Marx et al., 2014; Mudd et al., 2016; Tao et al., 2008). Although previous publications have characterised the excellent retention characteristics of graphitized carbon in the context of glycan desalting and preconcentration (Packer, Lawson, Jardine, & Redmond, 1998; Redmond & Packer, 1999; Ward, 2009), the efficiency of the technique in separating milk OS and lactose has not been well-characterised, despite its widespread use for this purpose. Past chromatographic and extraction studies have shown that disaccharides, including lactose, can be substantially retained by graphitised carbon (Davies, Smith, Harbin, & Hounsell, 1992; Koizumi, Okada, & Fukuda, 1991; Redmond & Packer, 1999), indicating that extraction conditions would need to be carefully optimised for successful milk OS concentration by porous graphitized carbon (PGC) when lactose is present. In this study, we have quantified the residual lactose present in bovine milk OS samples after applying an established SPE technique, and then modified the technique to improve lactose removal and OS recovery. We hypothesised that OS would have a stronger affinity for the solid phase than lactose, and that by washing the solid phase with low concentrations of acetonitrile (ACN) prior to OS elution, lactose retention would decrease, thereby increasing the proportion of the stationary phase available for OS retention in comparison with the established technique of washing with water. The aim of the present study was therefore to develop a technique for bovine milk OS purification by PGC SPE that optimises OS recovery and lactose removal.
2. Materials and methods
2.1. Materials
Commercial whole bovine milk obtained from a local store was used for all experiments. Optima LC/MS ACN, Optima LC/MS formic acid, and 50% (w/w) sodium hydroxide were purchased from Fisher Scientific (Waltham, MA, USA). Molecular biology grade sodium acetate was from Millipore (now Decon Labs, Inc.). Koptec 200 proof ethanol was purchased from DLI (King of Prussia, PA, USA). Lactose used as a standard for absolute quantification and trifluoroacetic acid (TFA) was supplied by Sigma–Aldrich (St. Louis, MO, USA). Porous graphitized carbon and C18 SPE microplates were from Glygen (products FNSC18 and FNSCAR; Columbia, MD, USA). The oligosaccharide standards 3′-sialyllactose (3′-SL) and 6′-sialyllactose (6′-SL) were from V-Labs (now Dextra Laboratories Ltd., Reading, Berkshire, UK).
2.2. Solid phase extraction optimisation
OS were extracted from milk samples as described previously (Barile et al., 2010), with the modifications described below. Briefly, 400 μL aliquots of the commercial milk sample were transferred into each of 10 tubes and diluted with an equal volume of Milli-Q purified water (18.2 MΩ cm at 25 °C) (EMD Millipore, Billerica, MA, USA). Samples were centrifuged at 4000×g and 4°C for 30 min to remove milk lipids. Skim milk was carefully transferred to a separate vial, and 2 volumes of pure cold ethanol were added. Samples were incubated at −30 °C for 1 h to precipitate proteins, and subsequently centrifuged at 4000×g and 4 °C for 30 min. The supernatant was transferred to a new tube and dried by centrifugal evaporation (MiVac Quattro Concentrator, Genevac Ltd., Ipswitch, Suffolk, UK). The dried OS were re-dissolved in 300 μL of Milli-Q purified water and purified by C18 SPE to remove residual peptides and lipids. C18 wells were activated with 300 μL 100% ACN and equilibrated with 300 μL Milli-Q purified water. The carbohydrate-rich solutions were loaded in 150 μL increments and the eluate was collected. Wells were washed with 600 μL Milli-Q purified water to ensure the collection of residual OS trapped in the microplate.
Samples were divided into five groups of two samples each. ACN and TFA were added to four of these groups to provide a TFA concentration of 0.1% (v/v) and an ACN concentration of 2%, 4%, 6%, or 8% (v/v) (i.e., each ACN concentration was tested in duplicate). The remaining two samples were left in pure water as a control. After mixing thoroughly, each solution was purified by microplate PGC SPE. Each SPE well was activated with 80% ACN/0.1% TFA (v/v). After activation, the SPE wells were equilibrated with either water, 2% ACN/0.1% TFA, 4% ACN/0.1% TFA, 6% ACN/0.1% TFA, or 8% ACN/0.1% TFA to match the solvent present in each sample group. The samples were loaded into the microplate in 200 μL increments. After completely loading the samples, salts and lactose were washed from each well with six 200 μL aliquots of the corresponding solution used for equilibration. Purified OS were eluted from the microplate with three aliquots of 200 μL 40% ACN/0.1% TFA and dried in vacuum. Samples were redissolved in Milli-Q purified water before lactose quantification and MS analysis.
2.3. Recovery of oligosaccharides and lactose
The recoveries of individual OS and lactose were determined for the SPE conditions that provided the greatest OS abundances measured in MS analysis and were compared with recoveries obtained by the control technique. Milk OS were extracted as described above, in three triplicate sets. PGC SPE was omitted for one triplicate set, while the other sets were purified by PGC SPE using either 4% ACN/0.1% TFA or water as the wash solution. Absolute quantities of OS and lactose were measured as described below. Recoveries were calculated as the ratio of the concentration of each analyte in the PGC SPE-purified groups to the corresponding concentrations in the sample group not purified by PGC SPE.
2.4. Absolute quantification of OS and lactose
Oligosaccharides were quantified by high-performance anion-exchange chromatography with pulsed amperometric detection (HPAEC-PAD) on a Thermo Scientific Dionex ICS-5000+ equipped with an electrochemical cell with a disposable gold working electrode and a pH-Ag/AgCl reference electrode. Compounds were separated on a CarboPac PA200 column (3 × 250 mm) with a CarboPac PA200 guard column (3 × 50 mm, ThermoFisher Scientific, Waltham, MA, USA). Eluents consisted of water (A), 200 mM sodium hydroxide (B), and 100 mM sodium hydroxide with 100 mM sodium acetate (C). The 70-min gradient was isocratic at 30% B for 10 min, followed by an increase from 0 to 10% C from 10 to 70 min. Lactose was quantified by the same technique using a CarboPac PA10 column (4 × 250 mm) with a CarboPac PA10 guard column (4 × 50 mm, ThermoFisher Scientific, Waltham, MA, USA). The gradient was isocratic at 5% B for 12 min, followed by an increase to 50% B from 12 to 25 min. Each sample was analysed by a single injection.
2.5. Relative OS quantification by HPLC-Chip/Q-TOF MS
Samples were analysed on an Agilent 6520 Accurate-Mass Q-TOF LC/MS with a Chip Cube interface, as described previously (Sischo, Short, Geissler, Bunyatratchata, & Barile, 2017). Chromatographic separation was conducted at a nanopump flow rate of 0.3 μL min−1.
Each sample was analysed once with MS-only data acquisition and once with tandem-MS fragmentation. For tandem runs, a ramped collision energy trendline was used with the formula collision energy = 1.3*[(m/z)/100] − 3.5.
Relative OS quantification was conducted with Agilent Profinder B.06.00. Oligosaccharides were identified from the raw data using a library of bovine milk OS adapted from recent profiling studies (Aldredge et al., 2013; Mehra et al., 2014; Tao et al., 2008). The OS peaks were identified by matching to precursor mass with a 10 ppm error tolerance, and the presence of each OS in the commercial milk was confirmed by manual examination of the tandem data.
2.6. Statistical analysis
Single factor analysis of variance followed by Tukey’s post-hoc test was performed with OS peak areas and lactose quantities to compare the effect of washing the SPE plate with varying concentrations of ACN. All statistical analyses were conducted in R software, version 3.1.1. Comparisons resulting in a p-value below 0.05 were considered evidence of a significant difference in OS relative abundance and lactose quantities.
3. Results and discussion
3.1. Solid phase extraction optimisation
3.1.1. Lactose quantification
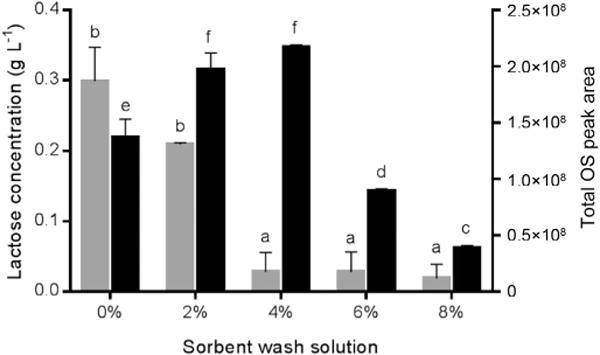
Data collected by HPAEC-PAD showed quantifiable levels of residual lactose in all samples after PGC SPE purification. This result is consistent with a past study showing retention of lactose by graphitised carbon (Redmond & Packer, 1999). Residual lactose content was highest when the PGC SPE plate was washed with water, and decreased as the ACN concentration in the wash solution increased (Fig. 1). When diluted to 400 μL (equivalent to the volume of milk used for the extraction), the control samples contained 299 mg L−1 lactose, while the 2% ACN/0.1% TFA and 4% ACN/0.1% TFA samples contained 210 mg L−1 and 28 mg L−1 lactose, respectively. There was little difference in lactose concentrations when washing with 4% ACN/0.1% TFA, 6% ACN/0.1% TFA, and 8% ACN/0.1% TFA. Although the 2% ACN/0.1% TFA samples showed a nearly 30% decrease in lactose content over the control, the decrease did not reach statistical significance due to high variation in the control lactose content. The 4% ACN/0.1% TFA samples showed a 10-fold decrease in lactose compared with the control, and this change was statistically significant (Fig. 1).
Fig. 1.
Residual lactose content (
 ; g L−1, left y-axis) in OS extracts, shown concurrently with summed OS peak areas (
 ; right y-axis), after washing the PGC SPE column with either water, 2% ACN/0.1% TFA, 4% ACN/0.1% TFA, 6% ACN/0.1% TFA, or 8% ACN/0.1% TFA. The letters a and b denote significant differences in the means of residual lactose content; c–f denote differences in the means of total OS abundance. Means that share a common letter are not significantly different.
The affinity of lactose for the graphitised carbon solid phase has important implications for milk OS extraction and analysis. First, lactose can consume a portion of the SPE column loading capacity under the conditions used to extract OS, and sample lactose content may need to be taken into account to ensure that the desired analytes are recovered. The mechanism behind OS retention and separation on PGC is not entirely clear, but it is known that elution patterns are based on the analyte size, charge, and the configuration/planarity of OS linkages (Pereira, 2008; West, Elfakir, & Lafosse, 2010). Two potential mechanisms have been proposed to explain this behaviour. The first is that polar and/or charged compounds can easily induce a dipole in graphitised carbon, resulting in dipole-induced-dipole attraction (Pereira, 2008; West et al., 2010). The second is that the graphite structure of the conjugated carbon atoms can produce highly de-localised electrons to form an electronic excess at the edges of the planes, and carbohydrates interact with the edges of these planes through hydrogen bonding (Hanai, 2004; Pereira, 2008; West et al., 2010). Given these theorised mechanisms, it is logical that lactose and OS, which are similar in structure, would possess similar affinities for PGC and therefore be challenging to separate by SPE. Introduction of low concentrations of ACN (2–4%) and TFA decreased lactose content in the purified samples and increased the abundances of many OS (as described below in Section 3.1.2), indicating an improvement in the relative affinity of OS for the PGC material. However, a small quantity of residual lactose was still present after implementing these changes, and further experiments are required to completely evaluate the extent to which the presence of lactose reduces the available sorbent binding capacity and lessens OS recovery.
Secondly, this study demonstrates that complete removal of lactose from milk OS is not possible by PGC SPE alone. All samples contained a measurable amount of residual lactose even after loading and washing the SPE plate with 8% ACN/0.1% TFA, at which point we also observed significant losses of OS compared with control samples. If an experiment requires complete lactose removal, additional steps, such as enzymatic lactose hydrolysis (de Moura Bell et al., 2016), would be necessary.
3.1.2. Relative OS quantification
The relative quantities of 21 OS were extracted from the raw MS data as peak areas and monitored through the study. The peak areas were averaged for each set of replicates and are displayed in Table 1. The data included 9 acidic (NeuAc- and NeuGc-containing) OS structures, including the abundant 3′-SL, and 6′-SL, as well as 13 neutral structures, three of which were fucosylated. Sample chromatograms are provided as Supplementary material Fig. S1.
Table 1.
Relative abundances, expressed as mean peak areas with standard deviations, of milk oligosaccharides recovered from PGC SPE purification after first washing the SPE sorbent with varying concentrations of ACN and TFA in water.a
| Compound | OS class | PGC SPE sorbent wash solution
|
||||
|---|---|---|---|---|---|---|
| water | 2% ACN/0.1% TFA | 4% ACN/0.1% TFA | 6% ACN/0.1% TFA | 8% ACN/0.1% TFA | ||
| 1_1_0_1_0 | Acidic | 3.13 (±0.41) × 105a | 6.12 (±0.63) × 105b | 5.53 (±0.12) × 105b | 2.00 (±0.04) × 105ad | 8.16 (±0.48) × 104cd |
| 2_1_0_0_0 | Neutral | 4.82 (±0.54) × 107c | 5.67 (±0.05) × 107c | 4.87 (±0.07) × 107c | 2.47 (±0.04) × 107b | 1.22 (±0.19) × 107a |
| 2_0_0_1_0 (6′-SL) | Acidic | 5.68 (±1.02) × 106a | 2.27 (±0.03) × 107c | 2.62 (±0.04) × 107d | 1.41 (±0.10) × 107b | 7.29 (±0.84) × 106a |
| 2_0_0_1_0 (3′-SL) | Acidic | 4.91 (±1.51) × 107b | ± 8.92 (1.47) × 107c | 1.11 (±0.02) × 108c | 3.01 (±0.17) × 107ab | 8.16 (±1.21) × 106a |
| 2_0_0_2_0 | Acidic | 1.06 (±0.11) × 105a | 4.61 (±0.04) × 105b | 8.35 (±0.45) × 105c | 3.77 (±0.69) × 105b | 1.18 (±0.09) × 105a |
| 2_0_0_0_1 | Acidic | 4.55 (±0.74) × 104ab | 9.72 (±0.38) × 104c | 1.11 (±0.01) × 105c | 5.63 (±0.31) × 104b | 2.94 (± 0.27) × 104a |
| 3_0_0_0_0 Isomer 1 | Neutral | 2.00 (±0.26) × 105a | 2.16 (±0.06) × 105a | 1.71 (±0.01) × 105a | 7.98 (±0.30) × 104b | 4.12 (±0.65) × 104b |
| 3_0_0_0_0 Isomer 2 | Neutral | 9.34 (±0.91) × 106a | 7.38 (±0.34) × 106b | 8.61 (±0.09) × 106 ab | 3.07 (±0.25) × 106c | 1.13 (±0.11) × 106d |
| 3_0_0_1_0 | Acidic | 4.88 (±0.14) × 106b | 8.23 (±0.27) × 106c | 8.78 (± 0.35) × 106c | 5.46 (±0.39) × 106b | 2.02 (± 0.03) × 106a |
| 3_1_0_0_0 Isomer 1 | Neutral | 3.45 (±0.13) × 105a | 5.47 (±0.32) × 105b | 5.52 (±0.02) × 105b | 1.95 (±0.11) × 105c | 7.19 (±0.13) × 104d |
| 3_1_0_0_0 Isomer 2 | Neutral | 1.84 (±0.36) × 106a | 4.50 (±0.25) × 105b | 5.24 (±0.07) × 105b | 2.56 (±0.16) × 105b | 4.57 (±0.31) × 104b |
| 3_1_0_0_0 Isomer 3 | Neutral | 3.44 (±0.18) × 106d | 2.18 (±0.15) × 106c | 2.36 (±0.07) × 106c | 1.50 (±0.05) × 106b | 4.46 (±0.18) × 105a |
| 3_1_0_0_0 Isomer 4 | Neutral | 7.47 (±0.75) × 105a | 3.82 (±0.17) × 105bd | 5.26 (±0.12) × 105c | 7.03 (±0.01) × 105a | 2.55 (±0.01) × 105d |
| 3_2_0_0_0 | Neutral | 3.61 (±0.57) × 106c | 1.77 (±0.24) × 106a | 2.76 (± 0.04) × 106ac | 3.42 (± 0.08) × 106 bc | 2.33 (±0.14) × 106ab |
| 3_3_0_0_0 | Neutral | 1.35 (±0.99) × 106a | 8.85 (±0.48) × 105a | 8.11 (±0.73) × 105a | 7.00 (±0.24) × 105a | 6.13 (±0.66) × 105a |
| 3_6_1_0_0 | Neutral | 2.51 (±0.66) × 105a | 2.072 (±0.001) × 105a | 1.76 (±0.33) × 105a | 1.43 (±0.05) × 105a | 2.07 (±0.20) × 105a |
| 3_1_0_1_0 | Acidic | 2.06 (±0.40) × 105a | 6.18 (±0.15) × 105b | 5.29 (±0.85) × 105b | 6.05 (±0.24) × 105b | 3.30 (±0.35) × 105a |
| 4_1_0_0_0 | Neutral | 6.57 (±1.22) × 106a | 4.39 (±0.03) × 106 ab | 3.85 (±0.47) × 106b | 3.13 (±0.10) × 106b | 2.62 (±0.26) × 106b |
| 4_2_0_1_0 | Acidic | 1.85 (±0.08) × 105a | 1.71 (± 0.17) × 105 ac | 1.38 (±0.07) × 105bc | 1.42 (±0.02) × 105bc | 1.65 (±0.01) × 105abc |
| 4_5_1_0_0 | Neutral | 3.69 (±0.32) × 104a | 5.39 (±0.02) × 104b | 4.47 (±0.52) × 104ab | 4.65 (±0.08) × 104ab | 3.89 (±0.42) × 104a |
| 5_4_1_0_0 | Neutral | 5.16 (±0.69) × 105a | 2.37 (±0.06) × 105b | 2.58 (± 0.20) × 105b | 2.78 (±0.02) × 105b | 4.64 (± 0.49) × 105a |
| Total | 1.37 (±0.16) × 108c | 1.97 (±0.15) × 108d | 2.17 (±0.02) × 108d | 8.93 (±0.21) × 107b | 3.87 (± 0.24) × 107a | |
Oligosaccharides are represented by their monosaccharide compositions, denoted as Hex_HexNAc_Fuc_NeuAc_NeuGc, with each number representing the quantity of the respective monosaccharide type. Hex: hexose, HexNAc: N-acetylhexosamine, Fuc: fucose, NeuAc: N-acetylneuraminic acid, NeuGc: N-glycolylneuraminic acid. Different superscript letters indicate significant differences in relative abundances among all acetonitrile concentrations for each oligosaccharide in each row.
When purifying milk OS by PGC SPE, the solid phase is normally washed with water after sample loading (Mudd et al., 2016; Sundekilde et al., 2012; Tao et al., 2008), and water was therefore used as a control to the effectiveness of washing with low concentrations of ACN and TFA. TFA was included in all washing solutions to improve the recovery of acidic OS, as acidic pH increases the affinity of acidic OS for graphitised carbon (Pabst & Altmann, 2008). When the abundances of all OS were summed within each treatment group, the OS collected from the 4% ACN/0.1% TFA group generated the greatest total peak area, and this summed abundance was significantly higher than the control (Fig. 1). This increase in total OS retention occurred simultaneously with decreased lactose retention at 4% ACN/0.1% TFA. Therefore, lactose appears to bind less strongly to PGC under these conditions, and we propose that the improved OS recovery is a direct result of reduced competition for binding between the OS and lactose. The weaker binding of lactose is consistent with the prior finding that carbohydrate affinity for PGC tends to increase with molecular size (Pereira, 2008).
Within the acidic OS category, marked increases in abundance were observed when washing the microplate with 2% ACN/0.1% TFA and 4% ACN/0.1% TFA (Figs. 2 and 3; Table 1). Compared with the control, seven of the eight acidic OS showed significantly higher recoveries when washing with 2% ACN/0.1% TFA, and two were significantly more abundant after washing with 4% ACN/0.1% TFA compared with 2% ACN/0.1% TFA (Table 1 and Supplementary material Table S1). The majority of acidic OS gave maximal peak areas with 4% ACN/0.1% TFA, with subsequent decreases at higher ACN concentrations (6% ACN/0.1% TFA and 8% ACN/0.1% TFA). P-values for each Tukey post-hoc test are shown in Supplementary material Table S1.
Fig. 2.
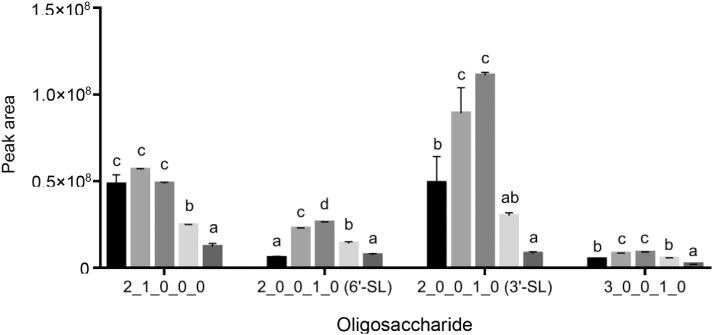
Relative abundances, expressed as peak areas, of representative high-abundance oligosaccharides recovered from PGC SPE after washing the sorbent with (left to right):
 , water;
 , 2% ACN/0.1% TFA;
 , 4% ACN/0.1% TFA;
 , 6% ACN/0.1% TFA;
 , 8% ACN/0.1% TFA. For each oligosaccharide, means of relative abundances that share the same letter are not significantly different, while different letters indicate significant differences. Oligosaccharides are represented by their monosaccharide compositions, denoted as Hex_HexNAc_-Fuc_NeuAc_NeuGc, with each number representing the quantity of the respective monosaccharide type. Hex, hexose; HexNAc, N-acetylhexosamine; Fuc, fucose; NeuAc, N-acetylneuraminic acid; NeuGc, N-glycolylneuraminic acid.
Fig. 3.
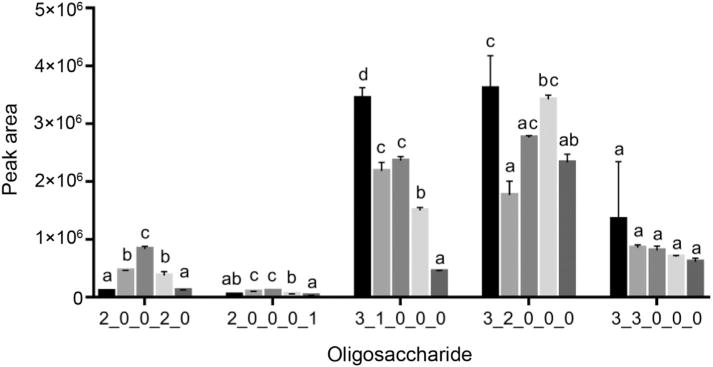
Relative abundances, expressed as peak areas, of selected lesser-abundant OS recovered from PGC SPE after washing the sorbent with (left to right):
 , water;
 , 2% ACN/0.1% TFA;
 , 4% ACN/0.1% TFA;
 , 6% ACN/0.1% TFA;
 , 8% ACN/0.1% TFA. For each oligosaccharide, means of relative abundances that share the same letter are not significantly different, while different letters indicate significant differences. Oligosaccharides are represented by their monosaccharide compositions, denoted as Hex_HexNAc_Fuc_NeuAc_NeuGc, with each number representing the quantity of the respective monosaccharide type. Hex, hexose; HexNAc, N-acetylhexosamine; Fuc, fucose; NeuAc, N-acetylneuraminic acid; NeuGc, N-glycolylneuraminic acid.
Introduction of ACN and TFA to the SPE washing solution had a varied impact on neutral OS recovery, especially for those with lower abundances. For example, the OS 3 Hex 3 HexNAc (Fig. 3), showed sequential decreases in recovery as the ACN content of the wash solution increased. These decreases were mostly nonsignificant when using 2% ACN and 4% ACN. Other neutral OS, including those with compositions 3 Hex 2 HexNAc and 3 Hex 1 HexNAc (Fig. 3), showed decreased retention when using 2% ACN/0.1% TFA, with a subsequent increase in abundance upon progressing to 4% ACN/0.1% TFA. We hypothesise that these nonlinear changes may reflect decreased competition for binding between some neutral OS and lactose, since lactose retention significantly decreased upon progressing to the 4% ACN solution. Furthermore, the fact that this behaviour was not observed for all neutral OS illustrates substantial variations in binding affinities within this class of compounds. Overall, the decrease in neutral OS recovery upon introducing 2–4% ACN and 0.1% TFA to the wash solution was minimal. The concurrent finding that acidic OS recovery increased under these conditions is likely a reflection of the stronger affinity of graphitised carbon for acidic compounds, as illustrated previously (Davies et al., 1992). The highly abundant neutral trisaccharide 2 Hex 1 HexNAc was unique in that it showed a nonsignificant increase upon the introduction of 2% ACN/0.1% TFA (Fig. 2).
Taken together, the relative abundance measurements for the neutral and acidic OS, as well as the summed OS abundances for each treatment group, demonstrate that 4% ACN/0.1% TFA provided the best overall retention of bovine milk OS in the presence of lactose. The ability to concentrate milk OS while depleting sample lactose content is advantageous in many instances of OS characterisation and subsequent functional testing, as a high lactose content can hinder chromatographic separation, consumes greater quantities of reagents when performing reducing-end derivatisation, and can mask oligosaccharide bioactivity in in vitro assays. The extraction modifications implemented in this study have improved lactose removal and OS retention for the tested bovine milk sample. Bovine milk contains OS that are similar in structure to those in human and other types of milk (Albrecht et al., 2014; Aldredge et al., 2013; Tao, Ochonicky, German, Donovan, & Lebrilla, 2010), and so this modified extraction technique could likely be extended to the milk of other mammals. However, since unique OS are also present in each milk type, further would be necessary to verify this assumption.
3.2. Lactose and OS recoveries under optimised extraction conditions
To further characterise the effectiveness of PGC SPE for milk OS purification, we measured recoveries for lactose and OS when using 4% ACN/0.1% TFA as the sorbent wash solution and compared these results to the recoveries obtained by the standard water-washing technique.
Since analytical-grade standards are unavailable for the majority of milk OS, it is only possible to quantify a subset of the OS identified in Section 3.1.2. Furthermore, the greater abundance of lactose prior to PGC SPE hinders successful chromatographic separation of some OS by anion-exchange chromatography. Therefore, we have provided recovery data for the OS 3′-SL and 6′-SL, which are two of the most abundant bovine milk OS (Fong, Ma, & McJarrow, 2011; McJarrow & van Amelsfort-Schoonbeek, 2004; Tao et al., 2008). For both of these OS, recoveries were higher when washing the SPE sorbent with 4% ACN/0.1% TFA, with the recovery of 6′-SL increasing almost six-fold from 3.3% to 19.5% (Table 2). Despite this improvement over the control method, the OS recoveries of approximately 20% indicate substantial losses during PGC SPE.
Table 2.
Recoveries of oligosaccharides and lactose after sample purification by graphitised carbon solid phase extraction.a
| Sorbent wash solution | Recovery (%)
|
||
|---|---|---|---|
| 3′-Sialyllactose | 6′-Sialyllactose | Lactose | |
| 4% ACN/0.1% TFA | 20.7 ± 0.4 | 19.5 ± 1.3 | 0.14 ± 0.05 |
| Water | 19.0 ± 8.2 | 3.3 ± 0.5 | 0.93 ± 0.16 |
Abbreviations are: ACN, acetonitrile; TFA, trifluoroacetic acid. Values are the mean ± standard deviation.
Based on past studies (Fong et al., 2011; McJarrow & van Amelsfort-Schoonbeek, 2004) and the quantitative information collected on the milk used in this study (42.2 ± 0.6 mg L−1 total sialyllactose concentration), we expect the total OS concentration in mature milk to be approximately 100 mg L−1. The total OS mass loaded onto the PGC sorbent was therefore approximately 0.04 mg, which is well below its 2 mg binding capacity. We propose that the losses observed during purification were a result of the competition between lactose and OS for sorbent binding, as the total lactose content in each sample aliquot was measured at 14.3 ± 0.1 mg prior to PGC SPE. As shown in Table 2, lactose recovery was much lower than that of the OS, providing further evidence that lactose interacts with the PGC material more weakly than OS. However, its presence in the sample appears to effectively hinder OS binding.
While the OS recoveries measured in this study are often sufficient for qualitative sample analysis, the data demonstrates that quantitative OS recovery is not achieved when performing PGC SPE in the presence of lactose. The technique developed in this study improves OS recovery over the established SPE method; however, OS profiling studies would likely benefit from a technique that increases these recoveries further. Future work should focus on identifying approaches to increase recovery by investigating additional method variables, such as the optimal volume of milk to be used or additional techniques by which lactose can be removed during extraction.
4. Conclusions
The techniques presented in this paper may serve as a guide for purification of milk OS, which are rich in acidic compounds, in cases where improved lactose removal is desirable. In general, optimum lactose removal and OS recovery was accomplished by loading and washing the sorbent with 4% ACN/0.1% TFA. High-throughput experiments that aim to collect qualitative OS data or measure relative OS abundances would benefit from this approach over the control method. Beyond 4% ACN, no significant decrease in lactose content was observed, and OS quantities began to diminish. However, minimal decreases in some neutral OS were observed with the introduction of ACN and TFA. Furthermore, recovery data demonstrates that even upon using the improved extraction technique, milk OS are not recovered quantitatively. Therefore, studies requiring highly quantitative OS recovery or complete lactose removal, such as for bacterial growth or immune assays, would require additional steps such as lactose hydrolysis.
Supplementary Material
Acknowledgments
This research was supported in part by funding the National Institutes of Health awards R01AT007079 and R01AT008759, USDA:NIFA Hatch project 232719 and USDA:NIFA 2014-05266 from the National Institute of Food and Agriculture (Washington, DC, USA). The authors would like to acknowledge Courtney Riggle (University of California, Davis, CA, USA) for her assistance in editing the manuscript.
Appendix A. Supplementary data
Supplementary data related to this article can be found at https://doi.org/10.1016/j.idairyj.2017.12.009.
Footnotes
Conflicts of interest
D. B. is a cofounder of Evolve Biosystems, a company focused on diet-based manipulation of the gut microbiota. Evolve Biosystems played no role in the funding, design, execution, interpretation, or publication of this work.
References
- Albrecht S, Lane JA, Marino K, Al Busadah KA, Carrington SD, Hickey RM, et al. A comparative study of free oligosaccharides in the milk of domestic animals. British Journal of Nutrition. 2014;111:1313–1328. doi: 10.1017/S0007114513003772. [DOI] [PubMed] [Google Scholar]
- Aldredge DL, An HJ, Tang N, Waddell K, Lebrilla CB. Annotation of a serum N-glycan library for rapid identification of structures. Journal of Proteome Research. 2012;11:1958–1968. doi: 10.1021/pr2011439. [DOI] [PMC free article] [PubMed] [Google Scholar]
- Aldredge DL, Geronimo MR, Hua S, Nwosu CC, Lebrilla CB, Barile D. Annotation and structural elucidation of bovine milk oligosaccharides and determination of novel fucosylated structures. Glycobiology. 2013;23:664–676. doi: 10.1093/glycob/cwt007. [DOI] [PMC free article] [PubMed] [Google Scholar]
- Alley WR, Jr, Madera M, Mechref Y, Novotny MV. Chip-based reversed-phase liquid chromatography– mass spectrometry of permethylated N-linked glycans: A potential methodology for cancer-biomarker discovery. Analytical Chemistry. 2010;82:5095–5106. doi: 10.1021/ac100131e. [DOI] [PMC free article] [PubMed] [Google Scholar]
- Angeloni S, Ridet J, Kusy N, Gao H, Crevoisier F, Guinchard S, et al. Glycoprofiling with micro-arrays of glycoconjugates and lectins. Glycobiology. 2005;15:31–41. doi: 10.1093/glycob/cwh143. [DOI] [PubMed] [Google Scholar]
- Balog CI, Stavenhagen K, Fung WL, Koeleman CA, McDonnell LA, Verhoeven A, et al. N-glycosylation of colorectal cancer tissues a liquid chromatography and mass spectrometry-based investigation. Molecular & Cellular Proteomics. 2012;11:571–585. doi: 10.1074/mcp.M111.011601. [DOI] [PMC free article] [PubMed] [Google Scholar]
- Barile D, Marotta M, Chu C, Mehra R, Grimm R, Lebrilla C, et al. Neutral and acidic oligosaccharides in Holstein-Friesian colostrum during the first 3 days of lactation measured by high performance liquid chromatography on a microfluidic chip and time-of-flight mass spectrometry. Journal of Dairy Science. 2010;93:3940–3949. doi: 10.3168/jds.2010-3156. [DOI] [PMC free article] [PubMed] [Google Scholar]
- Davies M, Smith KD, Harbin AM, Hounsell EF. High-performance liquid chromatography of oligosaccharide alditols and glycopeptides on a graphitized carbon column. Journal of Chromatography A. 1992;609:125–131. doi: 10.1016/0021-9673(92)80155-n. [DOI] [PubMed] [Google Scholar]
- Fong B, Ma K, McJarrow P. Quantification of bovine milk oligosaccharides using liquid chromatography–selected reaction monitoring–mass spectrometry. Journal of Agricultural and Food Chemistry. 2011;59:9788–9795. doi: 10.1021/jf202035m. [DOI] [PubMed] [Google Scholar]
- Fox PF, McSweeney PL. Dairy chemistry and biochemistry. 1st. New York, NY, USA: Blackie Academic & Professional; 1998. [Google Scholar]
- Guérardel Y, Morelle W, Plancke Y, Lemoine J, Strecker G. Structural analysis of three sulfated oligosaccharides isolated from human milk. Carbohydrate Research. 1999;320:230–238. doi: 10.1016/s0008-6215(99)00153-6. [DOI] [PubMed] [Google Scholar]
- Hanai T. Analysis of the mechanism of retention on graphitic carbon by a computational chemical method. Journal of Chromatography A. 2004;1030:13–16. doi: 10.1016/j.chroma.2003.11.026. [DOI] [PubMed] [Google Scholar]
- Hirayama M. Novel physiological functions of oligosaccharides. Pure and Applied Chemistry. 2002;74:1271–1279. [Google Scholar]
- Hua S, Jeong HN, Dimapasoc LM, Kang I, Han C, Choi JS, et al. Isomer-specific LC/MS and LC/MS/MS profiling of the mouse serum N-glycome revealing a number of novel sialylated N-glycans. Analytical Chemistry. 2013;85:4636–4643. doi: 10.1021/ac400195h. [DOI] [PMC free article] [PubMed] [Google Scholar]
- Koizumi K, Okada Y, Fukuda M. High-performance liquid chromatography of mono-and oligo-saccharides on a graphitized carbon column. Carbohydrate Research. 1991;215:67–80. [Google Scholar]
- Lee H, de MeloSilva VL, Liu Y, Barile D. Quantification of carbohydrates in whey permeate products using high-performance anion-exchange chromatography with pulsed amperometric detection. Journal of Dairy Science. 2015;98:7644–7649. doi: 10.3168/jds.2015-9882. [DOI] [PMC free article] [PubMed] [Google Scholar]
- LoCascio RG, Ninonuevo MR, Freeman SL, Sela DA, Grimm R, Lebrilla CB, et al. Glycoprofiling of bifidobacterial consumption of human milk oligosaccharides demonstrates strain specific, preferential consumption of small chain glycans secreted in early human lactation. Journal of Agricultural and Food Chemistry. 2007;55:8914–8919. doi: 10.1021/jf0710480. [DOI] [PubMed] [Google Scholar]
- Marx C, Bridge R, Wolf AK, Rich W, Kim JH, Bode L. Human milk oligosaccharide composition differs between donor milk and mother’s own milk in the NICU. Journal of Human Lactation. 2014;30:54–61. doi: 10.1177/0890334413513923. [DOI] [PubMed] [Google Scholar]
- McJarrow P, van Amelsfort-Schoonbeek J. Bovine sialyl oligosaccharides: Seasonal variations in their concentrations in milk, and a comparison of the colostrums of Jersey and Friesian cows. International Dairy Journal. 2004;14:571–579. [Google Scholar]
- Mehra R, Barile D, Marotta M, Lebrilla CB, Chu C, German JB. Novel high-molecular weight fucosylated milk oligosaccharides identified in dairy streams. PLoS One. 2014;9:e96040. doi: 10.1371/journal.pone.0096040. [DOI] [PMC free article] [PubMed] [Google Scholar]
- de Moura Bell JM, Aquino LF, Liu Y, Cohen JL, Lee H, de Melo Silva VL, et al. Modeling lactose hydrolysis for efficiency and selectivity: Toward the preservation of sialyloligosaccharides in bovine colostrum whey permeate. Journal of Dairy Science. 2016;99:6157–6163. doi: 10.3168/jds.2016-11065. [DOI] [PubMed] [Google Scholar]
- Mudd AT, Salcedo J, Alexander LS, Johnson SK, Getty CM, Chichlowski M, et al. Porcine milk oligosaccharides and sialic acid concentrations vary throughout lactation. Frontiers in Nutrition. 2016;3 doi: 10.3389/fnut.2016.00039. article 39. [DOI] [PMC free article] [PubMed] [Google Scholar]
- Newburg DS, Ruiz-Palacios GM, Morrow AL. Human milk glycans protect infants against enteric pathogens. Annual Review of Nutrition. 2005;25:37–58. doi: 10.1146/annurev.nutr.25.050304.092553. [DOI] [PubMed] [Google Scholar]
- Ninonuevo MR, Park Y, Yin H, Zhang J, Ward RE, Clowers BH, et al. A strategy for annotating the human milk glycome. Journal of Agricultural and Food Chemistry. 2006;54:7471–7480. doi: 10.1021/jf0615810. [DOI] [PubMed] [Google Scholar]
- Ninonuevo MR, Ward RE, LoCascio RG, German JB, Freeman SL, Barboza M, et al. Methods for the quantitation of human milk oligosaccharides in bacterial fermentation by mass spectrometry. Analytical Biochemistry. 2007;361:15–23. doi: 10.1016/j.ab.2006.11.010. [DOI] [PubMed] [Google Scholar]
- Pabst M, Altmann F. Influence of electrosorption, solvent, temperature, and ion polarity on the performance of LC-ESI-MS using graphitic carbon for acidic oligosaccharides. Analytical Chemistry. 2008;80:7534–7542. doi: 10.1021/ac801024r. [DOI] [PubMed] [Google Scholar]
- Packer NH, Lawson MA, Jardine DR, Redmond JW. A general approach to desalting oligosaccharides released from glycoproteins. Glyco-conjugate Journal. 1998;15:737–747. doi: 10.1023/a:1006983125913. [DOI] [PubMed] [Google Scholar]
- Pereira L. Porous graphitic carbon as a stationary phase in HPLC: Theory and applications. Journal of Liquid Chromatography & Related Technologies. 2008;31:1687–1731. [Google Scholar]
- Redmond JW, Packer NH. The use of solid-phase extraction with graphitised carbon for the fractionation and purification of sugars. Carbohydrate Research. 1999;319:74–79. [Google Scholar]
- Shen Z, Warren CD, Newburg DS. High-performance capillary electrophoresis of sialylated oligosaccharides of human milk. Analytical Biochemistry. 2000;279:37–45. doi: 10.1006/abio.1999.4448. [DOI] [PubMed] [Google Scholar]
- Sischo WM, Short DM, Geissler M, Bunyatratchata A, Barile D. Comparative composition, diversity, and abundance of oligosaccharides in early lactation milk from commercial dairy and beef cows. Journal of Dairy Science. 2017;100:3883–3892. doi: 10.3168/jds.2016-12388. [DOI] [PMC free article] [PubMed] [Google Scholar]
- Stumpo KA, Reinhold VN. The N-glycome of human plasma. Journal of Proteome Research. 2010;9:4823–4830. doi: 10.1021/pr100528k. [DOI] [PMC free article] [PubMed] [Google Scholar]
- Sundekilde UK, Barile D, Meyrand M, Poulsen NA, Larsen LB, Lebrilla CB, et al. Natural variability in bovine milk oligosaccharides from Danish Jersey and Holstein-Friesian breeds. Journal of Agricultural and Food Chemistry. 2012;60:6188–6196. doi: 10.1021/jf300015j. [DOI] [PMC free article] [PubMed] [Google Scholar]
- Tao N, DePeters E, Freeman S, German J, Grimm R, Lebrilla C. Bovine milk glycome. Journal of Dairy Science. 2008;91:3768–3778. doi: 10.3168/jds.2008-1305. [DOI] [PubMed] [Google Scholar]
- Tao N, Ochonicky KL, German JB, Donovan SM, Lebrilla CB. Structural determination and daily variations of porcine milk oligosaccharides. Journal of Agricultural and Food Chemistry. 2010;58:4653–4659. doi: 10.1021/jf100398u. [DOI] [PMC free article] [PubMed] [Google Scholar]
- Thurl S, Müller-Werner B, Sawatzki G. Quantification of individual oligosaccharide compounds from human milk using high-pH anion-exchange chromatography. Analytical Biochemistry. 1996;235:202–206. doi: 10.1006/abio.1996.0113. [DOI] [PubMed] [Google Scholar]
- Vieira AC, An HJ, Ozcan S, Kim JH, Lebrilla CB, Mannis MJ. Glycomic analysis of tear and saliva in ocular rosacea patients: The search for a biomarker. The Ocular Surface. 2012;10:184–192. doi: 10.1016/j.jtos.2012.04.003. [DOI] [PMC free article] [PubMed] [Google Scholar]
- Ward RE. Isolation of milk oligosaccharides using solid-phase extraction. Open Glycoscience. 2009;2:9–15. [Google Scholar]
- West C, Elfakir C, Lafosse M. Porous graphitic carbon: A versatile stationary phase for liquid chromatography. Journal of Chromatography A. 2010;1217:3201–3216. doi: 10.1016/j.chroma.2009.09.052. [DOI] [PubMed] [Google Scholar]
- Wu S, Salcedo J, Tang N, Waddell K, Grimm R, German JB, et al. Employment of tandem mass spectrometry for the accurate and specific identification of oligosaccharide structures. Analytical Chemistry. 2012;84:7456–7462. doi: 10.1021/ac301398h. [DOI] [PMC free article] [PubMed] [Google Scholar]
Associated Data
This section collects any data citations, data availability statements, or supplementary materials included in this article.