

Abstract
Background
Alcohol is often consumed with opioids and alcohol misuse interferes with treatment for opioid use disorder (OUD). Drug misuse is associated with worse alcohol use disorder (AUD) treatment outcomes, yet no studies have investigated the role of opioid misuse in AUD treatment outcomes.
Methods
We conducted secondary analyses of the medication conditions of the COMBINE study (n=1226), a randomized clinical trial of medications (acamprosate and/or naltrexone) and behavioral interventions (medication management and/or behavioral intervention) for alcohol dependence. We examined associations between baseline opioid misuse and the use of cannabis and other drugs with time-to-first drinking day, time-to-first heavy drinking day, and the frequency and intensity of drinking during treatment and one year following treatment, based on latent profile analysis. Opioid misuse was defined as use of illicit or prescription opioids without a prescription or not as directed in the previous 6 months, in the absence of OUD. Self-reported cannabis and other drug use were also examined. Seventy individuals (5.7%) met the opioid misuse definition and 542 (44.2%) reported use of cannabis or other drugs without opioid misuse. We also examined medication adherence as a potential mediator.
Results
Baseline opioid misuse significantly predicted the time-to-first heavy drinking day (OR=1.38 [95%CI: 1.13, 1.64], p=0.001) and a higher probability of being in a heavier and more frequent drinking profile at the end of treatment (OR=2.90 [95% CI: 1.43, 5.90], p=0.003), and at one year following treatment (OR=2.66 [95%CI: 1.26, 5.59], p=0.01). Cannabis and other drug use also predicted outcomes. Medication adherence partially mediated the association between opioid misuse, cannabis use, other drug use, and treatment outcomes.
Conclusions
Opioid misuse and other drug use were associated with poorer AUD treatment outcomes, which was mediated by medication adherence. Clinicians and researchers should assess opioid misuse and other drug use in patients undergoing AUD treatment.
Keywords: alcohol use disorder, opioid use disorder, opioid misuse, prescription opioid use, alcohol relapse, COMBINE study, medication adherence, opioid epidemic, naltrexone
Introduction
Alcohol use disorder (AUD) is a chronic relapsing condition (McLellan et al., 2000). Prior studies have identified multiple biopsychosocial predictors of relapse (Connors et al., 1996; Greenfield et al., 2000; Sinha and Li, 2007; Witkiewitz, 2011; Witkiewitz and Marlatt, 2004), though none have considered the effects of opioid misuse on alcohol treatment outcomes. The primary goal of this study was to examine whether opioid misuse, defined as the use of illicit opioids (e.g., heroin) or the use of prescription opioids without a prescription or not as directed, was related to outcomes in a multisite clinical trial of alcohol treatment for patients with AUD (Anton et al., 2006).
Opioid and Alcohol Use, Co-Use, and the Role of Alcohol in Opioid Use Disorder Treatment
In the United States, the prevalence of past-year prescription opioid misuse increased 128% from 2001-2002 to 2012-2013, and the prevalence of prescription opioid use disorder (OUD) increased 125% over the same period (Saha et al., 2016). Escalating rates of heroin initiation among individuals who misuse prescription opioids have contributed to substantial increases in the prevalence of heroin use and OUD in recent years (Compton et al., 2016; Jones, 2013; Jones et al., 2015). Critically, rates of opioid overdose deaths tripled from 2000-2014 (Rudd et al., 2016). Together, these trends have received widespread attention among researchers, policy leaders, governmental agencies, and mainstream media (Clarke et al., 2016; Manchikanti et al., 2012; Volkow and Collins, 2017). Importantly, although the opioid epidemic is currently a focus in North America, there is growing concern about increases in prescription opioid use and potential for misuse worldwide (Birke et al., 2016; Hamunen et al., 2009; Humphreys, 2017; Kovitwanichkanont and Day, 2017)
The rise of opioid misuse and OUD over the past two decades is a cause for concern (Compton and Volkow, 2006). However, individuals are far more likely to be impacted by risky alcohol use and AUD than by opioid misuse or OUD. For example, nationally-representative estimates from 2012-2013 indicate that approximately 12.6% of US adults engaged in alcohol misuse (i.e., binge drinking: 4/5+ standard drinks for women/men) and 12.7% of US adults met criteria for past-year AUD (Grant et al., 2017). Comparable rates for prescription opioid misuse and prescription OUD were 4.1% and 0.9%, respectively (Saha et al., 2016). The costs to US society from opioid overdose, misuse, and OUD were estimated to be $78.5 billion in 2013 (Florence et al., 2016), compared with the costs of high-risk drinking and AUD, which were estimated to be $249 billion in 2010 (Centers for Disease Control and Prevention (CDC), 2016).
Few studies have examined the epidemiology of the co-use of alcohol and opioids (Edwards et al., 2017; Witkiewitz and Vowles, 2018). Nationally-representative data indicate that prescription opioid misuse and OUD significantly increase the risk of a co-occurring AUD (Saha et al., 2016), and alcohol use significantly increases the likelihood of misusing prescription drugs (Hughes et al., 2016). Those with AUD have greater odds of initiating prescription opioid misuse and they display faster transitions to OUD once misuse is initiated (Schepis and Hakes, 2017). The co-ingestion of opioids and alcohol is particularly concerning. Alcohol is involved in over 20% of opioid-related overdose deaths (Jones et al., 2014), and co-occurring AUD significantly increases the risk of all-cause mortality among OUD patients (Bogdanowicz et al., 2015).
Alcohol misuse may also interfere with OUD treatment. Acute alcohol intoxication has been associated with a greater risk of opioid use during OUD treatment (Friedmann et al., 2017), and greater alcohol consumption predicts lower rates of adherence to methadone maintenance treatment (Roux et al., 2014). These findings are particularly concerning given evidence that alcohol use may increase during the course of OUD treatment (Soyka, 2015; Srivastava et al., 2008). Limited research has also shown that the illicit use of all drugs, not just opioids, by participants of twelve-step programs may increase their risk of alcohol use (Tonigan and Beatty, 2011). Further, cannabis use at pretreatment (Mojarrad et al., 2014) and during treatment (Subbaraman et al., 2017) is associated with worse alcohol treatment outcomes.
Alcohol, Opioid, and other Drug Use and Medication Adherence
One potential explanation for the negative impact of substance use on treatment outcomes is treatment adherence (Sansone and Sansone, 2008). Generally, alcohol use and heavy drinking are associated with poorer adherence to naltrexone (Dermody et al., 2018). Similarly, opioid misuse has been shown to reduce adherence to antiretroviral medications among individuals with HIV (Jeevanjee et al., 2014). The use of heroin, alcohol, and cocaine and other stimulants have also been associated with poorer adherence to antiretrovirals in a large sample of individuals across the United States (Rosen et al., 2013). It is unclear whether opioid misuse specifically could impact adherence to alcohol medications, above and beyond the effects of other drug use.
Current Study
The observed effects of alcohol use on OUD treatment outcomes raises the converse question: namely, does opioid misuse adversely affect AUD treatment outcomes? To examine this question, we conducted secondary analyses of data from the COMBINE Study (COMBINE Study Group, 2003), a large US multisite trial of alcohol dependence. Participants were categorized into the following groups: (1) no drug use, (2) cannabis use only, (3) other drug use with or without cannabis use, and (4) opioid misuse with or without cannabis or other drug use. First, we examined the baseline (i.e., pretreatment) characteristics of individuals who reported opioid misuse, cannabis use, and other drug use. Second, we examined whether opioid misuse, cannabis use, and other drug use were associated with AUD treatment outcomes. We hypothesized that, after controlling for cannabis use and other drug use, opioid misuse would be associated with a shorter time-to-first drinking day, shorter time-to-first heavy drinking day, and greater alcohol use during treatment and following treatment. Third, because substance use can reduce treatment adherence (Sansone and Sansone, 2008), we examined treatment adherence as a mediator of the association of opioid misuse, cannabis use, and other drug use with AUD treatment outcomes. We hypothesized that lower treatment adherence among individuals with opioid misuse, cannabis use, and other drug use would mediate the associations between these behaviors and AUD treatment outcomes.
Methods
Participants and Procedures
A total of 1383 participants with alcohol dependence were recruited from the community for the COMBINE study, conducted at 11 research sites (Anton et al., 2006). Patients were randomized into 9 treatment groups, consisting of a combination of medical management (MM, up to 9 sessions over 16 weeks) and/or combined behavioral intervention (CBI, up to 20 sessions over 16 weeks) and medications (acamprosate, naltrexone, and/or placebo), or CBI only (n=157) (COMBINE Study Group, 2003). Exclusion criteria included: other current (past 90 days) DSM-IV drug abuse or dependence (besides nicotine or cannabis), past 6 months DSM-IV opioid abuse or dependence, serious mental illness or medical conditions, receipt of medications that could increase the risk of medication side effects, or exposure to study medications during the 30 days prior to baseline assessment.
The current study focused on individuals (n=1226) who received medications (either active or placebo medication) and a behavioral intervention (MM with or without CBI). Because of our interest in examining medication adherence, we excluded the 157 individuals who received CBI only (without pills). Of these 1,226 individuals, 30.8% were female and 23.2% were ethnic minorities (76.8% Non-Hispanic White, 11.2% Hispanic American, 8.2% African American, 1.2% American Indian or Alaska Native, 0.3% Asian American or Pacific Islander, 1.4% multiracial, and 1.0% “other”). Mean age was 44.3 years (SD=10.1), 88% had at least 12 years of education, and 42% were married. Participants received treatment for a total of 16 weeks and completed assessments at 26, 52, and 68 weeks post-baseline (10, 36, and 52 weeks post-treatment).
Measures
Alcohol use
Alcohol consumption was assessed using a calendar method via the Form-90 (Miller, 1996) in US standard drinks (unit of alcohol=14 grams) for 485 days (120 days during treatment and 365 days following treatment). Daily standard drinks and daily heavy drinking (i.e., 4+/5+ standard drinks for women/men) were used as indicators in Cox proportional hazards models (described below). Additional analyses were conducted with four outcome variables assessed at month 4 (during treatment) and month 16 (one year following treatment): percent drinking days (PDD; a measure of drinking frequency), drinks per drinking day (DDD; a measure of drinking intensity), percent heavy drinking days (PHDD; defined as the percentage of days with 4+/5+ drinks for women/men), and the maximum number of drinks on the peak drinking occasion (MXD, a measure of peak drinking).
Opioid Misuse and Cannabis and Other Drug Use
The Structured Clinical Interview for DSM-IV Disorders (SCID) (First et al., 1996) was used to assess opioid use in the six months prior to participation in the COMBINE study. Individuals with OUD were excluded from the study. The SCID question for “use of opioids” had three response levels: (1) never used, used once, or used prescribed opioid as directed (n=1021; 93.6%); (2) misused (i.e., without a prescription or not as directed) 2-10 times in a one-month period (n=51; 4.7%); and (3) misused more than 10 times in a one-month period (n=19; 1.7%). Notably, this question did not differentiate between prescription opioids and heroin. Responses to this question were dichotomized into no opioid misuse (never used, used once, or used prescribed opioids as directed) and opioid misuse (misused more than 2 times in a one-month period in the previous 6 months).
Cannabis and other drug use were assessed by both the Form-90 (Miller, 1996) and the SCID (First et al., 1996). If an individual endorsed any days of cannabis or other drug use on the Form-90 or endorsed using cannabis or other drugs on 2 or more occasions in a one-month period on the SCID, then they were considered as using cannabis (n=504, 41.5%) or other drugs (n=387, 31.6%) at baseline. Other drug use included cocaine (10.4%), sedatives (7.2%), amphetamines (2.3%), hallucinogens (1.7%), steroids (0.5%), hypnotics (0.3%), inhalants (0.3%), and “other” (1.5%). The Form-90 was not used to measure opioid misuse because some individuals could have reported opioid use as prescribed on the Form-90. There was significant comorbidity between opioid misuse and cannabis and other drug use, with more than 74% of individuals with opioid misuse using cannabis or other drugs (see Table 1). Given multicollinearity between the individual measures of cannabis use, other drug use, and opioid misuse, we created a four-level variable based on responses to the Form 90 and SCID to define any use of cannabis or other drugs and the SCID to characterize opioid misuse. The four levels were: (1) no cannabis, other drug, or opioid misuse (n=614, 50.1%), (2) cannabis use only (n=207, 16.9%), (3) other non-opioid drug use with or without cannabis use (n=335, 27.3%, of which 244 [72.8%] also had cannabis use), and (4) opioid misuse with or without cannabis and other drug use (n=70, 5.7%). We chose to separate cannabis use only from other drug use given prior evidence from the COMBINE study that cannabis use during treatment was associated with poorer treatment outcomes (Subbaraman et al., 2017).
Table 1. Descriptive Statistics, N (%) or Mean (Standard Deviation), for Study Variables.
| Total Sample (n=1226) | No Opioid Use or Use as Prescribed | Opioid Misuse (n=70) | d | |
|---|---|---|---|---|
| Baseline pain scores | 0.13 (0.73) | 0.12 (0.72) | 0.32 (0.79) | 0.25* |
| Alcohol dependence (ADS) | 16.69 (7.36) | 16.51 (7.29) | 19.56 (8.00) | 0.34** |
| Motivation to change (URICA) | 10.62 (1.53) | 10.62 (1.53) | 10.63 (1.50) | 0.09 |
| Temptation withdrawal (AASE) | 3.11 (0.77) | 3.10 (0.77) | 3.28 (0.79) | 0.10 |
| Confidence (AASE) | 2.61 (0.73) | 2.62 (0.73) | 2.53 (0.70) | 0.13 |
| Psychiatric distress (BSI GSI) | 60.43 (10.71) | 60.22 (10.66) | 63.79 (11.02) | 0.32** |
| Gender Male N (%) | 848 (69.2%) | 794 (68.7%) | 54 (77.1%) | NS |
| Cigarettes per day | 8.23 (11.99) | 8.10 (11.99) | 10.50 (12.61) | 0.21 |
| Cannabis Use N (%) | 504 (41.1%) | 405 (39.7%) | 53 (75.7%) | ** |
| Other Drug Use N (%) | 387 (31.6%) | 297 (29.1%) | 52 (74.3%) | ** |
| Outcomes | ||||
| Percent drinking days | ||||
| Baseline | 74.74 (25.03) | 74.94 (24.98) | 71.51 (25.67) | 0.04 |
| Month 4 | 25.40 (32.73) | 25.11 (32.49) | 30.09 (36.26) | 0.24* |
| Month 16 | 37.01 (38.89) | 36.50 (38.74) | 44.75 (40.60) | 0.20 |
| Drinks per drinking day | ||||
| Baseline | 13.04 (8.14) | 12.98 (8.24) | 14.05 (6.28) | 0.10 |
| Month 4 | 4.62 (5.73) | 4.49 (5.48) | 6.71 (8.61) | 0.39** |
| Month 16 | 5.41 (6.25) | 5.32 (6.23) | 6.74 (6.48) | 0.27* |
| Percent heavy drinking days | ||||
| Baseline | 65.55 (28.49) | 65.47 (28.62) | 66.88 (26.30) | 0.09 |
| Month 4 | 16.05 (27.88) | 15.71 (27.51) | 21.43 (32.99) | 0.30** |
| Month 16 | 29.11 (37.18) | 28.50 (36.90) | 38.46 (40.31) | 0.33** |
| Maximum drinks per day | ||||
| Baseline | 22.36 (14.14) | 22.12 (14.20) | 26.38 (12.52) | 0.25* |
| Month 4 | 6.51 (8.25) | 6.33 (8.06) | 9.45 (10.57) | 0.38** |
| Month 16 | 6.88 (8.07) | 6.69 (7.94) | 9.71 (9.53) | 0.40** |
Note.
p<0.05;
p<0.01 difference between opioid-use groups; NS = not significant; d = Cohen's d; ADS=Alcohol Dependence Scale; URICA=University of Rhode Island Change Assessment, AASE=Alcohol Abstinence Self-Efficacy Scale; BSI GSI=Brief Symptom Inventory Global Severity Index.
Covariates
To adjust for potential confounding variables, we selected covariate measures that have been associated with alcohol treatment outcomes in prior studies (Hendershot et al., 2011; Lowman et al., 1996; Witkiewitz, 2011; Witkiewitz et al., 2015). Covariates included gender, baseline drinking, treatment assignments (CBI versus MM and naltrexone versus placebo naltrexone), scores on the Alcohol Dependence Scale (ADS) (Skinner and Horn, 1984), the University of Rhode Island Change Assessment (URICA) readiness scale (DiClemente and Hughes, 1990), the Alcohol Abstinence Self-Efficacy (AASE) temptation withdrawal scale and confidence/self-efficacy scales (DiClemente et al., 1994), the Brief Symptom Inventory Global Severity Index (BSI) (Derogatis, 1983), and baseline pain as measured by items from the World Health Organization Quality of Life assessment (World Health Organization, 1998) and the Short Form Health Survey (Ware et al., 1996).
Treatment adherence
The number of CBI and MM treatment sessions attended during the treatment period and the percent of adherence to the prescribed dose of naltrexone, acamprosate, or placebo equivalents, as measured by a ratio of pills taken from returned blister packs, were included as measures of treatment adherence (Zweben et al., 2008).
Statistical Analyses
All models were estimated using Mplus version 8 (Muthén and Muthén, 2012) with robust maximum likelihood estimation using a sandwich estimator to adjust standard errors for clustering within research sites. Missing data were accommodated by maximum likelihood (Witkiewitz et al., 2014). Multiple imputation yielded similar results, thus the maximum likelihood estimates are provided for all analyses.
Cox proportional hazards models were used to estimate opioid misuse and cannabis and other drug use as predictors of time-to-first drinking day and time-to-first heavy drinking day. To examine the association between opioid misuse and cannabis and other drug use and drinking outcomes during treatment and following treatment, we conducted latent profile analyses of drinking outcomes (PDD, DDD, PHDD, MXD) during the last month of treatment (month 4) and during the last month of the follow-up (month 16; one year following treatment), with opioid misuse and cannabis and other drug use included as predictors of profiles of drinking at each time point. Latent profile analyses, which estimate latent drinking subgroups during each time period, have previously been shown to accommodate non-normality in AUD treatment outcomes (Witkiewitz, 2008; Witkiewitz et al., 2010).
Consistent with our prior work, we anticipated that a three-profile model: (1) frequent heavy drinking; (2) occasional heavy drinking; and (3) infrequent non-heavy drinking would fit the data best. The best fitting model was determined by the Bayesian Information Criteria (BIC; lower BIC indicates a better model) and the Lo-Mendell-Rubin adjusted likelihood ratio test (LRT; with a significant LRT indicating a better fitting model than one with one less class and a non-significant LRT indicating that a model with one fewer class is preferred). Model entropy, a measure of classification precision, was also examined and a value greater than 0.80 was considered to be acceptable classification precision (Nylund et al., 2007).
Mediation by treatment adherence was tested using Cox hazards models of the survival outcomes and profile models of PDD, DDD, PHDD, and MXD. We used the product-of-coefficients approach where the association between opioid misuse and cannabis and other drug use and treatment adherence, i.e., the “a-path” in a mediation model, and the association between adherence and the outcomes, i.e., the “b-path” in a mediation model, are estimated in the same model. The product-of-coefficients approach with asymmetric confidence limits using RMediation (Tofighi and MacKinnon, 2011) was used to estimate the significance of the indirect effects.
Results
Descriptive statistics for the total sample and stratified by opioid misuse are provided in Table 1. Individuals with opioid misuse had significantly higher pain scores (Cohen's d=.25), alcohol dependence scores (d=.34), and psychiatric distress at baseline (d=.32) than those with no use or use as prescribed. Individuals with opioid misuse were significantly more likely to use cannabis and other drugs (p<0.001), with approximately three-quarters of individuals with opioid misuse also using cannabis and/or other illicit drugs. Individuals with opioid misuse also had significantly greater DDD, PHDD, and MXD at both months 4 and 16 and significantly greater PDD at month 4.
We also examined descriptive differences based on the cannabis and other drug use groups. Specifically, Table 2 shows individuals with opioid misuse had the highest levels of baseline pain, dependence severity, global distress, cigarettes smoked per day, and greater frequency and intensity of drinking during the follow-ups, as compared to all other groups. The four groups did not differ significantly from one another on the frequency of any drinking (PDD) at any time point, however all drug groups had significantly greater intensity of drinking (DDD and MXD) at Month 4 and Month 16 and greater frequency of heavy drinking (PHDD) at Month 4 than the group with no drug use. The opioid misuse group and other drug use group also had significantly greater PHDD at Month 16 than the no drug use group and the cannabis only group.
Table 2. Means (Standard Deviations) of Covariates and Outcomes by Opioid Misuse, Cannabis, and Drug Use Group.
| No Cannabis, Drug, or Opioid Misuse (n=614) | Cannabis Use Only (n=207) | Drug Use With or Without Cannabis Use (n=335) | Opioid Misuse With or Without Cannabis and Drug Use (n=70) | |
|---|---|---|---|---|
| Baseline pain | 0.13 (0.70)a | 0.13 (0.74) a | 0.09 (0.76) a | 0.32 (0.79) a |
| ADS | 15.71 (7.27) a | 17.07 (7.21) a, b | 17.65 (7.23) b | 19.56 (8.00) b |
| URICA | 10.64 (1.55) a | 10.51 (1.59) a | 10.54 (1.46) a | 10.63 (1.50) a |
| Temptation (AASE) | 3.08 (0.76) a | 3.12 (0.73) a | 3.13 (0.79) a | 3.28 (0.79) a |
| Confidence (AASE) | 2.61 (0.73) a | 2.69 (0.69) a | 2.58 (0.77) a | 2.53 (0.70) a |
| BSI GSI | 59.67 (10.46) a | 60.39 (11.13) a, b | 61.12 (10.69) a, b | 63.79 (11.02) b |
| Cigarettes/day | 7.24 (11.83) a | 9.70 (13.09) a | 8.69 (11.31) a | 10.50 (12.61) a |
| Outcomes | ||||
| PDD | ||||
| Baseline | 74.84 (25.73) a | 77.53 (24.37) a | 73.52 (23.90) a | 71.51 (25.67) a |
| Month 4 | 22.64 (31.46) a | 29.08 (34.90) a | 27.24 (32.53) a | 30.09 (36.26) a |
| Month 16 | 35.11 (38.12) a | 37.29 (38.63) a | 38.67 (40.02) a | 44.75 (40.60) a |
| DDD | ||||
| Baseline | 12.30 (8.04) a | 12.44 (6.22) a | 14.56 (9.40) b | 14.05 (6.28) a |
| Month 4 | 3.83 (4.99) a | 5.16 (5.22) b | 5.34 (6.30) b | 6.71 (8.61) b |
| Month 16 | 4.52 (5.55) a | 5.97 (5.96) b | 6.43 (7.34) b | 6.74 (6.48) b |
| PHDD | ||||
| Baseline | 65.04 (28.97) a | 67.37 (28.86) a | 65.09 (27.86) a | 66.88 (26.30) a |
| Month 4 | 12.20 (24.46) a | 19.13 (30.78) b | 20.12 (29.80) b | 21.43 (32.99) b |
| Month 16 | 25.20 (35.22) a | 30.39 (38.01) a | 33.61 (38.76) b | 38.46 (40.31) b |
| MXD | ||||
| Baseline | 20.29 (13.61) a | 21.53 (10.30) a | 25.84 (16.50) b | 26.38 (12.52) b |
| Month 4 | 5.15 (6.65) a | 7.75 (9.27) b | 7.63 (9.23) b | 9.45 (10.57) b |
| Month 16 | 5.40 (6.69) a | 7.69 (7.83) b | 8.53 (9.61) b | 9.71 (9.53) b |
Note. Same subscripts indicate no significant differences between groups and different subscripts indicate significant differences between groups using Analysis of Variance and Tukey's post-hoc comparisons at p<0.05. ADS=Alcohol Dependence Scale; URICA=University of Rhode Island Change Assessment, AASE=Alcohol Abstinence Self-Efficacy Scale; BSI GSI=Brief Symptom Inventory Global Severity Index; PDD=Percent drinking days; DDD=drinks per drinking day; PHDD=percent heavy drinking days; MXD=maximum drinks on a drinking day.
Cannabis and Other Drug Use, Opioid Misuse, and Time to First Lapse
As seen in Table 3, opioid misuse predicted a 38% greater odds of heavy drinking during treatment (OR=1.38, p=0.001; see Figure 1 for survival curve), but not time to any drinking day (OR=1.27, p=0.06). Cannabis use only predicted a 19% greater odds of heavy drinking (OR=1.19, p=0.01) and other drug use predicted a 20% greater odds of heavy drinking (OR=1.20, p=0.01). Cannabis use only predicted a 29% greater odds of any drinking (OR=1.29, p<0.001) and other drug use predicted a 23% greater odds of any drinking (OR=1.23, p=0.007). Average time-to-first heavy drinking day and time-to-first any drinking day was 125 and 91 days for individuals without drug use, respectively (SD=174 and SD=154), 100 and 63 days among those with cannabis use only, respectively (SD = 163 and SD = 131), 98 and 64 days among those with other drug use, respectively (SD=152 and SD=121), and 77 and 62 days among those with opioid misuse, respectively (SD=141 and SD=126).
Table 3. Results from Cox Regression Models with Covariates.
| Time-to-first drinking day | Time-to-first heavy drinking day | |||
|---|---|---|---|---|
| OR (95% CI) | B (SE) | OR (95% CI) | B (SE) | |
| Baseline opioid use (misuse=1) | 1.266 (0.960, 1.573) | 0.24 (.12) | 1.384 (1.127, 1.641) | 0.33 (.09)** |
| Baseline drug use (use = 1) | 1.234 (1.046, 1.421) | 0.21 (.08)** | 1.202 (1.040, 1.365) | 0.18 (0.07)** |
| Baseline cannabis use (use=1) | 1.289 (1.112, 1.467) | 0.25 (.07)** | 1.194 (1.030, 1.359) | 0.18 (0.07)* |
| Baseline pain scores | 0.985 (0.902, 1.068) | -0.02 (.04) | 1.044 (0.960, 1.128) | 0.04 (.04) |
| Baseline percent drinking/heavy drinking days | 0.997 (0.995, 1.000) | -0.003 (.001) | 0.997 (0.994, 1.000) | -0.003 (.002) |
| Alcohol dependence severity (ADS) | 0.989 (0.980, 0.997) | -0.01 (.004)* | 1.005 (0.994, 1.015) | 0.01 (.006) |
| Motivation to change (URICA) | 0.938 (0.898, 0.979) | -0.06 (.02)* | 0.944 (0.896, 0.991) | -0.06 (.03)* |
| Temptation (AASE-Withdrawal temptation) | 1.025 (0.944, 1.106) | 0.03 (.04) | 1.021 (0.945, 1.098) | 0.02 (.04) |
| Self-efficacy (AASE-Confidence) | 0.910 (0.836, 0.984) | -0.09 (.04)* | 0.883 (0.797, 0.971) | -0.12 (.05)* |
| Psychiatric distress (BSI GSI) | 1.006 (0.999, 1.014) | 0.006 (.004) | 1.001 (0.991, 1.010) | 0.001 (.005) |
| Therapy (Combined behavioral intervention=1) | 0.967 (0.876, 1.058) | -0.03 (.05) | 0.991 (0.854, 1.128) | -0.009 (.07) |
| Medication (Naltrexone=1) | 0.948 (0.860, 1.035) | -0.05 (.05) | 0.906 (0.826, 0.987) | -0.10 (.05)* |
| Gender (Male=1) | 0.753 (0.662, 0.845) | -0.28 (.06)** | 0.826 (0.728, 0.923) | -0.19 (.06)** |
| Cigarettes per day | 1.003 (0.999, 1.008) | 0.003 (.02) | 1.007 (1.002, 1.012) | 0.01 (0.003)* |
Note.
p<0.05;
p<0.01; OR (95% CI)=odds ratio (95% Confidence Interval); B=unstandardized regression coefficient (SE=Standard Error); ADS=Alcohol Dependence Scale; URICA=University of Rhode Island Change Assessment, AASE=Alcohol Abstinence Self-Efficacy Scale; BSI GSI=Brief Symptom Inventory Global Severity Index.
Figure 1.
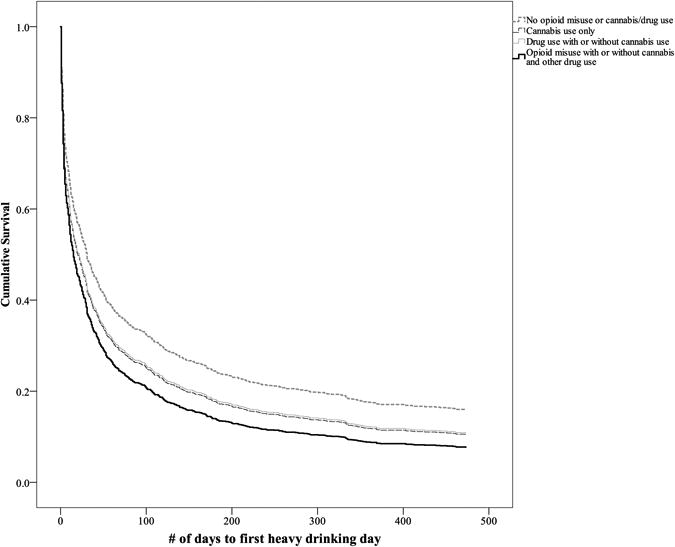
Survival model of time-to-first heavy drinking day among individuals with no drug use, cannabis use only, drug use, and opioid misuse.
Cannabis and Other Drug Use, Opioid Misuse, and Alcohol Consumption During Treatment
Consistent with our prior studies (Witkiewitz, 2008; Witkiewitz et al., 2010), we found that three latent drinking profiles fit the data best at the end of treatment (Month 4). The BIC was lower for the three-profile model (BIC=33047.361) than the two-profile model (BIC=34012.103), and the adjusted LRT indicated that the four-profile model did not fit significantly better than the three-profile model (LRT=753.14, p=0.48). Entropy of the three-profile model was 0.964. Based on the average drinking rates within each of the three profiles (Table 4), we defined the profiles as (1) frequent heavy drinking; (2) occasional heavy drinking; and (3) infrequent drinking. Latent profile probabilities, shown in Table 3, represent the probability of being classified in each profile based on the estimated model. For example, 73.2% of participants were most likely classified in the infrequent drinking profile (profile 3).
Table 4. Mean Drinking Outcomes, Approximate Profile Size (N), and Profile Probabilities from the Latent Profile Analyses.
| Month 4 | Month 16 | ||||||
|---|---|---|---|---|---|---|---|
| Profile 1 | Profile 2 | Profile 3 | Profile 1 | Profile 2 | Profile 3 | ||
| Profile Size N (%) | 111 (10%) | 185 (16.8%) | 811 (73.2%) | Profile Size N (%) | 213 (22.4%) | 200 (21.0%) | 540 (56.6%) |
| Mean PDD | 92.12% | 45.75% | 11.73% | Mean PDD | 93.22% | 43.91% | 12.18% |
| Mean DDD | 11.86 | 9.63 | 2.51 | Mean DDD | 10.20 | 10.16 | 1.77 |
| Mean PHDD | 89.12% | 33.50% | 2.26% | Mean PHDD | 90.99% | 35.88% | 2.00% |
| Mean MXD | 17.29 | 13.99 | 3.34 | Mean MXD | 13.05 | 13.34 | 2.08 |
Note. Mean Drinking within profiles=the average rate of drinking frequency and intensity by latent profiles, with PDD=Percent drinking days; DDD=drinks per drinking day; PHDD=percent heavy drinking days; MXD=maximum drinks on a drinking day. Profile 1=Frequent heavy drinking profile; Profile 2=Occasional heavy drinking profile; Profile 3=Infrequent drinking profile. N (%)= number and percent of individuals most likely classified in each profile based on estimated posterior probabilities. All models adjusted for covariates, including gender, cigarettes per day, opioid misuse and cannabis and other drug use, baseline drinking, treatment assignments (CBI versus MM and naltrexone versus placebo naltrexone), scores on the Alcohol Dependence Scale (ADS) (Skinner and Horn, 1984), the University of Rhode Island Change Assessment (URICA) readiness scale (DiClemente and Hughes, 1990), the Alcohol Abstinence Self-Efficacy (AASE) temptation withdrawal scale and confidence/self-efficacy scales (DiClemente et al., 1994), the Brief Symptom Inventory Global Severity Index (BSI) (Derogatis, 1983), and baseline pain as measured by items from the World Health Organization Quality of Life assessment (World Health Organization, 1998) and the Short Form Health Survey (Ware et al., 1996).
Controlling for covariates, opioid misuse, cannabis use only, and other drug use significantly predicted latent profile membership, such that individuals with opioid misuse, cannabis use only, and other drug use were significantly more likely to be in the heaviest drinking profile (profile 1) than in the infrequent drinking profile (Table 5a). Odds of being in the heaviest drinking profile versus the infrequent drinking profile were 2.9 times greater for those with opioid misuse and 2.4 times greater for those with cannabis use only and other drug use. Individuals with opioid misuse were also significantly more likely to be in the heaviest drinking profile versus the occasional heavy drinking profile (Table 5b).
Table 5a. Analyses of Opioid Misuse as a Predictor of Latent Drinking Profiles at the End of Treatment (Month 4), with Infrequent Drinking (Profile 3) as the Reference Class.
| Frequent Heavy Drinking Profile Month 4 | OR | B (SE) |
|---|---|---|
| Baseline opioid use (misuse = 1) | 2.90 | 1.07 (0.36)** |
| Baseline drug use (use = 1) | 2.36 | 0.86 (0.29)** |
| Baseline cannabis use (use = 1) | 2.35 | 0.86 (0.26)** |
| Baseline pain scores | 1.07 | 0.07 (0.14) |
| Baseline percent heavy drinking days | 1.03 | 0.03 (0.005)** |
| Baseline maximum drinks | 0.99 | -0.001 (0.01) |
| Alcohol dependence severity (ADS) | 1.02 | 0.02 (0.02) |
| Motivation to change (URICA) | 0.96 | -0.05 (0.07) |
| Temptation (AASE-Withdrawal temptation) | 0.83 | -0.18 (0.15) |
| Self-efficacy (AASE-Confidence) | 0.88 | -0.12 (0.23) |
| Psychiatric distress (BSI GSI) | 1.002 | 0.002 (0.02) |
| Therapy (Combined behavioral intervention=1) | 0.68 | -0.42 (0.22) |
| Medication (Naltrexone=1) | 0.56 | -0.58 (0.19)** |
| Gender (Male=1) | 0.71 | -0.34 (0.30) |
| Cigarettes per day | 1.01 | 0.01 (0.007) |
|
| ||
| Occasional Heavy Drinking Profile Month 4 | OR | B (SE) |
|
| ||
| Baseline opioid use (misuse=1) | 0.99 | -0.12 (0.33) |
| Baseline drug use (use = 1) | 2.10 | 0.74 (0.18)** |
| Baseline cannabis use (use = 1) | 1.42 | 0.35 (0.25) |
| Baseline pain scores | 1.16 | 0.15 (0.13) |
| Baseline percent heavy drinking days | 1.00 | 0.000 (0.01) |
| Baseline maximum drinks | 0.99 | -0.007 (0.01) |
| Alcohol dependence severity (ADS) | 1.02 | 0.02 (0.01)* |
| Motivation to change (URICA) | 0.89 | -0.11 (0.08) |
| Temptation (AASE-Withdrawal temptation) | 0.90 | -0.11 (0.13) |
| Self-efficacy (AASE-Confidence) | 0.65 | -0.43 (0.17)* |
| Psychiatric distress (BSI GSI) | 1.01 | 0.01 (0.01) |
| Therapy (Combined behavioral intervention=1) | 0.75 | -0.29 (0.18) |
| Medication (Naltrexone=1) | 0.64 | -0.45 (0.15)** |
| Gender (Male=1) | 1.01 | 0.01 (0.18) |
| Cigarettes per day | 1.01 | 0.01 (0.01) |
Note.
p<0.05;
p<0.01;
reference class is Class 3, infrequent drinking class; OR=odds ratio; B=unstandardized regression coefficient (SE=Standard Error)
Table 5b. Analyses of Opioid Misuse as a Predictor of Latent Drinking Profiles at the End of Treatment (Month 4), with Occasional Heavy Drinking (Profile 2) as the Reference Class.
| Frequent Heavy Drinking Profile Month 4 | OR | B (SE) |
|---|---|---|
| Baseline opioid use (Misuse=1) | 2.94 | 1.08 (0.39)** |
| Baseline drug use (Use = 1) | 1.13 | 0.12 (0.22) |
| Baseline cannabis use (Use = 1) | 1.67 | 0.51 (0.31) |
| Baseline pain scores | 0.92 | -0.08 (0.22) |
| Baseline percent heavy drinking days | 1.03 | 0.03 (0.005)** |
| Baseline maximum drinks | 1.01 | 0.006 (0.01) |
| Alcohol dependence severity (ADS) | 0.99 | -0.003 (0.02) |
| Motivation to change (URICA) | 1.07 | 0.07 (0.11) |
| Temptation (AASE-Withdrawal temptation) | 0.92 | -0.08 (0.21) |
| Self-efficacy (AASE-Confidence) | 1.35 | 0.30 (0.26) |
| Psychiatric distress (BSI GSI) | 0.99 | -0.01 (0.01) |
| Therapy (Combined behavioral intervention=1) | 0.88 | -0.13 (0.26) |
| Medication (Naltrexone=1) | 0.88 | -0.13 (0.26) |
| Gender (Male=1) | 0.70 | -0.35 (0.25) |
| Cigarettes per day | 1.00 | 0.00 (0.011) |
Note.
p<0.05;
p<0.01; OR=Odds ratio; B=unstandardized regression coefficient (SE=Standard Error)
Cannabis, and Other Drug Use, Opioid Misuse, and Alcohol Consumption Following Treatment
At the one-year follow-up (Month 16), the BIC was lower for the three-profile model (BIC=29282.517) than the two-profile model (BIC=30121.429), and the adjusted LRT indicated that the four-profile model did not fit significantly better than the three-profile model (LRT=690.44, p=0.32). Entropy of the three-profile model was 0.957. Controlling for covariates, we defined the profiles as: (1) frequent heavy drinking; (2) occasional heavy drinking; and (3) infrequent drinking. Latent profile probabilities, shown in Table 4, represent the probability of being classified in each profile based on the estimated model.
Controlling for covariates, opioid misuse and other drug use significantly predicted latent profile membership, such that individuals with opioid misuse and other drug use were significantly more likely to be in the heaviest drinking profile (profile 1) than in the infrequent drinking profile (Table 6a). Odds of being in the heaviest drinking profile versus the infrequent drinking profile were 2.7 times greater for those with opioid misuse and 1.8 times greater for those with other drug use. Opioid misuse did not differentiate membership in the frequent heavy drinking profile from the occasional heavy drinking profile (Table 6b).
Table 6a. Analyses of Opioid Misuse as a Predictor of Latent Drinking Profiles at One Year Following Treatment (Month 16), with Infrequent Drinking (Profile 3) as the Reference Class.
| Frequent heavy drinking profile month 16 | OR | B (SE) |
|---|---|---|
| Baseline opioid use (misuse=1) | 2.66 | 0.98 (0.38)* |
| Baseline drug use (use = 1) | 1.83 | 0.60 (0.21)** |
| Baseline cannabis use (use = 1) | 1.33 | 0.29 (0.27) |
| Baseline pain scores | 1.10 | 0.10 (0.14) |
| Baseline percent heavy drinking days | 1.03 | 0.03 (0.004)** |
| Baseline maximum drinks | 0.99 | -0.02 (0.01) |
| Alcohol dependence severity (ADS) | 0.98 | -0.02 (0.01) |
| Motivation to change (URICA) | 0.99 | -0.01 (0.07) |
| Temptation (AASE-Withdrawal temptation) | 0.99 | -0.01 (0.12) |
| Self-efficacy (AASE-Confidence) | 0.84 | -0.17 (0.10) |
| Psychiatric distress (BSI GSI) | 1.01 | 0.01 (0.01) |
| Therapy (Combined behavioral intervention=1) | 0.95 | -0.06 (0.26) |
| Medication (Naltrexone=1) | 0.78 | -0.25 (0.13) |
| Gender (Male=1) | 0.96 | -0.04 (0.19) |
| Cigarettes per day | 1.01 | 0.01 (0.01) |
|
| ||
| Occasional heavy drinking profile month 16 | OR | B (SE) |
|
| ||
| Baseline opioid use (misuse=1) | 1.21 | 0.19 (0.43) |
| Baseline drug use (use = 1) | 1.63 | 0.49 (0.16)** |
| Baseline cannabis use (use = 1) | 1.34 | 0.29 (0.23) |
| Baseline pain scores | 1.24 | 0.22 (0.11) |
| Baseline percent heavy drinking days | 0.99 | -0.005 (.002)* |
| Baseline maximum drinks | 1.00 | 0.003 (0.005) |
| Alcohol dependence severity (ADS) | 1.01 | 0.01 (0.02) |
| Motivation to change (URICA) | 0.94 | -0.06 (0.07) |
| Temptation (AASE-Withdrawal temptation) | 0.99 | -0.01 (0.11) |
| Self-efficacy (AASE-Confidence) | 0.83 | -0.19 (0.13) |
| Psychiatric distress (BSI GSI) | 1.01 | 0.005 (0.01) |
| Therapy (Combined behavioral intervention=1) | 0.72 | -0.24 (0.23) |
| Medication (Naltrexone=1) | 1.02 | 0.02 (0.12) |
| Gender (Male=1) | 0.72 | -0.34 (0.23) |
| Cigarettes per day | 1.01 | 0.01 (0.01) |
Note.
p<0.05;
p<0.01;
reference class is Class 3, infrequent drinking class; OR=odds ratio; B=unstandardized regression coefficient (SE=Standard Error)
Table 6b. Analyses of Opioid Misuse as a Predictor of Latent Drinking Profiles at One Year Following Treatment (Month 16), with Occasional Heavy Drinking (Profile 2) as the Reference Class.
| Frequent heavy drinking profile month 16 | OR | B (SE) |
|---|---|---|
| Baseline opioid use (misuse=1) | 2.20 | 0.79 (0.51) |
| Baseline drug use (use = 1) | 1.16 | 0.11 (0.20) |
| Baseline cannabis use (use = 1) | 0.99 | -0.004 (0.33) |
| Baseline pain scores | 0.89 | -0.12 (0.18) |
| Baseline percent heavy drinking days | 1.03 | 0.03 (0.003)** |
| Baseline maximum drinks | 0.98 | -0.02 (0.01) |
| Alcohol dependence severity (ADS) | 0.97 | -0.03 (0.02) |
| Motivation to change (URICA) | 1.05 | 0.05 (0.06) |
| Temptation (AASE-Withdrawal temptation) | 1.00 | 0.002 (0.17) |
| Self-efficacy (AASE-Confidence) | 1.02 | 0.016 (0.21) |
| Psychiatric distress (BSI GSI) | 1.00 | 0.002 (0.01) |
| Therapy (Combined behavioral intervention=1) | 1.19 | 0.18 (0.24) |
| Medication (Naltrexone=1) | 0.76 | -0.27 (0.15) |
| Gender (Male=1) | 1.35 | 0.30 (0.18) |
| Cigarettes per day | 1.00 | 0.003 (0.01) |
Note.
p<0.05;
p<0.01; OR=Odds ratio; B=unstandardized regression coefficient (SE=Standard Error)
Adherence as a Mediator of the Association between Opioid Misuse and Outcomes
Descriptive analyses, without adjusting for covariates, indicated that individuals with opioid misuse had significantly lower rates of medication adherence (d=0.43; mean percent adherent (SD)=81.7% (24.7%) than those with no opioid misuse and no cannabis or drug use (mean (SD)=90.8 (15.9), p<0.001). Across all of the drug use groups, individuals with opioid misuse took significantly fewer doses of medication than those with other drug use (mean (SD) = 88.74 (16.5), p=0.02), but did not take significantly fewer doses than those with cannabis use only (mean (SD) = 86.01 (21.04), p=0.31). Those with cannabis use only and other drug use did not differ on adherence (p=0.30). The opioid misuse, cannabis only, and other drug use groups did not differ on attendance at treatment sessions.
We next examined whether medication adherence significantly mediated the associations between opioid misuse and cannabis use only or other drug use and each of the outcomes during alcohol treatment, adjusted for covariates. With respect to the time to first-drinking day and time to first-heavy-drinking day, Cox proportional hazards models were re-estimated with adherence as a mediator of the association between opioid misuse and the hazard odds of lapsing to any drinking and any heavy drinking. Results of the any drinking model indicated that opioid misuse significantly predicted adherence (a-path; B (SE)=-8.94 (2.41), p<0.001), as did cannabis use only (B (SE)=-4.94 (1.73), p=0.004) and other drug use (B (SE) = -2.26 (1.03), p=.028); adherence significantly predicted time to first drinking day (b-path; B (SE)=-0.01 (0.002), p<0.001); and the indirect effects (a*b path) were significant for opioid misuse (indirect = 0.089, 95%CI: 0.037, 0.16), cannabis use only (indirect = 0.049, 95% CI: 0.014, 0.093), and other drug use (indirect=0.023, 95% CI: 0.002, 0.047). For the heavy drinking model, opioid misuse significantly predicted adherence (a-path; B (SE)= -8.94 (2.41), p<0.001), as did cannabis use (B (SE)=-4.94 (1.73), p=0.004), and other drug use (B (SE) = -2.26 (1.03), p=.028); adherence significantly predicted time to first heavy drinking day (b-path; B (SE)=-0.013 (0.002), p<0.001); and the indirect effects (a*b path) were significant for opioid misuse (indirect = 0.116, 95%CI: 0.051, 0.193), cannabis use (indirect = 0.064, 95% CI: 0.019, 0.116), and other drug use (indirect=0.029, 95% CI: 0.003, 0.059).
Latent profile models were estimated with medication adherence as a mediator between opioid misuse and the latent drinking profiles during treatment and at one year following treatment. During treatment (Month 4), opioid misuse significantly predicted adherence (a-path; B (SE)= -9.12 (2.41), p<0.001), as did cannabis use (B (SE) = -5.11 (1.73), p=0.003) and other drug use (B (SE) = -2.33 (1.03), p=0.02; adherence predicted expected membership in the infrequent drinking profile, as compared to the frequent heavy drinking profile (b-path; B (SE)=-0.031 (0.008), p<0.001); and the indirect effects (a*b path) were significant for opioid misuse (indirect = 0.283, 95%CI: 0.103, 0.516), cannabis use only (indirect = 0.158, 95% CI: 0.043, 0.311), and other drug use (indirect=0.072, 95% CI: 0.008, 0.156). Opioid misuse, cannabis use only, and other drug use remained significant predictors of membership in the frequent heavy drinking profile during treatment, as compared to the infrequent heavy drinking profile (p<0.04), with adherence included in the model. Opioid misuse and other drug use each predicted over 2 times greater odds of expected membership in the frequent heavy drinking profile (opioid: OR=2.275, 95% CI: 1.073, 4.822; drug use: OR=2.353, 95% CI: 1.378, 4.022), and cannabis use only predicted 1.9 times greater odds of expected membership in the frequent heavy drinking profile (OR=1.940, 95% CI: 1.059, 3.555).
For the model of alcohol outcomes at one year following treatment (month 16), opioid misuse significantly predicted adherence (a-path; B (SE)=-9.13 (2.42), p<0.001), as did cannabis use only (B (SE) = -5.06 (1.72), p=0.003) and other drug use (B (SE) = -2.31 (1.01), p=0.02; adherence predicted expected membership in the infrequent drinking profile, as compared to the frequent heavy drinking profile (b-path; B (SE)=-0.014 (0.004), p=0.001); and the indirect effects (a*b path) were significant for opioid misuse (indirect = 0.128, 95%CI: 0.043, 0.240), cannabis use only (indirect = 0.071, 95% CI: 0.018, 0.143), and other drug use (indirect=0.032, 95% CI: 0.004, 0.071). Opioid misuse and other drug use (but not cannabis use only) remained significant predictors of membership in the frequent heavy drinking profile at one year following treatment, as compared to the infrequent heavy drinking profile (p<0.03), with adherence included in the model. Opioid misuse predicted over 2.3 times greater odds of expected membership in the frequent heavy drinking profile (OR=2.384, 95% CI: 1.087, 5.229), and other drug use predicted 1.8 times greater odds of expected membership in the frequent heavy drinking profile (OR=1.787, 95% CI: 1.181, 2.706), as compared to the infrequent drinking profile.
Discussion
This study provides evidence that individuals from the COMBINE study who misused opioids, but who did not meet criteria for OUD, and those who used cannabis and other drugs during the baseline period relapsed to heavy drinking and were more likely to drink heavily and frequently during and following treatment, as compared to those who did not misuse opioids or use other drugs. On average, individuals with opioid misuse engaged in heavy drinking 48 days earlier in treatment, drank heavily on approximately 8% and 13% more days in the last month of treatment and one year following treatment, respectively, and consumed 4 more drinks per peak drinking occasion than individuals without opioid misuse and no other drug use. Notably, a number of the effects were clinically significant, with opioid misuse at least doubling the likelihood of reporting a heavy frequent drinking profile, both at the end of treatment (Tables 5a and 5b) and at the one-year follow-up (Table 6a). Pretreatment cannabis use and other drug use were also associated with significantly worse outcomes, however those who reported opioid misuse had the worst outcomes.
The association between opioid misuse, cannabis and other drug use, and alcohol treatment outcomes was partially mediated by lower medication adherence, such that opioid misuse, cannabis use, and other drug use all predicted significantly lower adherence to prescribed medication doses and lower medication adherence predicted significantly worse outcomes. The low rate of adherence among individuals with opioid misuse and cannabis and other drug use is consistent with a literature demonstrating an association between poor medication adherence and alcohol, opioid, and other drug use (Dermody et al., 2018; Jeevanjee et al., 2014; Rosen et al., 2013; Sansone and Sansone, 2008). Although we controlled for psychiatric distress and alcohol dependence severity, it is possible that individuals with AUD and concurrent drug use have a more severe course of illness (characterized by unstable social environments, neurological dysfunction, etc.), which adversely affects both medication adherence during treatment and outcomes following treatment. Clarifying the associations between concurrent drug use and adherence to AUD pharmacotherapies could be an important direction for future research, particularly given that extended-release naltrexone has been recommended as a treatment for individuals with co-occurring AUD and OUD (Arias and Kranzler, 2008), and is approved by the Food and Drug Administration for treating both disorders individually. For patients with opioid misuse who are in treatment for AUD, extended-release, injectable naltrexone could enhance treatment adherence (Connery, 2015).
In the COMBINE study, participants were excluded if they met criteria for OUD, and thus the observed associations between opioid misuse and alcohol treatment outcomes likely represent a lower bound of the impact of problematic opioid use on alcohol treatment outcomes. Individuals were also excluded if they had serious mental illness or medical comorbidities that could interfere with study medications, which reduces the relevance of these data to patients with more complex psychiatric and medical presentations. Relatedly, the COMBINE study was not designed to test hypotheses regarding the role of opioid misuse in alcohol treatment outcomes, and thus sample sizes were small and measurement was suboptimal. The assessment of opioid misuse was based only on self-reported use (i.e., biomarkers of opioid use were not utilized) and did not take into account differences between illicit opioid use (e.g., heroin) and prescription opioid misuse. Furthermore, the COMBINE study was conducted at a time when the frequency of opioid use, prescribed and illicit, was increasing substantially in the United States (Compton and Volkow, 2006). Thus, we cannot determine how the increased frequency of opioid use may have impacted the number of individuals in treatment for AUD who were using opioids or the impact of that use. It is, therefore, important to replicate these analyses in a contemporary sample.
Given the increasing rates of opioid misuse in the general population (Compton and Volkow, 2006; Saha et al., 2016) and high rates of comorbidity between opioid misuse and AUD (Hughes et al., 2016; Saha et al., 2016), it is critical for future research to examine opioid misuse among AUD populations (Witkiewitz and Vowles, 2018). Specifically, future research is needed to test the effects of the use of opioids on alcohol treatment outcomes, including considering differences between prescription opioid and heroin use and the use of opioids as prescribed vs. misuse vs. the presence of opioid use disorder (OUD). Targeted recruitment of individuals with comorbid AUD and OUD or individuals with AUD who are misusing opioids would provide a better test of the association between opioid misuse and alcohol relapse risk.
Results of this study have important implications for AUD treatment. Models of alcohol relapse have not considered opioid misuse as a relapse trigger (Connors et al., 1996; Greenfield et al., 2000; Sinha and Li, 2007; Witkiewitz, 2011; Witkiewitz and Marlatt, 2004), yet in the current study opioid misuse was the most prominent predictor of heavy drinking lapses, and was strongly associated with the probability of being a frequent heavy drinker both during and after treatment. Despite the limitations in measurement, the observed effects were sizeable and persisted through one year following treatment. These findings strongly suggest that clinicians treating AUD should assess opioid misuse and cannabis and other drug use as potential barriers to medication adherence and potential relapse triggers. Among patients with AUD and opioid misuse or cannabis and other drug use, clinicians should address the co-use of other substances and carefully monitor treatment adherence.
Acknowledgments
Funding: This research was supported by grants funded by the National Institutes of Health R01 AA022328 and R01 AA025539 (Witkiewitz, PI) and R34 AT08398 (Vowles, PI). The content is solely the responsibility of the authors and does not necessarily reflect the views of NIH.
Footnotes
Disclosures: Dr. Kranzler has been a consultant, advisory group member, or continuing medical education lecturer for Alkermes, Indivior, and Lundbeck. Drs. Witkiewitz and Kranzler are members of the American Society of Clinical Psychopharmacology's Alcohol Clinical Trials Initiative (ACTIVE), which in the last three years was supported by AbbVie, Alkermes, Amygdala Neurosciences, Arbor, Ethypharm, Indivior, Lilly, Lundbeck, Otsuka, and Pfizer.
References
- Anton RF, O'Malley SS, Ciraulo DA, Cisler RA, Couper D, Donovan DM, Gastfriend DR, Hosking JD, Johnson BA, LoCastro JS, Longabaugh R, Mason BJ, Mattson ME, Miller WR, Pettinati HM, Randall CL, Swift R, Weiss RD, Williams LD, Zweben A. Combined pharmacotherapies and behavioral interventions for alcohol dependence: the COMBINE study: a randomized controlled trial. JAMA. 2006;295:2003–17. doi: 10.1001/jama.295.17.2003. [DOI] [PubMed] [Google Scholar]
- Arias AJ, Kranzler HR. Treatment of co-occurring alcohol and other drug use disorders. Alcohol Res Heal. 2008;31:155–67. [PMC free article] [PubMed] [Google Scholar]
- Birke H, Kurita GP, Sjøgren P, Højsted J, Simonsen MK, Juel K, Ekholm O. Chronic non-cancer pain and the epidemic prescription of opioids in the Danish population: trends from 2000 to 2013. Acta Anaesthesiol Scand. 2016;60:623–633. doi: 10.1111/aas.12700. [DOI] [PubMed] [Google Scholar]
- Bogdanowicz KM, Stewart R, Broadbent M, Hatch SL, Hotopf M, Strang J, Hayes RD. Double trouble: Psychiatric comorbidity and opioid addiction—All-cause and cause-specific mortality. Drug Alcohol Depend. 2015;148:85–92. doi: 10.1016/j.drugalcdep.2014.12.025. [DOI] [PubMed] [Google Scholar]
- Centers for Disease Control and Prevention (CDC) Excessive Drinking is Draining the US Economy. Washington, D.C: 2016. [Google Scholar]
- Clarke JL, Skoufalos A, Scranton R. The American Opioid Epidemic: Population Health Implications and Potential Solutions. Report from the National Stakeholder Panel. Popul Health Manag. 2016;19:S-1–S-10. doi: 10.1089/pop.2015.0144. [DOI] [PubMed] [Google Scholar]
- COMBINE Study Group. Testing combined pharmacotherapies and behavioral interventions in alcohol dependence: rationale and methods. Alcohol Clin Exp Res. 2003;27:1107–22. doi: 10.1097/00000374-200307000-00011. [DOI] [PubMed] [Google Scholar]
- Compton WM, Jones CM, Baldwin GT. Relationship between Nonmedical Prescription-Opioid Use and Heroin Use. N Engl J Med. 2016;374:154–163. doi: 10.1056/NEJMra1508490. [DOI] [PubMed] [Google Scholar]
- Compton WM, Volkow ND. Major increases in opioid analgesic abuse in the United States: concerns and strategies. Drug Alcohol Depend. 2006;81:103–7. doi: 10.1016/j.drugalcdep.2005.05.009. [DOI] [PubMed] [Google Scholar]
- Connery HS. Medication-assisted treatment of opioid use disorder: review of the evidence and future directions. Harv Rev Psychiatry. 2015;23:63–75. doi: 10.1097/HRP.0000000000000075. [DOI] [PubMed] [Google Scholar]
- Connors GJ, Maisto SA, Donovan DM. Conceptualizations of relapse: A summary of psychological and psychobiological models. Addiction. 1996;91:S5–S13. doi: 10.1111/j.1360-0443.1996.tb02323.x. [DOI] [PubMed] [Google Scholar]
- Dermody SS, Wardell JD, Stoner SA, Hendershot CS. Predictors of Daily Adherence to Naltrexone for Alcohol Use Disorder Treatment During a Mobile Health Intervention. Ann Behav Med. 2018 doi: 10.1093/abm/kax053. [DOI] [PMC free article] [PubMed] [Google Scholar]
- Derogatis LR. The Brief Symptom Inventory: An introductory report. Psychol Med A J Res Psychiatry Allied Sci. 1983;13:595–605. doi: 10.1017/S0033291700048017. [DOI] [PubMed] [Google Scholar]
- DiClemente CC, Carbonari JP, Montgomery RP, Hughes SO. The Alcohol Abstinence Self-Efficacy scale. J Stud Alcohol. 1994;55:141–8. doi: 10.15288/jsa.1994.55.141. [DOI] [PubMed] [Google Scholar]
- DiClemente CC, Hughes SO. Stages of change profiles in outpatient alcoholism treatment. J Subst Abuse. 1990;2:217–35. doi: 10.1016/s0899-3289(05)80057-4. [DOI] [PubMed] [Google Scholar]
- Edwards KA, Vowles KE, Witkiewitz K. Co-use of Alcohol and Opioids. Curr Addict Reports. 2017;4:194–199. doi: 10.1007/s40429-017-0147-x. [DOI] [Google Scholar]
- First MB, Spitzer RL, Gibbon M, Williams JBW. Structured Clinical Interview for DSM-IV Axis I Disorders. American Psychiatric Press, Inc; Washington, D.C: 1996. [Google Scholar]
- Florence CS, Zhou C, Luo F, Xu L. The economic burden of prescription opioid overdose, abuse, and dependence in the United States, 2013. Med Care. 2016;54:901–906. doi: 10.1097/MLR.0000000000000625. [DOI] [PMC free article] [PubMed] [Google Scholar]
- Friedmann PD, Wilson D, Nunes EV, Hoskinson R, Lee JD, Gordon M, Murphy SM, Bonnie RJ, Chen DT, Boney TY, O'Brien CP. Do patient characteristics moderate the effect of extended-release naltrexone (XR-NTX) for opioid use disorder? J Subst Abuse Treat. 2017 doi: 10.1016/j.jsat.2017.01.018. [DOI] [PMC free article] [PubMed] [Google Scholar]
- Grant BF, Chou SP, Saha TD, Pickering RP, Kerridge BT, Ruan WJ, Huang B, Jung J, Zhang H, Fan A, Hasin DS. Prevalence of 12-Month Alcohol Use, High-Risk Drinking, and DSM-IV Alcohol Use Disorder in the United States, 2001-2002 to 2012-2013. JAMA Psychiatry. 2017 doi: 10.1001/jamapsychiatry.2017.2161. [DOI] [PMC free article] [PubMed] [Google Scholar]
- Greenfield SF, Hufford MR, Vagge LM, Muenz LR, Costello ME. The relationship of self-efficacy expectancies to relapse among alcohol dependent men and women: A prospective study. J Stud Alcohol. 2000;61:345–351. doi: 10.15288/jsa.2000.61.345. doi:ISSN:0096-882X. [DOI] [PubMed] [Google Scholar]
- Hamunen K, Paakkari P, Kalso E. Trends in opioid consumption in the Nordic countries 2002-2006. Eur Jounal Pain. 2009;13:954–962. doi: 10.1016/j.ejpain.2008.11.006. [DOI] [PubMed] [Google Scholar]
- Hendershot CS, Witkiewitz K, George WH, Marlatt GA. Relapse prevention for addictive behaviors. Subst Abuse Treat Prev Policy. 2011;6:17. doi: 10.1186/1747-597X-6-17. [DOI] [PMC free article] [PubMed] [Google Scholar]
- Hughes A, Williams MR, Lipari RN, Bose J, Copello EAP, Kroutil LA. Prescription drug use and misuse in the United States: Results from the 2015 National Survey on Drug Use and Health. Washington, D.C: 2016. [Google Scholar]
- Humphreys K. Avoiding globalisation of the prescription opioid epidemic. Lancet. 2017;390:437–439. doi: 10.1016/S0140-6736(17)31918-9. [DOI] [PubMed] [Google Scholar]
- Jeevanjee S, Penko J, Guzman D, Miaskowski C, Bangsberg DR, Kushel MB. Opioid analgesic misuse is associated with incomplete antiretroviral adherence in a cohort of HIV-infected indigent adults in San Francisco. AIDS Behav. 2014;18:1352–1358. doi: 10.1007/s10461-013-0619-5. [DOI] [PMC free article] [PubMed] [Google Scholar]
- Jones CM. Heroin use and heroin use risk behaviors among nonmedical users of prescription opioid pain relievers - United States, 2002-2004 and 2008-2010. Drug Alcohol Depend. 2013;132:95–100. doi: 10.1016/j.drugalcdep.2013.01.007. [DOI] [PubMed] [Google Scholar]
- Jones CM, Logan J, Gladden RM, Bohm MK. Vital Signs: Demographic and Substance Use Trends Among Heroin Users - United States, 2002-2013. MMWR Morb Mortal Wkly Rep. 2015;64:719–25. [PMC free article] [PubMed] [Google Scholar]
- Jones CM, Paulozzi LJ, Mack KA Centers for Disease Control and Prevention (CDC) Alcohol involvement in opioid pain reliever and benzodiazepine drug abuse-related emergency department visits and drug-related deaths - United States, 2010. MMWR Morb Mortal Wkly Rep. 2014;63:881–5. [PMC free article] [PubMed] [Google Scholar]
- Kovitwanichkanont T, Day CA. Prescription Opioid Misuse and Public Health Approach in Australia. Subst Use Misuse. 2017:1–6. doi: 10.1080/10826084.2017.1305415. [DOI] [PubMed] [Google Scholar]
- Lowman C, Allen J, Stout RL. Replication and extension of Marlatt's taxonomy of relapse precipitants: overview of procedures and results. The Relapse Research Group Addiction. 1996;91 Suppl:S51–71. [PubMed] [Google Scholar]
- Manchikanti L, Helm S, Fellows B, Janata JW, Pampati V, Grider JS, Boswell MV. Opioid epidemic in the United States. Pain Physician. 2012;15:ES9–E38. [PubMed] [Google Scholar]
- McLellan AT, Lewis DC, O'Brien CP, Kleber HD. Drug dependence, a chronic medical illness: implications for treatment, insurance, and outcomes evaluation. JAMA. 2000;284:1689–95. doi: 10.1001/jama.284.13.1689. [DOI] [PubMed] [Google Scholar]
- Miller WR. In: Form 90: A structured assessment interview for drinking and related behaviors. Project MA, editor. National Institute on Alcohol Abuse and Alcoholism; Bethesda, MD: 1996. [Google Scholar]
- Muthén LK, Muthén BO. Mplus users guide Version 7) 2012 [Google Scholar]
- Nylund KL, Asparouhov T, Muthén BO. Deciding on the number of classes in latent class analysis and growth mixture modeling: A Monte Carlo simulation study. Struct Equ Model. 2007;14:535–569. [Google Scholar]
- Rosen MI, Black AC, Arnsten JH, Goggin K, Remien RH, Simoni JM, Golin CE, Bangsberg DR, Liu H. Association between use of specific drugs and antiretroviral adherence: findings from MACH 14. AIDS Behav. 2013;17:142–7. doi: 10.1007/s10461-011-0124-7. [DOI] [PMC free article] [PubMed] [Google Scholar]
- Roux P, Lions C, Michel L, Cohen J, Mora M, Marcellin F, Spire B, Morel A, Carrieri PM, Karila L ANRS Methaville Study Group. Predictors of non-adherence to methadone maintenance treatment in opioid-dependent individuals: implications for clinicians. Curr Pharm Des. 2014;20:4097–105. doi: 10.2174/13816128113199990623. [DOI] [PubMed] [Google Scholar]
- Rudd RA, Aleshire N, Zibbell JE, Gladden RM. Increases in Drug and Opioid Overdose Deaths - United States, 2000-2014. MMWR Morb Mortal Wkly Rep. 2016;64:1378–82. doi: 10.15585/mmwr.mm6450a3. [DOI] [PubMed] [Google Scholar]
- Saha TD, Kerridge BT, Goldstein RB, Chou SP, Zhang H, Jung J, Pickering RP, Ruan WJ, Smith SM, Huang B, Hasin DS, Grant BF. Nonmedical Prescription Opioid Use and DSM-5 Nonmedical Prescription Opioid Use Disorder in the United States. J Clin Psychiatry. 2016;77:772–780. doi: 10.4088/JCP.15m10386. [DOI] [PMC free article] [PubMed] [Google Scholar]
- Sansone RA, Sansone LA. Alcohol/Substance misuse and treatment nonadherence: fatal attraction. Psychiatry. 2008;5:43–6. [PMC free article] [PubMed] [Google Scholar]
- Schepis TS, Hakes JK. Age of initiation, psychopathology, and other substance use are associated with time to use disorder diagnosis in persons using opioids nonmedically. Subst Abus. 2017;38:407–413. doi: 10.1080/08897077.2017.1356791. [DOI] [PMC free article] [PubMed] [Google Scholar]
- Sinha R, Li CSR. Imaging stress- and cue-induced drug and alcohol craving: association with relapse and clinical implications. Drug Alcohol Rev. 2007;26:25–31. doi: 10.1080/09595230601036960. [DOI] [PubMed] [Google Scholar]
- Skinner HA, Horn JL. Alcohol Dependence Scale (ADS) user's guide. Addiction Research Foundation; Toronto: 1984. [Google Scholar]
- Soyka M. Alcohol Use Disorders in Opioid Maintenance Therapy: Prevalence, Clinical Correlates and Treatment. Eur Addict Res. 2015;21:78–87. doi: 10.1159/000363232. [DOI] [PubMed] [Google Scholar]
- Srivastava A, Kahan M, Ross S. The effect of methadone maintenance treatment on alcohol consumption: A systematic review. J Subst Abuse Treat. 2008;34:215–223. doi: 10.1016/j.jsat.2007.04.001. [DOI] [PubMed] [Google Scholar]
- Tofighi D, MacKinnon DP. RMediation: an R package for mediation analysis confidence intervals. Behav Res Methods. 2011;43:692–700. doi: 10.3758/s13428-011-0076-x. [DOI] [PMC free article] [PubMed] [Google Scholar]
- Tonigan JS, Beatty GK. Twelve-step program attendance and polysubstance use: interplay of alcohol and illicit drug use. J Stud Alcohol Drugs. 2011;72:864–71. doi: 10.15288/jsad.2011.72.864. [DOI] [PMC free article] [PubMed] [Google Scholar]
- Volkow ND, Collins FS. The Role of Science in Addressing the Opioid Crisis. N Engl J Med. 2017;377:391–394. doi: 10.1056/NEJMsr1706626. [DOI] [PubMed] [Google Scholar]
- Ware JE, Kosinski M, Keller SD. A 12-Item Short-Form Health Survey: construction of scales and preliminary tests of reliability and validity. Med Care. 1996;34:220–33. doi: 10.1097/00005650-199603000-00003. [DOI] [PubMed] [Google Scholar]
- Witkiewitz K. Predictors of heavy drinking during and following treatment. Psychol Addict Behav. 2011;25:426–38. doi: 10.1037/a0022889. [DOI] [PMC free article] [PubMed] [Google Scholar]
- Witkiewitz K. Lapses following alcohol treatment: modeling the falls from the wagon. J Stud Alcohol Drugs. 2008;69:594–604. doi: 10.15288/jsad.2008.69.594. [DOI] [PMC free article] [PubMed] [Google Scholar]
- Witkiewitz K, Falk DE, Kranzler HR, Litten RZ, Hallgren KA, O'Malley SS, Anton RF. Methods to analyze treatment effects in the presence of missing data for a continuous heavy drinking outcome measure when participants drop out from treatment in alcohol clinical trials. Alcohol Clin Exp Res. 2014;38:2826–34. doi: 10.1111/acer.12543. [DOI] [PMC free article] [PubMed] [Google Scholar]
- Witkiewitz K, Maisto SA, Donovan DM. A comparison of methods for estimating change in drinking following alcohol treatment. Alcohol Clin Exp Res. 2010;34:2116–2125. doi: 10.1111/j.1530-0277.2010.01308.x. [DOI] [PMC free article] [PubMed] [Google Scholar]
- Witkiewitz K, Marlatt GA. Relapse prevention for alcohol and drug problems: That was Zen, this is Tao. Am Psychol. 2004;59:224–235. doi: 10.1037/0003-066X.59.4.224. [DOI] [PubMed] [Google Scholar]
- Witkiewitz K, McCallion EA, Vowles KE, Kirouac M, Frohe T, Maisto SA, Hodgson R, Heather N. Association between physical pain and alcohol treatment outcomes: The mediating role of negative affect. J Consult Clin Psychol. 2015;83:1044–57. doi: 10.1037/ccp0000033. [DOI] [PMC free article] [PubMed] [Google Scholar]
- Witkiewitz K, Vowles KE. Alcohol and Opioid Use, Co-Use, and Chronic Pain in the Context of the Opioid Epidemic: A Critical Review. Alcohol Clin Exp Res. 2018 doi: 10.1111/acer.13594. [DOI] [PMC free article] [PubMed] [Google Scholar]
- World Health Organization. World Health Organization Quality of Life. World Health Organization; Geneva, Switzerland: p. 1998. [Google Scholar]
- Zweben A, Pettinati HM, Weiss RD, Youngblood M, Cox CE, Mattson ME, Gorroochurn P, Ciraulo D. Relationship between medication adherence and treatment outcomes: the COMBINE study. Alcohol Clin Exp Res. 2008;32:1661–9. doi: 10.1111/j.1530-0277.2008.00743.x. [DOI] [PMC free article] [PubMed] [Google Scholar]