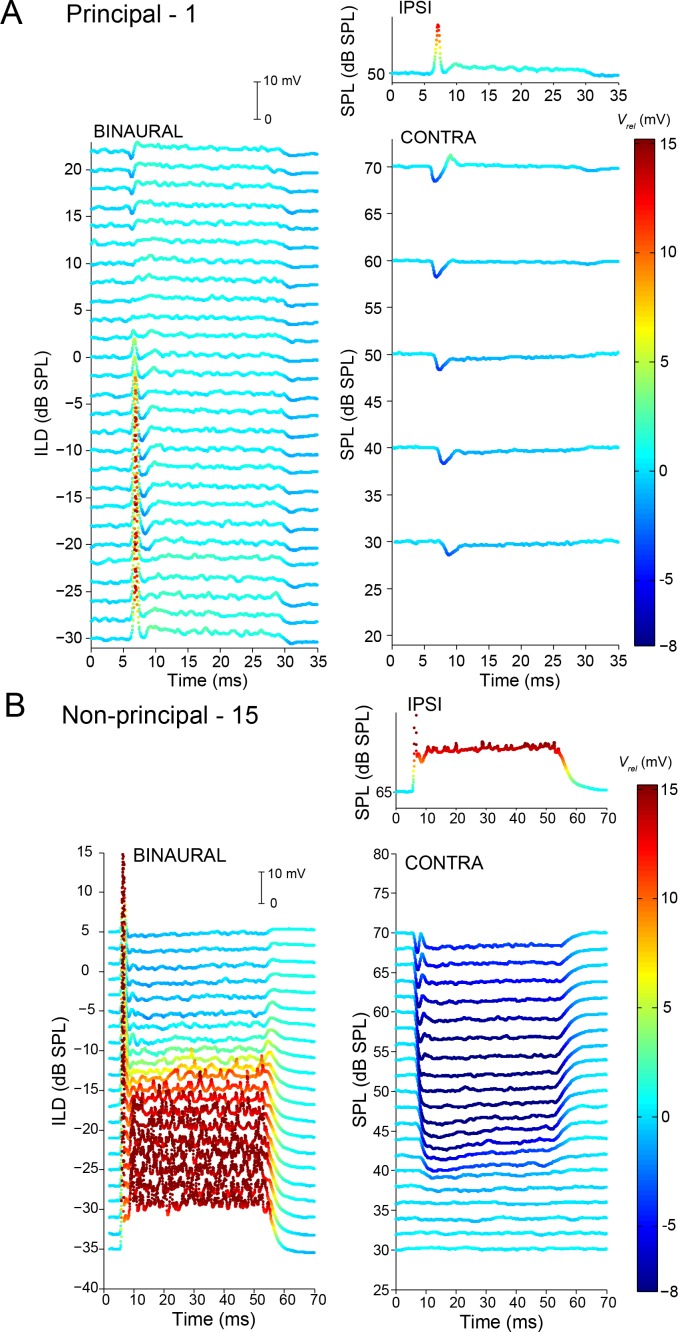
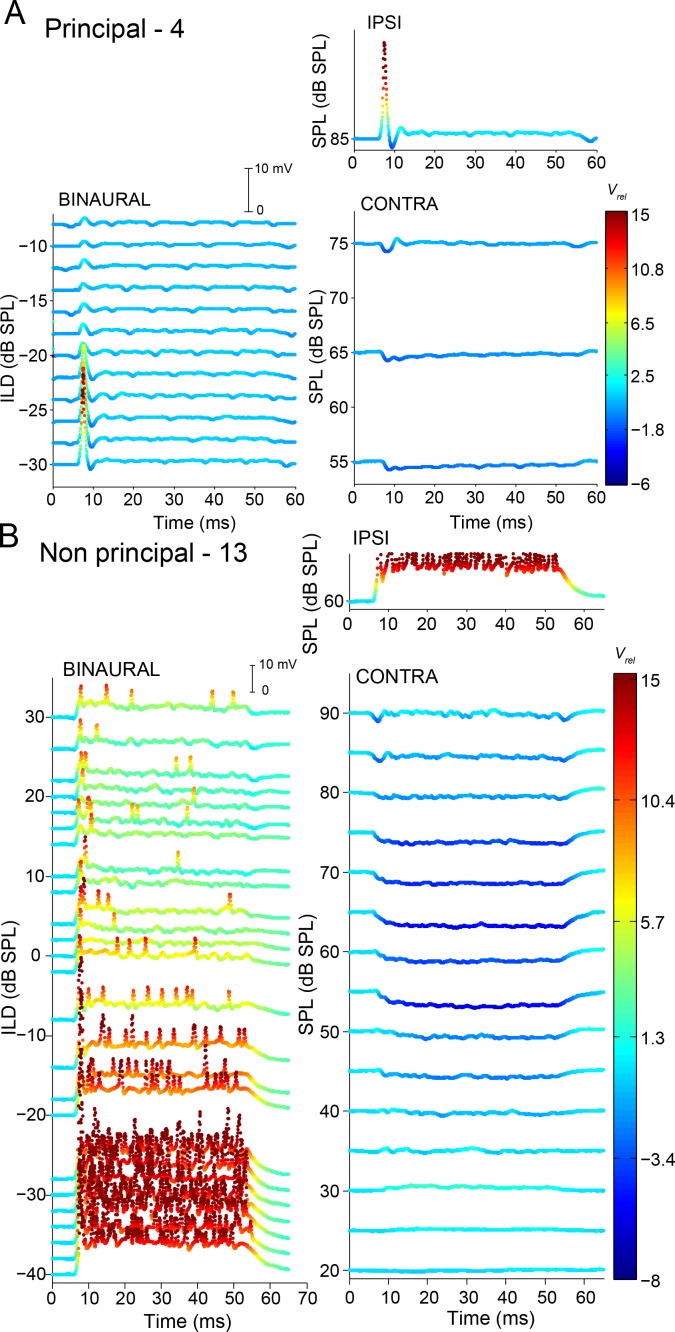
Figure 8. Complementary ILD-sensitivity in principal and non-principal neurons.
Average responses to binaural and monaural tones are shown for a principal cell (A) and non-principal cell (B). Average Vm is color-coded relative to resting Vm. Left panels: average responses to binaural tones of varying ILD, where the contralateral sound level is varied and the ipsilateral sound level kept constant. Right panels: average responses to monaural tones at the same sound levels as for the binaural data in the left panels. Respective stimulus frequencies: A: 3,480 Hz; B: 4,665 Hz.


