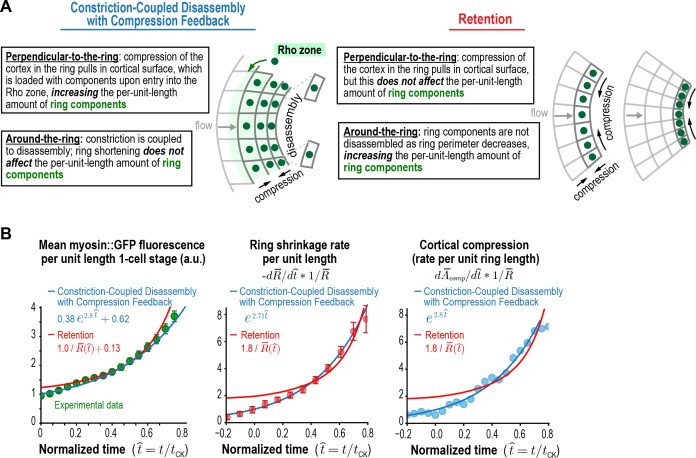
Figure 5. Myosin accumulation and the rates of ring constriction and cortical compression can be approximated with a retention model but are fit better by the Constriction-Coupled Disassembly with Compression Feedback model.
(A) Two models could explain the acceleration in the per-unit-length constriction rate during constriction. In the Constriction-Coupled Disassembly with Compression Feedback model, the increase in per-unit-length component amounts arises from a feedback loop between ring myosin and compression-driven cortical flow along the direction perpendicular to the ring. In the Retention model, the increase in per-unit-length component amounts arises because components are retained rather than lost due to disassembly as ring perimeter decreases. (B) Graphs show mean per-unit-length myosin::GFP fluorescence in the ring along with the per-unit-length constriction and cortical compression rates. Myosin fluorescence data is reproduced from Figure 3C to allow comparison of the best fits for the Constriction-Coupled Disassembly with Compression Feedback (blue lines) and Retention (red lines) models.


