

Abstract
Understanding the downstream consequences of pharmacologically targeted proteins is essential to drug design. Current approaches investigate molecular effects under tissue‐naïve assumptions. Many target proteins, however, have tissue‐specific expression. A systematic study connecting drugs to target pathways in in vivo human tissues is needed. We introduced a data‐driven method that integrates drug‐target relationships with gene expression, protein‐protein interaction, and pathway annotation data. We applied our method to four independent genomewide expression datasets and built 467,396 connections between 1,034 drugs and 954 pathways in 259 human tissues or cell lines. We validated our results using data from L1000 and Pharmacogenomics Knowledgebase (PharmGKB), and observed high precision and recall. We predicted and tested anticoagulant effects of 22 compounds experimentally that were previously unknown, and used clinical data to validate these effects retrospectively. Our systematic study provides a better understanding of the cellular response to drugs and can be applied to many research topics in systems pharmacology.
Study Highlights.
WHAT IS THE CURRENT KNOWLEDGE ON THE TOPIC?
☑ Understanding downstream functional consequences of pharmacologically targeted proteins is essential to drug design. Current approaches investigate molecular effects under tissue‐naïve assumptions using data derived from a single cell line.
WHAT QUESTION DID THIS STUDY ADDRESS?
☑ Many target proteins have tissue‐specific expression limiting the usefulness of current methods. We present a systematic study connecting drugs to specific target pathways in human tissues.
WHAT DOES THIS STUDY ADD TO OUR KNOWLEDGE?
☑ We introduced a data‐driven method that integrates drug‐target relationships with gene expression, protein‐protein interaction, and pathway annotation data. We applied our method to four independent genomewide expression datasets and built 467,396 connections between 1,034 drugs and 954 pathways in 259 human tissues or cell lines. The connections enabled us to predict and experimentally test anticoagulant effects of 22 compounds that were previously unknown.
HOW MIGHT THIS CHANGE DRUG DISCOVERY, DEVELOPMENT, AND/OR THERAPEUTICS?
☑ Our systematic study provides a better understanding of the cellular response to drugs and can be applied to many research topics in systems pharmacology, such as side effects prediction, drug repurpose, etc.
A central goal of systems pharmacology is to understand how biological systems respond to bioactive molecules. Most drugs achieve their therapeutic effect by interacting selectively with target proteins, which can be classified into major classes based on molecular function: enzymes, G‐protein coupled receptors (GPCRs), ion channels (voltage‐gated and ligand‐gated), nuclear hormone receptors, catalytic receptors, and transporters.1 The binding of a ligand contributes to the conformation change of the target protein, which then affects the biochemical and physiological function linked to the target.2 The target also interacts with other molecules to affect cellular activity at the pathway level. Most drug targets can directly participate in cellular activity except GPCRs. The signal of ligand binding is passed from GPCRs to two types of transducer molecules: G‐protein and β‐arrestin, which then affect cellular activity by G‐protein dependent and independent signaling, respectively.3, 4
Current efforts to systematically study pathways in response to drugs can be classified into two categories. Studies in the first category5, 6, 7, 8 analyze gene expression datasets derived from in vitro drug‐induced experiments to identify differentially expressed genes, and then use enrichment analysis methods, such as gene set enrichment analysis9 to find significantly enriched pathways. Such methods are facilitated by publicly available datasets like Connectivity Map,10 L1000,11 which contain collections of gene‐expression profiles from cultured human cells treated with thousands of bioactive small molecules. However, a major drawback of this method is that due to the dominating noise inherent to microarray technology, many unrelated pathways will be drawn into the results.12 In most cases, hundreds of pathways are identified as significant, which will not provide much useful information for pharmacologists studying the drug. In addition, these drug‐induced experiments are usually conducted on in vitro cancer cell lines, in which the expression of many genes is quite different from in vivo human tissues.13 Studies in the second category collect experimentally validated evidence from published articles and manually curate pathways to describe the pharmacological process of drugs, such as Pharmacogenomics Knowledgebase (PharmGKB),14 Kyoto Encyclopedia of Genes and Genomes (KEGG),15 etc. However, the pathways are usually limited to a small number of well‐described pharmacokinetic or pharmacodynamic pathways and exclude many basic cellular processes involved in signaling and metabolism.
Cell‐type plays an important part in the selectivity of drugs. Many drug target proteins are found to have tissue‐specific expression.16, 17, 18 The tissue‐specificity of target proteins can help us design drugs with specific sites of action.19, 20 Even the same target protein can trigger distinct downstream effect in various cell types. For example, despite ubiquitous expression across the heart, calcium channels play a more important role in the action potential of cardiac pacemaker cells, which causes these cells to be more sensitive to calcium channel blocking agents than other cardiac cells.2, 21 Understanding the mode of action of drugs from a tissue and cell type‐specific perspective is crucial to drug discovery and development.
In this article, we developed a data‐driven method to connect Drugs to target pAthways by the Tissue Expression (DATE). Our main hypothesis is that, for a drug to affect the function of a pathway in a tissue, the target protein must be associated with the pathway, and both the target and the pathway must be highly expressed in the target tissue. We validated our method against independent standards, tested the robustness of our results, and then applied DATE to drug safety prediction and drug‐repositioning. We investigated a wide range of physiological drug effects, including anticoagulation activity, where we predicted 132 drugs with potential anticoagulation activity and selected 22 newly predicted compounds to validate experimentally. Our results provide evidence that targeting ADRB2, a GPCR that regulates the activation of major platelet integrin and levels of cytosolic calcium, may contribute to anticoagulation in whole blood. In addition, we integrated experimental results with clinical side effects of compounds to show that predicted compounds are more likely to have significant anticoagulation activity. Our results can be accessed at http://tatonettilab.org/resources.html.
MATERIALS AND METHODS
Connecting drugs to target tissues
Four tissue‐specific gene expression datasets were analyzed in this study. We refer to them as U133A22 (microarray), NCI6023 (microarray), HPM_PRT24 (MS), and GTEx25 (RNA‐seq). The data were preprocessed as detailed in Supplementary Methods. There were 5,016 connections between drugs and target proteins that were obtained from Drugbank version 3.0.26 A drug was connected to a target tissue if the target protein is both highly and specifically expressed in the tissue, as detailed in Supplementary Methods.
Identifying the target pathways of drugs
We used Reactome27 pathways with sizes between 5 and 500 as the data source for pathways. The class information of target proteins were integrated from three resources: GtoPdb,28 ENZYME,29 and Uniprot30 (Supplementary Methods). Target proteins that are GPCRs were connected to downstream pathways using our previously published method predicting GPCR downstream signaling pathways using the tissue expression (GOTE).31 Non‐GPCR target proteins were connected to the annotated pathways that are highly expressed in the target tissue. We further filtered the parent pathway from results if it was connected to a drug in the same tissue together with its descendant pathway.
Calculating the target, chemical, and indication similarity of drugs
The similarity of target protein (or pathway) between two drugs was defined as the Jaccard similarity between two sets of target proteins (or pathway‐tissue connections). The chemical similarity of two drugs was defined as the Tanimoto coefficient between the simplified molecular‐input line‐entry systems (SMILES) of two drugs. The indication similarity of two drugs was defined as the Jaccard similarity between two sets of indications from an ensemble resource linking medications to their indications named MEDI32 (Supplementary Methods).
Predicting adverse events of drugs with target pathways of drugs
A reference standard33 between 4 adverse events and a total of 149 drugs were used (Supplementary Methods). We scored the filtered pathways of each drug by the number of target proteins in the pathway and used scores as features to predict the adverse event of drugs. For each adverse event, we trained a binary random forest classifier with 500 trees. The out‐of‐bag probability of each drug was used to evaluate the performance of the classifier. To account for the stochastic nature of random forests, we ran the analysis for 100 times and used the average as the final results.
Validation of drug‐tissue‐pathway connections using the L1000 dataset
The expression dataset of 653,394 compound treatment experiments were downloaded from http://lincscloud.org.34 A reference standard containing positive controls (pathways with significant change in expression) and negative controls (pathways without significant change in expression) was created for each connection between a drug and a cell line (Supplementary Methods).
Predicting drugs with potential effect on coagulation activity
Twenty Reactome pathways that describe cellular activities in the coagulation process were manually selected from the 44 hemostasis pathways. Two additional PharmGKB pathways were added (Supplementary Table S1). We identified 132 drugs that are connected to the 22 pathways in three types of tissues: platelets, whole blood, and liver (many coagulation factors as well as red blood cells are synthesized by the liver35) are defined as predicted drugs with effect on coagulation activity. As a reference set, 22 known anticoagulants were found through the Anatomical Therapeutic Chemical (ATC) code with the first four digits of “B01A.”
Coagulation experiment and data process
We conducted an in vitro assay to measure coagulation activity of compounds, as described previously.36 A series of thrombin activity was measured 0–300 minutes after the treatment of each compound. The outliers of positive or negative controls on each plate were filtered out using the Median Absolute Deviation method (MAD>2).37 “Maximum ratio” of a compound was calculated by dividing the maximum activity to the average maximum activity of negative controls located on the same plate as the compound, then normalized to a score between 0 and 1.
Defining a threshold of anticoagulation activity combining measured score and clinical side effect
We extracted 695 drugs with the side effect of bleeding (UMLS CUI: C0019080), 417 from side effect resource (SIDER)38 and 396 from the OFFSIDES database.39 Among those, 188 screened drugs were included. Of all 388 screened drugs, 337 were annotated with at least one side effect from two databases. We ranked them by maximum ratio from lowest to highest. Cutoff values from 5th to 95th percentile were used to divide all drugs into two groups. Odds ratios (ORs) of drugs with a bleeding side effect were calculated for each cutoff value (Supplementary Figure S1). As the percentile varies from 5th to 95th, the OR first rapidly increases to a maximum of 1.97 at the 17th percentile, then gradually declines close to 1. Thus, the 17th percentile cutoff, with corresponding maximum ratio of 0.775 was defined as the threshold of significant anticoagulation activity.
RESULTS
Drug target proteins have tissue‐specific expression
We classified all 5,016 target proteins into eight major classes (Figure 1 a, Supplementary Table S2). The two largest groups are enzymes (29.7%) and GPCRs (25.5%). The 13.4% target proteins which cannot be classified into eight major classes were labeled as “other proteins.” Most of these proteins are located in bacteria and are target of antibiotics (Supplementary Table S1).
Figure 1.
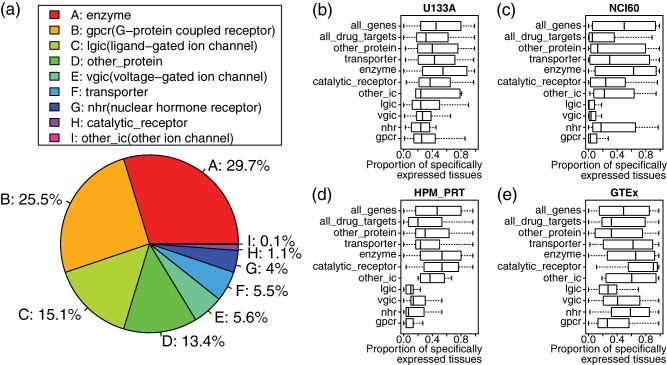
Tissue‐specificity of distinct target classes in four datasets. (a) Pie chart showing the proportion of 8 protein classes among all 5,016 drug ∼ target proteins pairs from DrugBank. (b–e) Boxplot showing the tissue‐specificity of distinct target classes in four datasets. The tissue‐specificity of a target protein is defined as the proportion of tissues in which the target is highly expressed when compared to the median of all the genes. To account for the variation in the absolute expression of different genes, the expression of each gene is normalized by the baseline level. Each box on the Y‐axis represents one target class. The X‐axis shows the tissue‐specificity of proteins belonging to the target class. “All_drug_targets” represents the combination of all the target classes. “All_genes” represents all the genes in the human genome.
We measured the tissue‐specificity of drug target proteins in four expression datasets by calculating the proportion of tissues in which each drug target is highly expressed using median (Figure 1 b–e) or 75th percentile (Supplementary Figure S2). By median, a drug target is specifically expressed in 31% of all tissues in U133A, 5.6% in NCI60, 20% in HPM_PRT and 32% in GTEx, significantly less than a median around 50% for all the genes (P < 2.2e‐16). Distinct classes of target proteins show different levels of tissue‐specificity. The G‐protein coupled receptor, ion channel, and nuclear hormone receptor are highly tissue‐specific, whereas enzyme, catalytic receptor, and transporter are less tissue‐specific.
Using tissue‐specific expression of target proteins to predict target pathways of drugs
We used DATE (Figure 2) to predict target pathways of drugs using four datasets. We found 467,396 significant connections between 1,034 drugs and 954 pathways in 259 human tissues (Table 1). Each drug was connected to an average of 112 pathways and 27 tissues when combining the results of four datasets. The standard deviation is greater than the mean in all four datasets, suggesting that the number of connected pathways and tissues varies greatly by drug. We identified 115,905 unique connections between drugs and pathways. There were 41,098 (35.5%) connections that are recurrent in at least two datasets and 3,871 (3.34%) connections that are recurrent in all four datasets. We further filtered the results using hierarchy of Reactome pathways to minimize redundancy. The median size of predicted pathways was significantly reduced after filtering (P < 0.05; Supplementary Figure S3).
Figure 2.
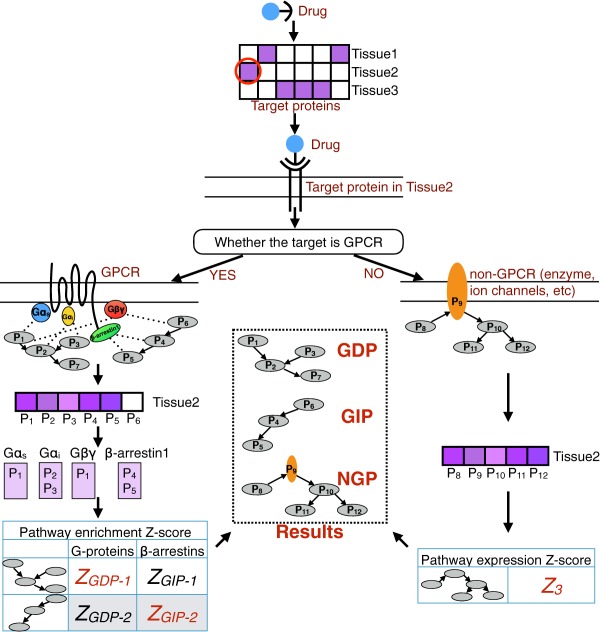
Workflow of Drugs to target pAthways by the Tissue Expression (DATE). A drug is first mapped to its target proteins using DrugBank. Then, tissue expression data are used to find the target protein that is highly expressed in each tissue. Next, two different processes were followed depending on whether the target protein is a G‐protein coupled receptor (GPCR) or not (GPCRs do not participate in the cellular activities directly, they pass the signals down to transducers). GPCRs are connected to downstream pathways using our previously developed method predicting GPCR downstream signaling pathways using the tissue expression (GOTE). In GOTE, the target GPCR is first mapped to the highly expressed transducers (G‐proteins or β‐arrestins) in the tissue. Then, for each transducer (G‐protein or β‐arrestin), a list of tissue‐specific binding proteins is obtained by combining BioGRID protein‐protein interaction data with the tissue expression of binding proteins. Pathway enrichment analysis is then performed based on the tissue‐specific binding proteins of each transducer using Fisher's exact test. For each pathway, the Z‐scores of all G‐proteins (or β‐arrestins) are combined into a single Z‐score using Stouffer's Method. Eventually, pathways with significant Z‐scores are connected to the drug in the tissue as G‐protein dependent pathways (GDPs; those that are associated with G‐proteins) or G‐protein independent pathways (GIPs; those that are associated with β‐arrestins). Non‐GPCRs are first connected to the annotated pathways. Then an expression Z‐score will be calculated for each annotated pathway to determine whether the pathway is highly expressed in the tissue, and the pathways with significant Z‐scores are connected to the drug in the tissue as non‐GPCR target pathways (NGPs).
Table 1.
Statistics of prediction results in four expression datasets
| U133A | NCI60 | HPM_PRT | GTEx | Combined |
Recurrent ≥2 |
Recurrent ≥3 |
Recurrent = 4 |
|
|---|---|---|---|---|---|---|---|---|
| Drugs | 696 | 580 | 753 | 930 | 1,034 | 864 | 591 | 355 |
| Pathways | 781 | 678 | 666 | 623 | 954 | 787 | 536 | 270 |
| Tissues | 84 | 108 | 30 | 53 | 259 | – | – | – |
| Full results | ||||||||
| Connections (D‐P‐T) | 137,199 | 76,191 | 37,719 | 217,401 | 467,396 | – | – | – |
| Connections (D‐P) | 47,341 | 38,666 | 22,384 | 67,305 | 115,905 | 41,098 | 14,822 | 3,871 |
| P per D (SD) | 68 (102) | 67 (91) | 30 (49) | 72 (100) | 112 (162) | 48 (76) | 25 (37) | 11 (17) |
| T per D (SD) | 9 (8) | 12 (11) | 5 (3) | 12 (9) | 27 (23) | – | – | – |
| Results after filtering parent pathways | ||||||||
| Connections (D‐P‐T) | 53,857 | 31,824 | 16,067 | 84,816 | 186,022 | – | – | – |
| Connections (D‐P) | 20,186 | 15,863 | 9,878 | 29,675 | 54,932 | 15,623 | 4,145 | 902 |
| P per D (SD) | 29 (41) | 27 (37) | 13 (19) | 32 (43) | 53 (77) | 18 (28) | 7 (9) | 3 (2) |
| T per D (SD) | 9 (8) | 12 (11) | 5 (3) | 12 (9) | 27 (23) | – | – | – |
D, drug; P, pathway; T, tissue; SD, standard deviation.
Many pathways were connected to more than one drug (Supplementary Table S3). The number of drugs that each pathway was connected to is positively correlated with pathway size (P < 2.2e‐16; Supplementary Figure S4). A drug and a pathway can be connected in multiple tissues in which the target proteins are highly expressed. The number of connected tissues is positively correlated with the number of target proteins in the pathway (P < 2.2e‐16; Supplementary Figure S5).
Distinct datasets show consistency in the predicted target pathways of drugs
We compared the similarity of results in the three distinct datasets derived from normal human tissues: U133A, HPM_PRT, and GTEx. There were 7,510 connections between drugs and pathways that are recurrent in all three datasets (Figure 3 a), and 1,032 connections between drugs, pathways, and tissues that are recurrent in all three datasets (Figure 3 b).
Figure 3.
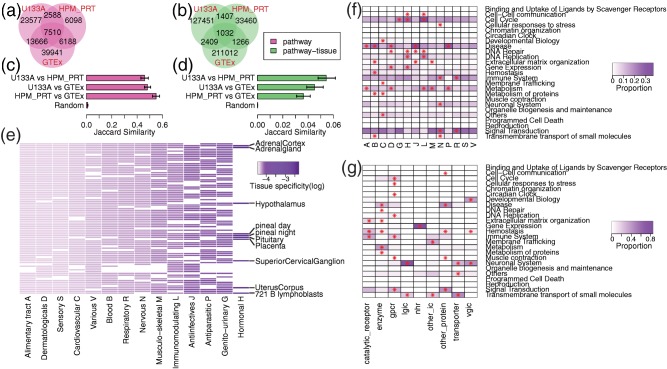
Visualization of drug‐pathway‐tissue connections built from expression datasets derived from normal human tissues. (a–d) Consistency of results in the three datasets derived from normal human tissues: U133A (microarray), HPM_PRT (mass spectrometry), and GTEx (sequencing). In a and b, the Venn diagrams show the number of drug‐pathway a or drug‐pathway‐tissue b connections overlapped among three datasets. In c and d, pairwise comparison was performed among three datasets. The bar plot shows the average Jaccard similarity (X‐axis) of pathways c or pathway‐tissues d connected to each drug. “Random” represents null distribution generated by randomly assigning pathways c or pathway‐tissues d to each drug. The error bar indicates 95% confidence interval of average calculated by bootstrap. (e) Heatmap showing the tissue‐specificity of distinct Anatomical Therapeutic Chemical (ATC) classification system drug classes (in U133A dataset). Each column represents an ATC drug class, whereas each row represents a tissue. Each cell is colored in purple or white depending on whether drugs in the ATC class are connected to this tissue or not. The scale of purple is proportional to the tissue‐specificity score. (f,g) Heatmap showing the enrichment of pathway categories by drug class, either defined by ATC code f or the class of target proteins g. Each column represents a drug class, whereas each row represents a Reactome pathway category. Each cell is colored from white to purple, which is proportional to the percentage of drug‐pathway connections (in the HPM_PRT dataset) that belong to the corresponding drug class and pathway category. An asterisk “*” in a cell indicates the pathway category is significantly enriched in the drug class by Fisher's exact test (false discovery rate <0.01).
For each drug, we calculated the pairwise Jaccard similarity of connected pathways among different datasets. The average pairwise Jaccard similarity is 0.46 ± 0.03 (U133A vs. HPM_PRT), 0.48 ± 0.02 (U133A vs. GTEx), and 0.55 ± 0.03 (HPM_PRT vs. GTEx), all significantly greater than null distribution 0.0099 ± 0.0015 (P < 2.2e‐16; Figure 3 c). The same analysis was performed to compare the pairwise Jaccard similarity of connected pathways in the same tissue among datasets. The average pairwise Jaccard similarity is 0.054 ± 0.007 (U133A vs. HPM_PRT), 0.045 ± 0.007 (U133A vs. GTEx), and 0.036 ± 0.006 (HPM_PRT vs. GTEx), all significantly greater than null distribution 0.00014 ± 0.00005 (P < 2.2e‐16; Figure 3 d).
Hormonal drugs show high tissue‐specificity
We classified drugs according to their ATC class and defined the tissue‐specificity of each class as the inverse number of tissues targeted by the class. Figure 3 e and Supplementary Figure S6 show the tissue‐specificity of each ATC class, as well as their target tissues. Hormonal drugs have the highest tissue‐specificity in all four datasets. Ten of 84 (11.9%) tissues in U133A are targeted by hormonal drugs. Most of the 10 tissues belong to the endocrine system, such as the adrenal glands, hypothalamus, and pituitary glands. Other ATC classes have lower tissue‐specificity, especially the alimentary tract, dermatological, sensory, and cardiovascular, which target >90% of the tissues in all four datasets.
Distinct classes of drugs show preference in different category of pathways
Reactome pathways can be classified into 25 general categories, representing various biological processes. For every ATC class, we showed the proportion of drug‐pathway connections that belong to each pathway category (Figure 3 f; Supplementary Figure S7), and identified the enriched categories (Supplementary Methods; Supplementary Table S4). All ATC classes are enriched with at least one pathway category except sensory and various. Blood, hormonal, immunological, and nervous are all enriched with five pathway categories, with hemostasis, gene expression, cell cycle, and neuronal system being the most significant category, respectively.
We also classified drugs by the class of target proteins (Figure 3 g; Supplementary Figure S7; Supplementary Table S4). All target classes are enriched with at least two pathway categories except nuclear hormone receptor, which is uniquely enriched with gene expression. GPCR and enzyme are each enriched with seven and six pathway categories with no overlaps between them. Both ligand‐gated ion channel and voltage‐gated ion channel are enriched with the neuronal system. In addition, voltage‐gated ion channel is also enriched with developmental biology. Other ion channel (second messenger‐regulated) is most significantly enriched with membrane trafficking. Transporter is most significantly enriched with transmembrane transport of small molecules.
Drugs with similar chemical structure or indications target similar pathways
We tested whether drugs with similar chemical structure or medical indication will target similar pathways in the same tissue. We found that the similarity of target pathways increases exponentially with chemical similarity of drugs and remains consistently higher than the similarity of target proteins (Figure 4 a–d). By contrast, the similarity of target pathways increases linearly with indication similarity (Figure 4 e–h).
Figure 4.
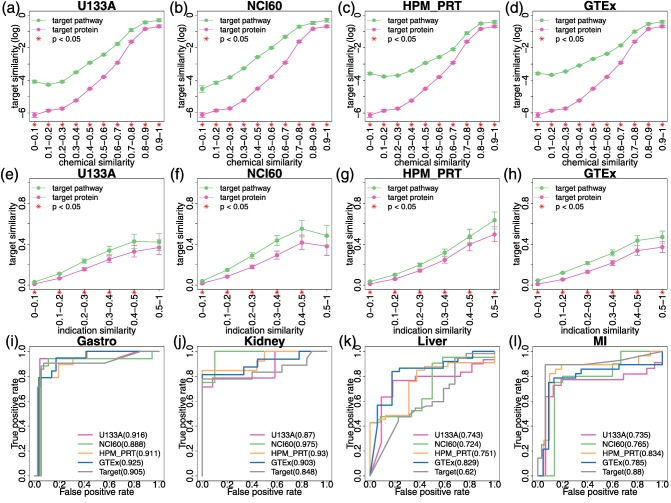
Correlation between drug identities and target pathways. (a–h) Line graphs showing the similarity of target proteins (pink line) or target pathways (green line) increases as the similarity of drug identities: chemical structure a–d or indication e–h increases. Pairwise similarity of chemical structure or indication was calculated among all drugs and grouped into 10 (for chemical structure) or 6 (for indication) bins on the X‐axis. The Y‐axis shows the average target similarity (log conversion performed in a–d) of all the drug pairs in each bin. The error bar indicates 95% confidence interval of average calculated by bootstrap. On the X‐axis, “*” indicates that the drug pairs in the bin have higher similarity of target pathways compared with target proteins (P < 0.05). (i–l) The receiver operating characteristic (ROC) curves showing the performance of trained classifiers using target proteins or pathways as features to predict four common adverse events caused by modern drugs: gastrointestinal bleeding i, acute kidney failure j, acute liver failure k, and myocardial infarction l. In each plot, the ROC curves of five classifiers are shown along with their area under the ROC curve (AUROC) values: four classifiers using the target pathways of drugs derived from four datasets as features (U133A: red; NCI60: green; HPM_PRT: yellow; and GTEX: blue), and one classifier using the target proteins of drugs as features (gray).
Using target pathways improves the performance of drug safety predictions
We hypothesized that the target pathways would better explain the adverse events of drugs than simply the target alone. To validate the hypothesis, we used target pathways or proteins as features and trained binary random forest classifiers to predict four adverse events of drugs. The performance of each classifier was shown by the receiver operating characteristic (ROC) curve in Figure 4 i–l. Except for myocardial infarction, target pathways are better predictors than target proteins. For example, using target pathways in NCI60 to predict kidney failure can achieve an area under the curve (AUC) of 0.975, which improves the performance of target proteins by 15%. Similarly, using target pathways in GTEx to predict liver failure can achieve an AUC of 0.829, which improves the performance by 33.7%.
The number of features used in the classifier varies by the adverse events and by the datasets used for prediction (Supplementary Table S5). After filtering the features by importance score, we found that the number of features with importance >0 varies from 57 to 162. No correlation between the number of features and the AUC of classifier was found. “Synthesis of 15‐eicosatetraenoic acid derivatives,” “synthesis of prostaglandins and thromboxanes,” and “arachidonic acid metabolism” are important pathway predictors for gastrointestinal bleeding, kidney failure and myocardial infarction. In addition, “metabolism of angiotensinogen to angiotensin” is important in predicting kidney failure. “Trafficking of GluR2‐containing AMPA receptors” and “peptide hormone metabolism” are important in predicting liver failure.
Predicted pathways go through expression change after drug treatment in L1000 experiments
We hypothesized that the expression of target pathways will change after the treatment of drug in the predicted tissue. We validated this using a reference standard among the drug, pathway, and cell line built from the L1000 dataset. Of all 76,191 connections, 281 connections (4%) between 92 drugs and 16 cell lines can be evaluated using the standard. Precision and recall were calculated using the reference standard (Figure 5 a,b). The precision of our results is 0.38 ± 0.04, significantly outperforming null distribution 0.28 ± 0.03 (P = 6.511e‐05). The recall of our results is 0.0087 ± 0.0021, which significantly outperforms the null distribution 0.0027 ± 0.0004 (P = 6e‐08).
Figure 5.
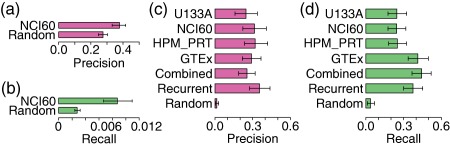
Validation of drug‐pathway‐tissue connections built by Drugs to target pAthways by the Tissue Expression (DATE). (a,b) Validation of drug‐pathway‐tissue connections (NCI60) using a reference standard created from L1000 drug‐induced expression data. A positive standard of drug‐pathway‐tissue connection was defined as a significant change in pathway expression after drug treatment in the tissue. The Bar plot shows the average precision a and recall b of validated drugs. Precision = TP/(TP+FP), Recall = TP/(TP+FN). “Random” represents null distribution generated by randomly assigning pathway‐tissue to each drug. The error bar indicates 95% confidence interval of average calculated by bootstrap. (c,d) Validation of drug‐pathway connections using a reference standard from Pharmacogenomics Knowledgebase (PharmGKB), which provides mapping between drugs and pharmacodynamic and pharmacokinetic pathways. The barplot shows the average precision c and recall d of validated drugs. “Combined” represents all drug‐pathway connections from four datasets. “Recurrent” represents drug‐pathway connections that appear in at least two datasets. “Random” represents null distribution generated by randomly assigning pathway‐tissue to each drug. The error bar indicates 95% confidence interval of average calculated by bootstrap.
DATE recaptures the drug‐pathway connections in PharmGKB
PharmGKB14 provides a reference standard of 187 connections between 143 drugs and 92 pathways that describe the pharmacodynamics and pharmacokinetics of the drug. We used DATE to connect drugs to the 92 pathways and compared our results to PharmGKB. Altogether we built 29,078 connections between 776 drugs and 88 pathways in 223 human tissues (Supplementary Table S6). Of 143 drugs from PharmGKB, 129 drugs (90%) can be evaluated. Precision and recall were calculated using the reference standard (Figure 5 c‐d). The precision of combined (combining all four datasets) and recurrent (appearing in at least two datasets) results are 0.25 ± 0.06 and 0.35 ± 0.08, respectively, which significantly outperforms the null distribution 0.01 ± 0.01 (P < 1.0e‐11). The recall of combined and recurrent results are 0.44 ± 0.08 and 0.38 ± 0.08, respectively, which significantly outperforms the null distribution 0.04 ± 0.03 (P < 1.0e‐15).
DATE accurately predicts coagulation effects in experimental assays
We predicted 132 drugs with coagulation effects (Supplementary Table S7) based on their connections to a manually curated set of 22 coagulation‐related pathways (Supplementary Table S1). Predicted drugs are enriched with known anticoagulants (P = 2.09e‐07; Supplementary Table S8).
We conducted one unbiased experimental screen of 388 drugs (Supplementary Table S9) to measure the coagulation activity using a high‐throughput in vitro assay developed previously.36 A “maximum ratio” score was calculated to represent coagulation activity (Supplementary Table S10). Screened drugs were not enriched with known anticoagulants (P = 0.16; Supplementary Table S8). We grouped all 388 screened drugs into the following categories: (1) Reactome: 26 predicted drugs connected to Reactome pathways; (2) PharmGKB: 41 predicted drugs connected to PharmGKB pathways; (3) tissue‐naïve: 50 drugs that were connected to 22 coagulation‐related pathways only in tissues other than coagulation tissues (these drugs can be predicted by tissue‐naïve methods, but not DATE); and (4) others: 325 drugs that were not predicted to have anticoagulation effects. The average maximum ratio of predicted drugs using PharmGKB (0.76 ± 0.08) are lower than that of both tissue‐naïve drugs (0.85 ± 0.02) and unpredicted drugs (0.85 ± 0.01), with P value of 0.014 and 0.013 (Figure 6 a).
Figure 6.
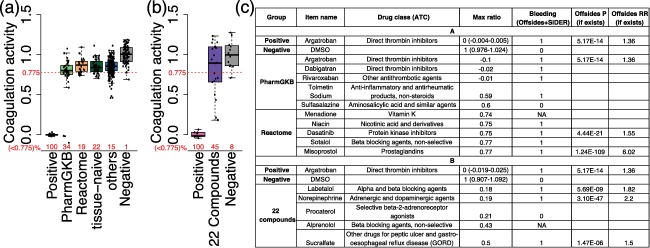
Experimental validation of drugs predicted with anticoagulation activity. (a) Boxplot with jitter showing the coagulation activity of 6 groups: (1) positive control: argatroban; (2) Reactome: 26 predicted drugs connected to Reactome pathways; (3) Pharmacogenomics Knowledgebase (PharmGKB): 41 predicted drugs connected to PharmGKB pathways; (4) tissue‐naïve: 50 drugs that can be predicted by tissue‐naïve methods, but not DATE; (5) others: the other unpredicted 325 drugs; and (6) Negative control: DMSO. The Y‐axis shows the coagulation activity of drugs represented by “maximum ratio” score. A red dashed line was drawn at 0.775 on Y‐axis, representing the threshold of significant anticoagulation activity. The proportion of compounds with significant anticoagulation activity (maximum ratio <0.775) in each group was shown in red numbers on X‐axis. (b) Boxplot with jitter showing the coagulation activity of three groups: (1) positive control: argatroban; (2) 22 newly predicted compounds that have not been screened on the coagulation activity in a; and (3) negative control: DMSO. (c) A table of predicted drugs with significant anticoagulation activity in a and b. Only the top five drugs in each group (PharmGKB, Reactome, and 22 compounds) were shown here. Full results can be found in Supplementary Table S10. P, P value; RR, reporting ratio; NA, compound was not studied in SIDER or OFFSIDES. Because only OFFSIDES provides a P value for each pair of drug and side effect, whereas SIDER only provides the mapping between them, some compounds will have blank profiles in the last two column if they were only reported in SIDER.
Meanwhile, we combined the measured coagulation activity of drugs with clinical side effects concerning drug‐induced bleeding. A maximum ratio of 0.775 was defined as the threshold of significant anticoagulation activity, which maximizes the OR of drugs with bleeding side effects (OR = 1.97; P = 0.018; Supplementary Figure S1). We found 34% of Reactome and 19% of PharmGKB predicted drugs below this threshold (Figure 6 a), both of which are greater than unpredicted drugs (15%). Among the five Reactome or PharmGKB predicted drugs with the lowest maximum ratio, four of them have the side effect of bleeding (Figure 6 c).
Targeting ADRB2 may cause anticoagulation effect in whole blood
Sixty‐nine predicted drugs were not included in the initial screen. These unpredicted drugs were enriched with seven known anticoagulants (P = 6.44e‐06; Supplementary Table S8). We selected 22 compounds from the other 62 drugs that have not been validated on the coagulation activity (Supplementary Methods; Supplementary Table S11) and performed a prospective validation of these predictions. The average maximum ratio of 22 compounds is 0.81 ± 0.14 (Figure 6 b), which is significantly lower than that of negative controls 1.00 ± 0.09 (P = 0.018). Ten compounds (45%) have significant anticoagulation activity according to the defined threshold. The five drugs with the lowest maximum ratio are labetalol, norepinephrine, procaterol, alprenolol and sulcralfate (Figure 6 c), which are primarily used to treat cardiovascular diseases, such as hypertension and chest pain. Labetalol, norepinephrine, and sulcralfate were reported to have the side effect of bleeding. Labetalol, norepinephrine, procaterol, and alprenolol mutually target ADRB2, a beta‐2‐adrenergic receptor. Procaterol is a selective agent of ADRB2, whereas the other four drugs are nonselective agents with other adrenoreceptor targets (e.g., ADRA1A, ADRA1B, and ADRB1). Using DATE, we connected ADRB2 to three hemostasis pathways in whole blood: “integrin alphaIIb beta3 signaling,” “reduction of cytosolic Ca++ levels,” and “factors involved in megakaryocyte development and platelet production.”
DISCUSSION
Target proteins of a drug function as a bridge that connects the drug to cellular activity. We found that many target proteins have tissue‐specific expression, indicating the importance of taking tissue‐specificity into account while identifying drug target pathways. This consideration is absent in current systematic methods. We presented a data‐driven method, DATE, to systematically connect drugs to target pathways in human tissues. We applied DATE to four expression datasets and validated our results by comparing it to two standards: (1) a weak standard created with the L1000 expression dataset; and (2) a stringent tissue‐naïve standard from PharmGKB. The first standard is less stringent and will unavoidably bring in some false‐positive samples because co‐expression sometimes does not mean actual connection, which explains the relatively low recall (Figure 5 b). The second standard provides high‐confidence but fewer connections between drugs and pathways, which explains a higher recall (Figure 5 d) and lower precision (Figure 5 c). We also found that drugs with similar chemical structure or medical indication are more likely to share same target pathways rather than target proteins, suggesting target pathway is a better indicator of the drug activity.
As a data‐driven method, one limitation of DATE is the dependency on the expression dataset used. Therefore, we tested the robustness of DATE among three datasets, each one using a different technology. Overall, both drug‐pathway and drug‐pathway‐tissue connections significantly outperform the null distribution, which suggests DATE is robust against the systematic error across platforms. The drop in the consistency of drug‐pathway‐tissue connections compared to drug‐pathway connections were caused by a major obstacle that the three datasets did not use the same tissue‐naming standard. This may lead to a situation in which the same name in different datasets can refer to different types of cells. Another limitation of DATE is that it requires prior knowledge of the target protein. With most current knowledge only concerning the on‐target protein of drugs, the connections we built are limited to cellular pathways that account for the on‐target effect of drugs.
The drug‐pathway‐tissue connections we built can be applied to address many important research topics in molecular systems pharmacology. For example, we used the connected pathways as features to predict four common adverse events, and saw an improvement of performance when compared to using the target proteins as features in three of the four adverse events tested. In myocardial infarction, the molecular mechanism can be well explained by target proteins with high importance score, which lead to the better performance of target proteins. For instance, PTGS2 that shows the highest importance score in predicting myocardial infarction, is a cardioprotective protein that alleviates ischemia/reperfusion injury and mediates late phase preconditioning.40, 41, 42 We also predicted 132 drugs to have an effect on the coagulation process. An unbiased experimental screen showed that the predicted drugs are more likely to have anticoagulation activity compared with those drugs only predicted by tissue‐naïve methods or other unpredicted drugs. This is because our tissue‐specific analysis can connect drugs to their target tissues or potential sites of action and provide more comprehensive knowledge about the mechanism of action. Three predicted drugs with lowest coagulation activity are known anticoagulants and several others can act as a vitamin‐K antagonist, which reduces blood‐clotting. We performed prospective validation on 22 predicted compounds that have not been used as anticoagulants, and found that their coagulation activity is significantly lower than the negative controls. Among the 22 compounds, several have been reported to affect coagulation in previous research, such as labetalol43, 44 and alprenolol.45, 46 Four newly predicted compounds with lowest coagulation activity share a mutual target protein, ADRB2. This suggests that targeting ADRB2 may cause an anticoagulation effect in whole blood, opening potential new avenues for drug discovery research. In addition, we integrated experimental screen results with clinical data and defined the 17th percentile of the maximum ratio as the threshold of significant anticoagulation activity. Drugs with a maximum ratio below the threshold are nearly two times more likely to cause bleeding. We found that predicted drugs exhibit a higher probability of significant anticoagulation activity when compared to unpredicted drugs, which further validates our predictions. Shown in Figure 6 c, many predicted drugs have already been reported with the bleeding side effect in OFFSIDES or SIDER, such misoprostol and norepinephrine, etc. Meanwhile, several other drugs, such as sulfasalazine, menadione, procaterol, or alprenolol have not been reported with the bleeding side effect yet. Our analysis provided evidence that such drugs may have significant anticoagulation activity, thus, the patient should be monitored for potential bleeding risk.
CONFLICT OF INTEREST
The authors declared no competing interests for this work.
SOURCE OF FUNDING
This work was supported by the National Institutes of Health (R01GM107145), the Herbert Irving Fellows award and the NCATS award for NPT, CaST (NCI P30CA013696) award for Y.H. and N.P.T.
AUTHOR CONTRIBUTIONS
Y.H., K.Q., and N.P.T. wrote the manuscript. Y.H. and N.P.T. designed the research. Y.H. and K.Q. performed the research. Y.H., K.Q., and N.P.T. analyzed the data. K.Q., R.R., and C.K. contributed new reagents/analytical tools.
Supporting information
FILE TITLES
Supplementary Figure S1 Tissue‐specificity of distinct target classes in four datasets.
Supplementary Figure S2 Size of predicted pathways before and after filtering in four datasets.
Supplementary Figure S3 Correlation between the size of a pathway and the number of drugs to which it is connected.
Supplementary Figure S4 Correlation between the number of connected tissues and the number of target proteins in the pathway.
Supplementary Figure S5 Tissue‐specificity of distinct ATC drug classes.
Supplementary Figure S6 Enrichment of different pathway categories in drug classes.
Supplementary Figure S7 Justification of choosing 0.775 as threshold of significant anticoagulation activity.
Supplementary Table S1 The protein target of drugs provided by Drugbank.
Supplementary Table S2 Pathways that were connected to multiple drugs.
Supplementary Table S3 Pathway categories enriched in different drug classes.
Supplementary Table S4 Importance score of features in the random forest models that predict four adverse events.
Supplementary Table S5 A summary statistics of drug ‐ tissue ‐ PharmGKB pathway connections in four datasets.
Supplementary Table S6 Drugs connected to Reactome or PharmGKB coagulation‐related pathways.
Supplementary Table S7 Twenty‐two manually curated coagulation‐related pathways.
Supplementary Table S8 The 2*2 contingency table of Fisher Exact Test.
Supplementary Table S9 Description of drugs in the unbiased screen.
Supplementary Table S10 Description of drugs selected for prospective validation.
Supplementary Table S11 Coagulation experiment results and bleeding side effects of drugs.
Supplementary Table S12 The tissue origin of cell lines.
References
- 1.Hopkins, A.L. & Groom, C.R. The druggable genome. Nat. Rev. Drug Discov 1, 727–730 (2002). [DOI] [PubMed]
- 2.Golan, D.E., Tashjian, A.H. & Armstrong, E.J. Principles of Pharmacology: The Pathophysiologic Basis of Drug Therapy. (Lippincott Williams & Wilkins, New York, NY, 2011).
- 3.Digby, G.J., Lober, R.M., Sethi, P.R. & Lambert, N.A. Some G protein heterotrimers physically dissociate in living cells. Proc. Natl. Acad. Sci. USA 103, 17789–17794 (2006). [DOI] [PMC free article] [PubMed]
- 4. Métayé, T. , Gibelin, H. , Perdrisot, R. & Kraimps, J.L. Pathophysiological roles of G‐protein‐coupled receptor kinases. Cell Signal. 17, 917–928 (2005). [DOI] [PubMed] [Google Scholar]
- 5. Zeng, H. , Qiu, C. & Cui, Q. Drug‐Path: a database for drug‐induced pathways. Database (Oxford) 2015, bav061 (2015). [DOI] [PMC free article] [PubMed] [Google Scholar]
- 6. Pratanwanich, N. & Lió, P. Pathway‐based Bayesian inference of drug‐disease interactions. Mol. Biosyst. 10, 1538–1548 (2014). [DOI] [PubMed] [Google Scholar]
- 7. Kuo, Y.L. et al Gene expression profiling and pathway network analysis predicts a novel antitumor function for a botanical‐derived drug, PG2. Evid. Based Complement. Alternat. Med. 2015, 917345 (2015). [DOI] [PMC free article] [PubMed] [Google Scholar]
- 8. Melas, I.N. et al Identification of drug‐specific pathways based on gene expression data: application to drug induced lung injury. Integr. Biol. (Camb). 7, 904–920 (2015). [DOI] [PubMed] [Google Scholar]
- 9. Subramanian, A. et al Gene set enrichment analysis: a knowledge‐based approach for interpreting genome‐wide expression profiles. Proc. Natl. Acad. Sci. USA 102, 15545–15550 (2005). [DOI] [PMC free article] [PubMed] [Google Scholar]
- 10. Lamb, J. et al The Connectivity Map: using gene‐expression signatures to connect small molecules, genes, and disease. Science 313, 1929–1935 (2006). [DOI] [PubMed] [Google Scholar]
- 11. Subramanian, A. et al A next generation connectivity map: L1000 platform and the first 1,000,000 profiles. Cell 171, 1437–1452 (2017). [DOI] [PMC free article] [PubMed] [Google Scholar]
- 12. Abdullah‐Sayani, A. , Bueno‐de‐Mesquita, J.M. & van de Vijver, M.J. Technology Insight: tuning into the genetic orchestra using microarrays—limitations of DNA microarrays in clinical practice. Nat. Clin. Pract. Oncol. 3, 501–516 (2006). [DOI] [PubMed] [Google Scholar]
- 13. Zhang, L. et al Gene expression profiles in normal and cancer cells. Science 276, 1268–1272 (1997). [DOI] [PubMed] [Google Scholar]
- 14. Whirl‐Carrillo, M. et al Pharmacogenomics knowledge for personalized medicine. Clin. Pharmacol. Ther. 92, 414–417 (2012). [DOI] [PMC free article] [PubMed] [Google Scholar]
- 15. Kanehisa, M. , Goto, S. , Furumichi, M. , Tanabe, M. & Hirakawa, M. KEGG for representation and analysis of molecular networks involving diseases and drugs. Nucleic Acids Res. 38(Database issue), D355–D360 (2010). [DOI] [PMC free article] [PubMed] [Google Scholar]
- 16. Regard, J.B. , Sato, I.T. & Coughlin, S.R. Anatomical profiling of G protein‐coupled receptor expression. Cell 135, 561–571 (2008). [DOI] [PMC free article] [PubMed] [Google Scholar]
- 17. Gaborit, N. et al Regional and tissue specific transcript signatures of ion channel genes in the non‐diseased human heart. J. Physiol. 582(Pt 2), 675–693 (2007). [DOI] [PMC free article] [PubMed] [Google Scholar]
- 18. Nishimura, M. & Naito, S. Tissue‐specific mRNA expression profiles of human ATP‐binding cassette and solute carrier transporter superfamilies. Drug Metab. Pharmacokinet. 20, 452–477 (2005). [DOI] [PubMed] [Google Scholar]
- 19. Frazer, R. , Irvine, A.E. & McMullin, M.F. Chronic myeloid leukaemia in the 21st century. Ulster Med. J. 76, 8–17 (2007). [PMC free article] [PubMed] [Google Scholar]
- 20. Billington, O.J. , McHugh, T.D. & Gillespie, S.H. Physiological cost of rifampin resistance induced in vitro in Mycobacterium tuberculosis. Antimicrob. Agents Chemother. 43, 1866–1869 (1999). [DOI] [PMC free article] [PubMed] [Google Scholar]
- 21. Marionneau, C. et al Specific pattern of ionic channel gene expression associated with pacemaker activity in the mouse heart. J. Physiol. 562(Pt 1), 223–234 (2005). [DOI] [PMC free article] [PubMed] [Google Scholar]
- 22. Su, A.I. et al A gene atlas of the mouse and human protein‐encoding transcriptomes. Proc. Natl. Acad. Sci. USA 101, 6062–6067 (2004). [DOI] [PMC free article] [PubMed] [Google Scholar]
- 23. Wu, C. , Jin, X. , Tsueng, G. , Afrasiabi, C. & Su, A.I. BioGPS: building your own mash‐up of gene annotations and expression profiles. Nucleic Acids Res. 44(D1), D313–D316 (2016). [DOI] [PMC free article] [PubMed] [Google Scholar]
- 24. Kim, M.S. et al A draft map of the human proteome. Nature 509, 575–581 (2014). [DOI] [PMC free article] [PubMed] [Google Scholar]
- 25. Melé, M. et al Human genomics. The human transcriptome across tissues and individuals. Science 348, 660–665 (2015). [DOI] [PMC free article] [PubMed] [Google Scholar]
- 26. Knox, C. et al DrugBank 3.0: a comprehensive resource for 'omics' research on drugs. Nucleic Acids Res. 39, D1035–D1041 (2011). [DOI] [PMC free article] [PubMed] [Google Scholar]
- 27. Croft, D. et al The Reactome pathway knowledgebase. Nucleic Acids Res. 42(Database issue), D472–D477 (2014). [DOI] [PMC free article] [PubMed] [Google Scholar]
- 28. Southan, C. et al The IUPHAR/BPS Guide to PHARMACOLOGY in 2016: towards curated quantitative interactions between 1300 protein targets and 6000 ligands. Nucleic Acids Res. 44(D1), D1054–D1068 (2016). [DOI] [PMC free article] [PubMed] [Google Scholar]
- 29. Bairoch, A. The ENZYME database in 2000. Nucleic Acids Res. 28, 304–305 (2000). [DOI] [PMC free article] [PubMed] [Google Scholar]
- 30.UniProt Consortium. UniProt: a hub for protein information. Nucleic Acids Res. 43(Database issue), D204–D212 (2015). [DOI] [PMC free article] [PubMed] [Google Scholar]
- 31. Hao, Y. & Tatonetti, N.P. Predicting G protein‐coupled receptor downstream signaling by tissue expression. Bioinformatics 32, 3435–3443 (2016). [DOI] [PMC free article] [PubMed] [Google Scholar]
- 32. Wei, W.Q. , Cronin, R.M. , Xu, H. , Lasko, T.A. , Bastarache, L. & Denny, J.C. Development and evaluation of an ensemble resource linking medications to their indications. J. Am. Med. Inform. Assoc. 20, 954–961 (2013). [DOI] [PMC free article] [PubMed] [Google Scholar]
- 33. Ryan, P. , Madigan, D. , Stang, P. , Schuemie, M. & Hripcsak, G. Medication‐wide association studies. CPT Pharmacometrics Syst. Pharmacol. 2, e76 (2013). [DOI] [PMC free article] [PubMed] [Google Scholar]
- 34. Duan, Q. et al LINCS Canvas Browser: interactive web app to query, browse and interrogate LINCS L1000 gene expression signatures. Nucleic Acids Res. 42(Web Server issue), W449–W460 (2014). [DOI] [PMC free article] [PubMed] [Google Scholar]
- 35. Roberts, H.R. & Cederbaum, A.I. The liver and blood coagulation: physiology and pathology. Gastroenterology 63, 297–320 (1972). [PubMed] [Google Scholar]
- 36. Chang, J.B. , Quinnies, K.M. , Realubit, R. , Karan, C. , Rand, J.H. & Tatonetti, N.P. A novel, rapid method to compare the therapeutic windows of oral anticoagulants using the Hill coefficient. Sci. Rep. 6, 29387 (2016). [DOI] [PMC free article] [PubMed] [Google Scholar]
- 37. Leys, C. , Ley, C. , Klein, O. , Bernard, P. & Licata, L. Detecting outliers: do not use standard deviation around the mean, use absolute deviation around the median. J. Exp. Soc. Psychol. 49, 764–766 (2013). [Google Scholar]
- 38. Kuhn, M. , Letunic, I. , Jensen, L.J. & Bork, P. The SIDER database of drugs and side effects. Nucleic Acids Res. 44(D1), D1075–D1079 (2016). [DOI] [PMC free article] [PubMed] [Google Scholar]
- 39. Tatonetti, N.P. , Ye, P.P. , Daneshjou, R. & Altman, R.B. Data‐driven prediction of drug effects and interactions. Sci. Transl. Med. 4, 125ra131 (2012). [DOI] [PMC free article] [PubMed] [Google Scholar]
- 40. Inserte, J. et al Constitutive COX‐2 activity in cardiomyocytes confers permanent cardioprotection Constitutive COX‐2 expression and cardioprotection. J . Mol. Cell. Cardiol. 46, 160–168 (2009). [DOI] [PubMed] [Google Scholar]
- 41. Hu, L.F. , Pan, T.T. , Neo, K.L. , Yong, Q.C. & Bian, J.S. Cyclooxygenase‐2 mediates the delayed cardioprotection induced by hydrogen sulfide preconditioning in isolated rat cardiomyocytes. Pflugers Arch. 455, 971–978 (2008). [DOI] [PubMed] [Google Scholar]
- 42. Bolli, R. et al Discovery of a new function of cyclooxygenase (COX)‐2: COX‐2 is a cardioprotective protein that alleviates ischemia/reperfusion injury and mediates the late phase of preconditioning. Cardiovasc. Res. 55, 506–519 (2002). [DOI] [PMC free article] [PubMed] [Google Scholar]
- 43. Anfossi, G. , Trovati, M. , Lanzio, M. , Mularoni, E. , Massucco, P. & Emanuelli, G. Effect of labetalol on human platelet function. Clin. Exp. Pharmacol. Physiol. 15, 437–448 (1988). [DOI] [PubMed] [Google Scholar]
- 44. Greer, I.A , Walker, J.J. , McLaren, M. , Calder, A.A. & Forbes, C.D. A comparative study of the effects of adrenoceptor antagonists on platelet aggregation and thromboxane generation. Thromb . Haemost. 54, 480–484 (1985). [PubMed] [Google Scholar]
- 45. Jürgensen, H.J. , Dalsgaard‐Nielsen, J. , Kjøller, E. & Gormsen, J. Effect of long‐term beta‐blockade with alprenolol on platelet function and fibrinolytic activity in patients with coronary heart disease. Eur. J. Clin. Pharmacol. 20, 245–250 (1981). [DOI] [PubMed] [Google Scholar]
- 46. Kral, J.G. , Åblad, B. , Johnsson, G. & Korsan‐Bengtsen, K. Effects of adrenaline and alprenolol (Aptin®) on blood coagulation and fibrinolysis in man. Eur. J. Clin. Pharmacol. 3, 144–147 (1971). [Google Scholar]
Associated Data
This section collects any data citations, data availability statements, or supplementary materials included in this article.
Supplementary Materials
FILE TITLES
Supplementary Figure S1 Tissue‐specificity of distinct target classes in four datasets.
Supplementary Figure S2 Size of predicted pathways before and after filtering in four datasets.
Supplementary Figure S3 Correlation between the size of a pathway and the number of drugs to which it is connected.
Supplementary Figure S4 Correlation between the number of connected tissues and the number of target proteins in the pathway.
Supplementary Figure S5 Tissue‐specificity of distinct ATC drug classes.
Supplementary Figure S6 Enrichment of different pathway categories in drug classes.
Supplementary Figure S7 Justification of choosing 0.775 as threshold of significant anticoagulation activity.
Supplementary Table S1 The protein target of drugs provided by Drugbank.
Supplementary Table S2 Pathways that were connected to multiple drugs.
Supplementary Table S3 Pathway categories enriched in different drug classes.
Supplementary Table S4 Importance score of features in the random forest models that predict four adverse events.
Supplementary Table S5 A summary statistics of drug ‐ tissue ‐ PharmGKB pathway connections in four datasets.
Supplementary Table S6 Drugs connected to Reactome or PharmGKB coagulation‐related pathways.
Supplementary Table S7 Twenty‐two manually curated coagulation‐related pathways.
Supplementary Table S8 The 2*2 contingency table of Fisher Exact Test.
Supplementary Table S9 Description of drugs in the unbiased screen.
Supplementary Table S10 Description of drugs selected for prospective validation.
Supplementary Table S11 Coagulation experiment results and bleeding side effects of drugs.
Supplementary Table S12 The tissue origin of cell lines.