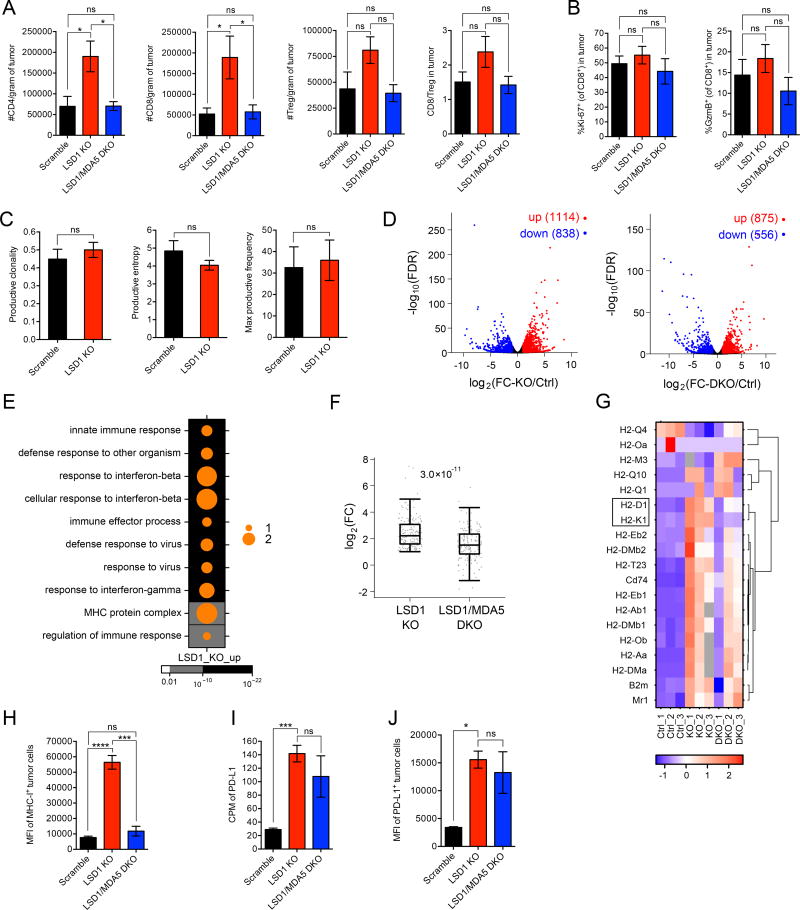
Figure 6. LSD1 inhibition enhances tumor immunogenicity.
(A) Tumor infiltrating lymphocytes (TILs) from transplanted B16 tumors (n=5 for scramble, n=5 for LSD1 KO and n=6 for LSD1/MDA5 DKO) in immunocompetent mice were analyzed by flow cytometry at day 14 post implantation when tumor sizes were comparable among the three groups.
(B) The expression of Ki-67 and GzmB by CD8+ TILs as in (A) was analyzed by flow cytometry.
(C) The clonality and entropy of CD8+ TILs isolated from transplanted B16 tumors (n=5 for scramble and n=3 for LSD1 KO) were analyzed by TCR sequencing.
(D–G) GFP-labeled B16 tumor cells (n=3 per group of scramble, LSD1 KO and LSD1/MDA5 DKO) were isolated from tumor-bearing immunocompetent mice and subjected to RNA-seq analysis. Differential gene expression was shown in volcano plots (D). Dots in red represent increased genes (log2(FC) > 1 and FDR < 0.05) and dots in blue represent decreased genes (log2(FC) < −1 and FDR < 0.05) in LSD1 KO versus scramble cells (left plot) or LSD1/MDA5 DKO versus scramble cells (right plot). GO analysis of up-regulated genes (log2(FC-KO/Ctrl) > 1 and FDR < 0.05) in LSD1 KO versus scramble cells was performed and top 10 terms were shown in a dot map (E). The up-regulated genes associated with top 10 GO terms (170 in total) were sorted out and log2(FC) of their expression in LSD1 KO and LSD1/MDA5 DKO versus scramble cells was plotted (F). All genes categorized in GO term “MHC protein complex” were displayed in a heatmap (G).
(H–J) Flow cytometry analysis of MHC-1 (H) and PD-L1 (J) expression and RNA-seq analysis of PD-L1 expression (I) by GFP-labeled B16 tumor cells (n=3 per group of scramble, LSD1 KO and LSD1/MDA5 DKO) isolated from tumor-bearing mice.
Data represent two independent experiments (A, B, H and J). Error bars represent SEM of individual mice per group in one experiment. *p < 0.05, ***p < 0.001, ****p < 0.0001, ns, not significant, as determined by unpaired t-test.
Also see Figures S6.

