

Abstract
Unlike white and brown adipose tissues, the bone marrow adipocyte (BMA) exists in a microenvironment containing unique populations of hematopoietic and skeletal cells. To study this microenvironment at the sub-cellular level, we performed a three-dimensional analysis of the ultrastructure of the BMA niche with focused ion beam scanning electron microscopy (FIB-SEM). This revealed that BMAs display hallmarks of metabolically active cells including polarized lipid deposits, a dense mitochondrial network, and areas of endoplasmic reticulum. The distinct orientations of the triacylglycerol droplets suggest that fatty acids are taken up and/or released in three key areas – at the endothelial interface, into the hematopoietic milieu, and at the bone surface. Near the sinusoidal vasculature, endothelial cells send finger-like projections into the surface of the BMA which terminate near regions of lipid within the BMA cytoplasm. In some regions, perivascular cells encase the BMA with their flattened cellular projections, limiting contacts with other cells in the niche. In the hematopoietic milieu, BMAT adipocytes of the proximal tibia interact extensively with maturing cells of the myeloid/granulocyte lineage. Associations with erythroblast islands are also prominent. At the bone surface, the BMA extends organelle and lipid-rich cytoplasmic regions towards areas of active osteoblasts. This suggests that the BMA may serve to partition nutrient utilization between diverse cellular compartments, serving as an energy-rich hub of the stromal-reticular network. Lastly, though immuno-EM, we’ve identified a subset of bone marrow adipocytes that are innervated by the sympathetic nervous system, providing an additional mechanism for regulation of the BMA. In summary, this work reveals that the bone marrow adipocyte is a dynamic cell with substantial capacity for interactions with the diverse components of its surrounding microenvironment. These local interactions likely contribute to its unique regulation relative to peripheral adipose tissues.
Keywords: bone marrow, ultrastructure, adipocyte, fat, hematopoiesis, erythropoiesis, anemia, bone marrow adipose tissue
Graphical abstract
1. Introduction
In biology, structure and function are inexorably linked. Post-world war II, technological advancements brought high-resolution transmission electron microscopy into the laboratory, facilitating a renaissance of structural observations which have since informed our understanding of adipocyte function. In addition to defining the subcellular characteristics of peripheral white adipose tissue (WAT) adipocytes (1–6), work by Loncar et al from 1987 to 1991 (2–4) identified and characterized what we currently refer to as beige (7) or BRITE (8) adipocytes. As with more recent studies (9), Loncar discovered that these multilocular, mitochondria-rich fat cells accumulated in small mammals after cold exposure (2–4).
Around the same time, Tavassoli undertook the first electron microscopic characterization of the bone marrow adipocyte (BMA) (10,11). His work revealed that the BMA is ultrastructurally similar to WAT with three key distinctions. First, while the WAT adipocyte has been described as being ‘embraced’ by a network of collagen fibers (6), the bone marrow adipose tissue (BMAT) adipocyte lacks a collagen support system (10,11). Second, vacuoles were notable in the lipid droplet during BMAT, but not WAT, adipocyte maturation (10,11). Third, BMAs did not accumulate glycogen during development (11). It was also noted that the development of the BMA is much slower than adipocytes in WAT, which may account for the reduced glycogen deposits (11). A comparison of the known ultrastructural features of white, beige, and bone marrow adipocytes is summarized in Table 1.
Table 1. Ultrastructural features of adipocytes.
| Ultrastructural Feature |
White adipocyte | Beige adipocyte | Bone marrow adipocyte |
|---|---|---|---|
| Cytoplasm | Thin rim around lipid | Evenly distributed around lipid and organelles | Thin rim around lipid |
| Lipid | Large central unilocular droplet, smaller lipid droplets in cytoplasm | Small lipid droplets dispersed throughout cytoplasm | Large central lipid globule with smaller fat globules noted in the peripehral cytoplasm |
| Surrounding matrix | Collagen-rich; adipocytes are "embraced" by a network of collagen fibers | Vastly reduced collagenous matrix relative to WAT | Lack of association with collagen, basal lamina positive for PAS and reticulin stains |
| Nucleus | Displaced toward periphery, crescent or triangular shape. Peripheral chromatin condensation along the nuclear membrane and in association with nucleoli. | Centrally located. Peripheral chromatin condensation with a central euchromatic area and nucleolus. | Displaced toward periphery, crescent or triangular shape. Peripheral chromatin condensation along the nuclear membrane and in association with nucleoli. |
| Mitochondria | Filamentous and spherical with rare, short, or gently wavy cristae | Numeous, large mitochondria with closely packed, straight cristae. Increased mitochondrial volume (3.7-fold vs WAT). | Dense, usually spherical mitochondria |
| Endoplasmic Reticulum | Mostly smooth ER | Cisternae of rough ER | Some profiles of rough ER |
| Innervation | Unmyelinated nerve fiber with Schwann cells and 'naked' nerve fibers can be found adjacent to the membrane of some cells (~5% of adipocytes are innervated) | Every adipose cell was in close contact with one or more nonmyelinated nerve fibers (often 2, 3, or more contacts per cell) (100% of adipocytes are innervated) | Unknown |
| Vasculature | Adjacent to capillaries (~0.4 apilllaries/cell) | Adjacent to capillaries (~0.8 capillaries/cell) | Adjacent to sinusoidal endothelium |
| Contacts between adipocytes | Very limited (Loncar 1988 found only one direct contact between WAT adipocytes out of 2000 total cells) | Appearance of gap junction connections between adipocytes which connect nearly all cells to one another | Unknown |
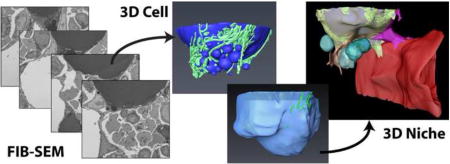
Despite its histologic and ultrastructural similarity to the WAT adipocyte, both recent and historic work reveals that the function and regulation of BMAT is often unique (reviewed in (12,13)). For example, BMAs counterintuitively accumulate with chronic caloric restriction while WAT is lost (14–16). By contrast, unlike WAT, BMAT responds readily to experimentally-induced anemia by depletion of its intracellular lipid stores (17,18). We hypothesize that this is mediated, at least in part, by its distinct microenvironmental context. With the advent of focused ion beam scanning electron microscopy (FIB-SEM), we are now able to study cells within their native microenvironment in three-dimensions at nanometer resolution. Our study uses this technology to further explore the interactions between BMAs and cells within the hematopoietic and skeletal niche, revealing novel relationships and informing our understanding of BMAT function within bone.
2. Materials and Methods
2.1 Animals
All animal procedures were approved by the animal use and care committee at Washington University (Saint Louis, MO, USA). Animals were housed at 22°C on a 12-hour light/dark cycle with daily care by the Division of Comparative Medicine.
2.2 FIB-SEM sample preparation, scanning, and dataset information
2.2.1 Sample Preparation Protocol #1
Two datasets were generated with this protocol: (Dataset #1, Fig.1–5, Supp Fig.1–2) C57BL/6J mouse proximal tibial metaphysis, 1,329 serial electron micrographs and (Dataset #2, Fig.6) C57BL/6J mouse tail vertebrae, 967 serial electron micrographs. An adult male C56BL6/J mouse (Jackson Labs Stock: 000664) was sedated with ketamine/xylazine and perfused with 10 mL saline followed immediately by 10 mL of fixative cocktail (0.15 M cacodylate buffer, 2.5% glutaraldehyde, 1.25% PFA, and 2.3% picric acid). The tibia and C3 tail vertebrae were isolated and post-fixed overnight at 4°C. Tissues were washed in water for 30-minutes prior to decalcification in 14% EDTA, pH 7.4 for 3-days at 4°C with daily changes of EDTA. A fresh razor blade was used to section the tibia horizontally to isolate the proximal metaphysis. The C3 tail vertebrae was processed in the same way to isolate the middle third. Decalcified tissues were washed in water for 30-minutes prior to submission for resin embedding. Fixed and decalcified bone segments were rinsed in cacodylate buffer three times for 10 minutes each, and subjected to a secondary fixation for one hour in a solution of 1% osmium tetroxide/1.5% potassium ferrocyanide in cacodylate buffer on ice for one hour, rinsed in ultrapure water 3 times for 10 minutes each, and stained in an aqueous solution of 2% uranyl acetate for one hour. The samples were then again washed in ultrapure water 3 times for 10 minutes each and dehydrated in a graded acetone series (50%, 70%, 90%, 100% ×2) for 10 minutes in each step. Tissues were then infiltrated with microwave assistance (Pelco BioWave Pro, Redding, CA) into LX112 resin and cured in an oven at 60°C for 48 hours.
Figure 1. Basic ultrastructure and vascular connections of the tibial bone marrow adipocyte.

(A) The ultrastructure of a bone marrow adipocyte from the proximal tibial metaphysis of a wild type C57BL/6J mouse was reconstructed from a FIB-SEM dataset containing 1,329 independent images (Dataset #1). BMA = bone marrow adipocyte, BV = blood vessel, L = lipid droplet. (B) The reconstruction revealed a large lipid droplet and a multitude of smaller lipid droplets (blue). The smaller lipid droplets were enmeshed by a dense network of mitochondria (green). (C) The majority of the smaller lipid droplets were polarized toward a sinusoidal blood vessel (red). The adipocyte cytoplasm (yellow) was immediately adjacent to the endothelial cell of the blood vessel. Inset: view from the interior of the blood vessel toward the adipocyte. * = cytoplasm of BMA. Imaging location: C57BL/6J mouse, proximal tibia. (D) Consistent with the EM study, immunohistochemical analysis of the bone marrow shows that perilipin positive bone marrow adipocytes (red) consistently make at least one connection with an endomucin positive blood vessel (green, arrowheads). DAPI in blue. Representative image from an 8-month-old male C57BL/6J mouse (N = 3). See also Supplementary Video 1.
Figure 5. Interactions between BMAT adipocytes and erythroblast islands.

(A) Electron microscopic image of the bone marrow adipocyte (BMA) microenvironment showing the core phagocytic reticular cell/macrophage of the erythroblast island (psuedocolored green). Reticulocytes, immature red blood cells which lack nuclei but retain some cellular organelles, are pseudocolored in red. Maturing erythroblasts which have not yet lost their nuclei are in light blue. In this dataset, the core macrophage was filled with cellular debris due to phagocytosis of the reticulocyte nuclei. (B) Magnified inset shows the close association between the phagocytic reticular cell and the BMA. Imaging location: C57BL/6J mouse, proximal tibia (panel A,B; Dataset #1). (C) In the C3H dataset, another phagocytic reticular cell was observed. However, this time the associated erythroblasts had not yet lost their nuclei. Instead of being filled with debris, the core macrophage contained an extensive network of small lipid droplets (L). The macrophage extended a process which appeared to be attached to the BMA (white arrowheads). A cell of the myeloid/granulocyte lineage was also noted to be immediately adjacent to the BMA. (D) 3D reconstruction of the BMA and erythroblast island in panel C. Imaging location: C3H/HeJ mouse, proximal tibia (panel C,D; Dataset #3). See also Supplementary Video 2.
Figure 6. Constitutive bone marrow adipocytes in the tail vertebrae.

(A) 3D reconstruction of a BMAT adipocyte from the tail vertebrae in a region of dense, confluent adipocytes – also referred to as ‘constitutive’ bone marrow adipose tissue. Lipid in blue, mitochondria in green. Imaging location: C57BL/6J mouse, tail vertebrae (Dataset #2). (B,C) In the C3H dataset, a dark precipitate was observed around the lipid droplets. In panel B three adipocytes converge. The nucleus (N) of the top adipocyte is compressed by a secondary lipid droplet (L) into a dumbbell-like shape. In panel B, the nucleus has a more conventional triangle/crescent-like morphology. The nucleus is surrounded by prominent areas of endoplasmic reticulum (ER) and occasional mitochondria (M). Imaging location: C3H/HeJ mouse, tail vertebrae (Dataset #4).
2.2.2 Sample Preparation Protocol #2
Three datasets were generated with this protocol: (Dataset #3, Fig.5,7) C3H/HeJ proximal tibial metaphysis, 1,592 serial electron micrographs, (Dataset #4, Fig.6) C3H/HeJ tail vertebrae, 2,433 serial electron micrographs and (Dataset #5, Fig.8) C3H/HeJ tail vertebrae with immunostaining of tyrosine hydroxylase positive neurons, 2,500 serial electron micrographs. An adult male C3H/HeJ mouse (Jackson Labs Stock: 000659) at 12-weeks of age was sedated with ketamine/xylazine and perfused with 10 mL saline followed immediately by 10 mL of fixative cocktail (0.15 M cacodylate buffer, 0.4% glutaraldehyde, 4.0% PFA, and 2.0% picric acid). The concentration of glutaraldehyde was decreased in the fixative to facilitate later immunostaining. The rest of the preparation is the same a 2.2.1. apart from the addition of 0.1 M imidazole to the osmium tetroxide staining solution. This was added to attempt better stabilization of the lipid-rich tail vertebrae samples. However, we did not observe any differences when compared to the samples without imidazole.
Figure 7. The BMA and bone interface #1.

The tibial bone marrow adipocyte (BMA) extends a cell process toward an active osteoblast-appearing cell (orange pseudocolor). The BMA nucleus (N) is crescent shaped with a ring of condensed heterochromatin and an associated nucleolus. The BMA cell extension contains prominent endoplasmic reticulum (ER) and lipid droplets (L) and is near to many smaller vesicles in the extracellular space (inset). The BMA is also associated with an adjacent blood cell of the myeloid/granulocyte lineage (M/G). Several additional granulocytes are noted in the surrounding bone marrow. Imaging location: C3H/HeJ mouse, proximal tibia (Dataset #3).
Figure 8. The BMA and bone interface #2.

(A) Immunostaining with cobalt-nickel precipitation for analysis of tyrosine hydroxylase positive sympathetic nerves (arrowheads) in tail vertebrae bone (B). Dark black precipitate highlights clusters of neurons in the vertebral space and delicate branches which extend onto the bone marrow adipocyte (BMA) and toward the bone interface (black arrowheads). (B) 2D image from a FIB-SEM dataset showing nerves (green *) near the bone surface which closely approximate an arteriolar blood vessel (BV). The flattened, crescent shaped nucleus (n) of a lipid-droplet (L) filled cell is present atop a flattened osteoblast (Ob). The osteoblast sits on layers of collagen-rich osteoid (Os) and mineralized bone (B). (C) The tysosine hydroxylase positive sympathetic nerves form a dense mesh around the artery. (D) A single nerve fiber extends from the mesh toward the surface of the BMA and terminates in the region of the osteoblast/BMA interface. (E) The osteoblast surface is immediately adjacent to a lipid filled cell with nucleus ‘n’ which may represent a cytoplasmic extension of the larger, unilocular BMA. Imaging location: C3H/HeJ mouse, tail vertebrae + immunostain (Dataset #5).
2.3 FIB-SEM scanning and analysis
Following resin curing, tissue blocks were mounted onto SEM pins with silver epoxy and surface polished with a diamond trim tool (Diatome Trim 90, Hatfield, PA). Blocks were then sputter coated with 10 nm of iridium (Leica ACE 600, Vienna, Austria) with rotation on a planetary stage to ensure uniform coating of the entire block. Following coating, samples were then loaded into a FIB-SEM (Zeiss Crossbeam 540, Oberkochen, Germany) and the cell of interest was located by secondary electron imaging at 5 KeV. Once a region was identified, the sample was prepared using the ATLAS 3D nanotomography routine (19). In short, a platinum pad was deposited on a 50 µm × 50 µm region of interest at 30 KeV and 15 nA. Three vertical lines for focus and stigmation correction and two angled lines for 3D-tracking were milled into the platinum pad at 100 pA, then filled with carbon at the same current to enhance the tracking/alignment marks, followed by an additional deposition of a protective carbon pad at 15 nA. A rough trench 50 µm deep was then milled at 30 nA and polished at 3 nA. Once polished, face detection, focusing, and 3D-tracking were all performed on the fiducial marks that were milled into the platinum pad. Imaging was performed at 1.75 KeV and 1.7 nA using the EsB detector with a grid voltage of 1000 V. The block was milled at a current of 700 pA with 20 nm slices and 2000 × 2000 pixel images were acquired at a resolution of 20 nm/pixel with a dwell of 7 µs and a line average of 3 for a total z-depth of approximately 40 µm. Images were then segmented and aligned using Amira 6 (Thermo Fisher, Hillsboro, OR).
2.4 Immunostaining
2.4.1. Frozen sections for fluorescent immunohistochemistry
Male 8-month old C57BL/6J mice were perfused with 10% neutral-buffered formalin. Isolated femurs and tibiae were post-fixed for 24-hours prior to decalcification in 14% EDTA, pH 7.4. Decalcified specimens were embedded in OCT mounting media and sectioned at 100 µm on a cryostat. Tissue sections were permeabilized for 10 min in 0.2% Triton-X 100 in phosphate buffered saline (PBS) and blocked for 1-hour with 10% donkey serum in TNT buffer (0.1 M Tris-HCl pH 7.4, 0.15 M sodium chloride, 0.05% Tween-20). Primary antibody cocktail (1:400 perilipin, Progen GP29; 1:500 endomucin, BioLegend, 14-5851) was made in TNT buffer and incubated for 48-hours at 4°C. Secondary antibody cocktail (1:200 donkey anti-guinea pig Cy3; 1:200 donkey anti-rat Alexa 488; Jackson ImmunoResearch) was made in TNT buffer and incubated for 24-hours at 4°C. All washes between steps were performed in TNT buffer. Nuclei were counterstained with 1 µg/mL DAPI (Sigma, Saint Louis, MO, USA). Slides were imaged on an Olympus FV1200 confocal microscope.
2.4.2. Vibratome sections for immuno-electron microscopy
A vibratome was used to take 300 µm thick sections from the center of the C4 tail vertebrae prepared as in section 2.2.2. The Vectastain® Elite ABC kit (Vector Laboratories) was used to stain the tyrosine hydroxylase positive sympathetic neurons for immuno-electron microscopy. Specifically, sections were washed in TNT buffer prior to quenching endogenous peroxidases with 0.3% hydrogen peroxide in PBS for 15-minutes. Sections were washed 3× in TNT after peroxidase inhibition prior to blocking for 2-hours at room temperature in kit-specific reagents and subsequent incubation with primary antibody (1:1000 dilution in TNT, tyrosine hydroxylase, Millipore AB152) for 4-days at 4°C. After washing 3× in TNT sections were incubated with the kit-provided secondary antibody overnight at 4°C. After the secondary, sections were washed 3× in TNT and 1× in phosphate buffered saline (PBS) and then incubated in the kit-provided ABC reagent for 45 minutes. After washing 3× in PBS staining was visualized with metal enhanced-DAB (Metal Enhanced DAB Substrate Kit, Thermo scientific). After a final wash, stained sections were returned to fixative at 4°C and submitted for resin embedding, imaging and analysis as described above.
3. Results
3.1 The vascular niche of the bone marrow adipocyte
The BMA of the proximal tibia has an extensive network of spherical and filamentous mitochondria (Fig.1). The mitochondria interweave around and between smaller lipid droplets, forming well-defined regions of cytoplasmic activity which are positioned spatially toward the sinusoid or the into regions of hematopoietic cells (Fig.1B,C). Consistent with previous work in rabbits (10), we observed that BMAT adipocytes in the tibia of mice are closely associated with the sinusoidal vascular endothelium in C57BL/6J and C3H/HeJ mice (Fig.1 and data not shown). Indeed, based on immunohistochemical stains, it appears that every BMAT adipocyte in the proximal tibia has at least one connection to an endomucin-positive sinusoid (Fig.1D).
In the area where the BMA meets the blood vessel, the vascular endothelial cell exhibits marked cytoplasmic swelling that is rich in organelles (Fig.2A). This region of the endothelial cell extends membrane-covered cytoplasmic processes into the BMA - similar to fingers being pushed into the surface of balloon (Fig.2B). The endothelial extensions can be observed to terminate adjacent to small triacylglycerol deposits within the BMAT adipocyte cytoplasm (Fig.2B). It is also notable that in areas of decreased cell-cell interactions, a loose extracellular matrix can be observed between the BMAT adipocyte and the surface of the endothelial cell in C57BL/6J (Supplementary Fig.1) and C3H/HeJ mice (data not shown). This loose matrix is also present between endothelial cells and pericytes and between pericytes and the BMAT adipocyte.
Figure 2. Interactions between the vascular endothelial cell and the BMAT adipocyte.

(A) The bone marrow adipocyte (BMA) is immediately adjacent to the endothelial cell-lined (EC) vascular sinusoid. Extravasated blood cells are noted in the lumen. The endothelial cell has a cytoplasmic swelling adjacent to the bone marrow adipocyte (boxed inset). The cytoplasm in the region of the swelling contains many organelles and extends cellular processes into the surface of the BMAT adipocyte. N = nucleus. BV = blood vessel. P1 = pericyte. (B) In this series of images we follow the endothelial cell process marked by the yellow asterisk (*) as one moves through the dataset from slice 207 to slice 220, a distance of approximately 0.25 µm. EC = endothelial cell, psuedocolored in red. BMA = bone marrow adipocyte, blue. M = mitochondria. The dashed line represents the path of the cell process which is currently out of frame. Imaging location: C57BL/6J mouse, proximal tibia (Dataset #1).
3.2 Perivascular cells spatially restrict cell-cell interactions with BMAT adipocytes
In the tibial bone marrow of the B6 male mouse, pericyte-like cells enveloped the BMA with their flattened network of cytoplasmic extensions (Fig.3). The pericytes themselves had large nuclei with an outer ring of condensed chromatin, prominent nucleoli, and loosely organized nuclear granules. The region of cytoplasm nearest the nucleus contained an extensive network of endoplasmic reticulum and rounded mitochondria with prominent cristae. Occasional mitochondria were also observed in the thinnest regions of the cytoplasmic extensions which encircled the BMAT adipocyte. Lipid inclusions were noted near the nucleus of one of the pericytes, on the side closest to the BMA (Fig.3A). Of note, this type of perivascular cell lining of the BMA was not present in the tibial dataset from the C3H mouse (data not shown). Thus, the presence of perivascular cells is a selective feature of certain BMAT niches. When present, the pericytes appear to channel the BMAT adipocyte toward the vascular endothelial cells, seemingly serving to dock the adipocyte onto the blood vessel. The perivascular cell extensions also appear to restrict the cell-cell interactions of the mature BMAT adipocyte with surrounding cells.
Figure 3. Perivascular cell support of the BMAT adipocyte.

(A,B) EM images of perivascular cell #1 and #2 (P1 and P2) around the BMAT adipocyte. These cells border the BMAT adipocyte and seem to dock it to the sinusoidal blood vessel (BV). The P1 perivascular cell contains lipid droplets (arrowhead). (C) Composite image of the adipocyte (lipid in blue, mitochondria “M” in green, cytoplasm in semitransparent yellow), vascular sinusoid (red), perivascular cells (P1 in pink, P2 in orange) and blood cells (turquoise). (D,E,F) 3D reconstruction of perivascular cells #1 and #2 and the BMAT adipocyte with the blood vessel and hematopoietic cells removed. ‘BV’ denotes the spatial positioning of the blood vessel as the 3D image is rotated. BV = sinusoidal blood vessel. BMA = bone marrow adipocyte. L = lipid droplet. Imaging location: C57BL/6J mouse, proximal tibia (Dataset #1).
3.3 BMAT adipocytes interact with hematopoietic cells within the bone marrow
As discussed above, in the B6 tibia we observed polarization of smaller BMAT lipid droplets toward the hematopoietic microenvironment. At first glance, it appeared that the BMAT adipocyte was interacting with a mononuclear blood cell of the developing erythroid lineage. However, upon closer examination of the 3D dataset, it became apparent that the BMA was actually interfacing with a phagocytic reticular cell, also known as a core macrophage of the erythroblast island (Fig.4A,B). Erythroblast islands consist of central macrophage-like nurse cells that provide support for maturing erythroblasts and help to traffic them toward the sinusoids for later release of mature erythrocytes (20,21). Maturing erythroblasts and anuclear erythrocytes (aka. reticulocytes) were commonly noted nearby the tibial BMAT adipocyte (Fig.5A,B). The association between the BMAT adipocytes and erythroblast islands was also notable in the C3H mouse tibial BMAT microenvironment. In the C3H tibia dataset, the cells of the erythroblast island were more immature and had not yet lost their nuclei (Fig.5C). The core phagocytic reticular cell was also unique in that it contained an extensive network of lipid droplets (Fig.5C,D). It was associated with an impressive number of hematopoietic cells – 54 in total. Of these, 47 cells (87%) were nucleated erythroblasts, one cell had large granules consistent with that of a basophil, and six cells had smaller granules like those of the myeloid/granulocyte lineage (Supplementary Figure 2). The cytoplasm of the core macrophage appeared to adhere directly to the BMAT adipocyte (Fig.5C,D).
Figure 4. The BMAT hematopoietic cell interface #1.

(A,B) The tibial rMAT adipocyte was observed to interact with a phagocytic reticular cell (inset, green pseudocolor) adjacent to a mononuclear erythroblast (blue) with polarization of lipid droplets (‘1’) toward the hematopoietic microenvironment. Membrane remodeling by both the adipocyte and the erythroblast-supporting macrophage was noted at the site of interaction (white arrowhead). A perivascular cell extension was also quite prominent in this area (black arrowheads, orange). P1 = pericyte #1. P2 = pericyte #2. Composite image of the adipocyte is the same as Figure 3 (lipid in blue, mitochondria “M” in green, cytoplasm in semi-transparent yellow). (C) In an area without pericytes, the BMAT adipocyte interfaced directly with a large hematopoietic cell of the myeloid/granulocyte lineage (M/G). A small cytoplasmic extension with lipid droplets extended from the BMA to make contact with the blood cell (inset). See also supplementary video #2. Imaging location: C57BL/6J mouse, proximal tibia (Dataset #1).
In addition to interactions with phagocytic reticular macrophages of the erythroblast islands, the BMA membrane was observed to be directly adjacent to that of maturing hematopoietic cells of the myeloid/granulocyte lineage in both B6 (Fig.4C) and C3H mice (Fig.5C). These interactions were relatively common. For example, the visible portion of the C3H BMA within the tibia (~30% of the cell) was directly associated with 20 individual blood cells, in addition to core macrophages from two erythroblast islands – which then extended to support many additional erythroblasts (blue cells in Fig.4B and Fig.5).
3.4 Characteristics of bone marrow adipocytes from regions of constitutive bone marrow adipose tissue in tail vertebrae
Using our current methods, the imaging quality in regions of the tail vertebrae where the BMAT adipocytes were confluent (aka. ‘constitutive’ BMAs) was poor, allowing for only a cursory overview of the cells and their microenvironment (Fig.6A). Specifically, the edges of the central lipid globules were covered by an electron dense precipitate, which obscured smaller regions of compressed cytoplasm (Fig.6B). Larger cytoplasmic regions (ex. in areas of nuclei) could still be assessed. Based on what we could see, constitutive BMAT adipocytes have very large central lipid droplets, which compress their crescent-shaped nuclei to the periphery. In one of the cells, a large, secondary lipid body compressed the nucleus from the opposite direction, giving it a ‘dumbell’ like shape (Fig.6B, dotted white line). Mitochondria were still present and an network of endoplasmic reticulum was occasionally observed (Fig.6C). Very few intervening cells or structures were noted between the BMAT adipocytes. These findings were consistent in both B6 and C3H tail vertebrae datasets.
3.5 Characteristics of the BMAT adipocyte niche at the bone interface
Two regions of BMAT and bone lining cells were captured in our study. The first, in the C3H tibia, revealed extension of BMA cytoplasm toward an active osteoblast (Fig. 7, osteoblast in orange). In this region, the BMA cytoplasm was filled with sheets of endoplasmic reticulum and several small lipid droplets (Fig.7, inset). Nearby, as observed in other regions (Fig.4C, 5C) the BMA makes direct contact with two hematopoietic cells (Fig.7).
Images from the second BMA-bone interface, in the C3H tail vertebrae, captured an area of relatively quiescent-appearing osteoblasts atop collagen-rich osteoid and mineralized matrix (Fig.8). This dataset was immunostained for tyrosine hydroxylase with subsequent precipitation of an electron dense, cobalt-nickel precipitate onto stained sympathetic nerve fibers. Prior to resin embedding we used confocal microscopy to visualize these fibers in the whole thickness section of the tail vertebrae. Confocal analysis revealed dense, spiral shaped clusters of sympathetic neurons (Fig.8A, arrowheads). The appearance was consistent with previous reports of perivascular sympathetic innervation in bone (22). In select cases, these clusters of neurons sent delicate, branching terminal offshoots toward the bone surface and BMAT adipocytes (Fig.8A, inset). Using the FIB-SEM, this interface was examined at 20 nm resolution. We confirmed that the sympathetic neurons formed a dense network around the arteriolar blood vessel (Fig.8B,C). A small neuron also extended onto the surface of an adjacent BMA and terminated in the region of the BMA/bone interface (Fig.8D). At this location, though collagen-rich osteoid was observed, the osteoblast lining cells appeared relatively flattened and quiescent (Fig.8E). Between the osteoblast layer and the large BMA lipid globule, there was a third cellular region. This cytoplasmic region had an elongated, crescent-shaped nucleus and was filled with many small lipid droplets, some of which appeared to be budding directly from the large unilocular droplet of the BMA (Fig.8B,E). Based on our analysis of the full dataset, this seemed like it could be an extension of the BMA itself. However, due to some distortion in the dataset, this point remains a bit unclear. Regardless, this clearly demonstrates that smaller lipid bodies tend to cluster near to the osteoblast layer and in regions of sympathetic innervation.
4. Discussion
This work reveals several local contexts at the vascular, hematopoietic, and osteogenic interfaces in which BMAs exist and function. The proximity of the BMAT adipocyte to surrounding cells likely contributes to its physiology, as evidenced, for example, by polarization of triacylglycerol deposits and cellular organelles toward key interfaces. This may be comparable to small lipid droplets which accumulate within peripheral WAT adipocytes (23). These deposits are generally located near the cell membrane and provide a larger surface area for lipases, facilitating rapid increases in both the rate and magnitude of lipolysis (23). In BMAT adipocytes, localization of lipid droplets to the cell surface could facilitate the egress and spatial partitioning of free fatty acids from BMAs to target cells through lateral transfer across defined interfacial planes of adjacent membranes (5), contributing to its putative role as a local regulator of energy partitioning.
4.1 Bone marrow adipocytes and hematopoiesis
The reach of the BMAT adipocyte is extensive. Based on the C3H proximal tibia dataset, we estimate that one BMA was capable of interacting with in excess of 100 hematopoietic cells through both direct cell-cell contact and indirect signals via binding with the core macrophage of erythroblast islands (20,21). Bone marrow generates 400 to 500 billion cells per day in adult humans (0.5 to 1.5 billion in mice) – regenerating approximately half of the circulating cellular content (reviewed in (24)). Thus, the incorporation of a cellular energy reserve into the hematopoietic niche seems remarkably logical. Indeed, this is evolutionarily conserved. Adipocytes have been present within the hematopoietic marrow since the relegation of hematopoiesis to the skeleton in bony fishes, amphibians and reptiles (reviewed in (25)). Lymph nodes also have a unique perinodal adipocyte reserve which supports lymphogenesis and, like BMAT, is disassociated from systemic energy demand (26,27).
Our imaging implies that BMAs are spatially positioned to influence both erythropoiesis and myelopoiesis. The clinical importance of this was recently emphasized. Specifically, disruption of the BMAT niche during acute myeloid leukemia resulted in impaired myelo-erythroid maturation (28). Restoration of BMAs with a PPARƴ agonist helped to resolve this defect in hematopoiesis (28). Erythrocytes develop and mature within erythroblast islands (21). However, despite their energy demands, immature islands are often distant from bone marrow sinusoids (20). Instead, they migrate toward the sinusoid as erythrocyte maturation occurs (20). Thus, when present in the niche, BMAT adipocytes may help to shuttle energy to distant, immature erythroid islands, supporting the maturation of red blood cells. In times of acute demand, BMAT lipid could also be quickly liberated to provide fuel for excess red blood cell synthesis. This is consistent with previous studies in experimental animals which showed rapid decreases in BMAT adipocyte size during reactive red blood cell formation after phenylhydrazine-induced anemia or severe blood loss (17,29). This may also explain the results of a recent report showing that treatment with erythropoietin, a potent stimulant of erythrocyte maturation, markedly reduced BMAT in chow and high-fat diet fed mice, and inhibited the increase in BMAT with high-fat feeding (30). Future characterization of this BMA/hematopoietic interface is needed to identify BMAT-derived factors, for example SCF (31), which contribute to blood cell production. Conversely, more work is needed to define signals of hematopoietic origin which regulate BMA formation and function.
4.2. Marrow adipocytes and bone formation
The complexities of the relationship between BMAT and bone have been reviewed elsewhere (32). In addition to extensive interactions with hematopoietic cells, we observed polarization of BMA lipid droplets and cytoplasmic organelles towards vascular endothelial cells and areas of osteoblasts. Our work provides three key insights about the relationship between BMAT and bone. First, active osteoblasts may receive protein or lipid signals from nearby BMAT adipocytes, as evidenced by polarization of regions of endoplasmic reticulum and triacylglycerol deposits. Second, BMAs may provide fatty acids directly to bone lining cells. Third, the sympathetic nervous system may function to coordinate interactions at the BMAT/bone interface
4.3 The bone marrow adipocyte progenitor
In 1978, Biermann et al described the ultrastructure of the various subtypes of reticulum cells in the bone marrow (33). These were defined as the network of cells whose processes build a framework upon which all other activity in the bone marrow proceeds. They have also been referred to as stromal cells. Type I fibrous reticulum cells were defined as having extensive cellular processes with filaments of 4 to 8 nm in diameter that are characteristically located near the blood sinus in the bone marrow. By contrast, type II fibrous reticulum cells had serpentine filaments of 10 nm in diameter and a multiplicity of interdigitating cell processes. Type II fibrous reticulum cells often contained neutral fat bodies and reversible conversion to adipocytes was assumed (33). This description is consistent with the lipid-containing perivascular cell observed in Figure 3 and matches current literature which pinpoints pericytic progenitors as a key source of bone marrow adipocytes (34,35).
4.4 Innervation and vascularization of the BMAT niche
As previously reported (10), we also observed that BMAs are closely associated with the sinusoidal vasculature. This location could facilitate efficient uptake and storage of fatty acids from the circulation and subsequent directed release to cells within the bone marrow. This type of pattern is exemplified in Figures 1 and 2, where smaller lipid droplets are polarized both toward the vascular sinusoid and toward an area of hematopoietic cell interaction. By contrast, in Figure 8 we observed BMAT adipocytes adjacent to an artery. Unlike the endothelial niche, features of the arterial niche function to maintain quiescence of local cells (36). Polarization of BMA lipid droplets toward the arterial space was not prominent. Instead, a sympathetic neuron branched from the vaso-regulatory neural meshwork to terminate in a region of osteoid synthesis. A lipid droplet-filled cell and an adjacent adipocyte were also observed, suggesting that neural stimulation may help to coordinate the BMAT and bone interface at some sites.
4.5 Differences between proximal tibia and tail vertebrae
In addition to occurring in areas of hematopoietic bone marrow, BMAs also form in areas of the skeleton that are relatively devoid of hematopoiesis (25). So, what role could these cells play and are they distinct from the BMAT adipocytes which interface with hematopoietic cells? The concept of ‘regulated’ and ‘constitutive’ BMAT adipocytes has been discussed previously, however, their implications for skeletal and systemic homeostasis remain unclear (12,37). Our work confirms that in regions of constitutive BMAs, the adipocytes are packed closely with one another with very little intervening between them. Though mitochondria, endoplasmic reticulum, and small triacylglycerol deposits were observed in the cytoplasm, overall, there appeared to be less than what was present in the tibial BMAT adipocytes.
4.6. Limitations
These results are based on the analysis of 8,821 electron micrographs from five independent FIB-SEM datasets across mice of two different strains (B6 and C3H). Thus, though we are confident in the qualitative results, the extent to which each niche feature exists quantitatively within a pool of BMAT adipocytes remains unknown. In addition, we were unable to examine the membrane architecture (i.e. presence of caveolae), the presence of ribosomes on the endoplasmic reticulum, or the phospholipid covering that is characteristic of adipocyte lipid droplets (38). Higher resolution electron micrographs or alternate techniques such as cryo-EM are needed to overcome these limitations. Lastly, we are still working to develop protocols to promote optimal sample stabilization and image quality in regions of confluent adipocytes. Despite these limitations, this work provides a robust overview of the unique cellular and ultrastructural features of the BMA and its niche.
5. Conclusions
These images provide a unique opportunity to visualize the native bone marrow adipocyte within its skeletal niche. In addition to confirming previous results from 2D EM studies, our images strongly imply that BMAs actively participate in physiologic energy partitioning and signaling within the skeletal microenvironment. This appears to be key for interactions of BMAT adipocytes with cells of the hematopoietic and osteogenic lineages. In addition, we’ve identified a subpopulation of BMAs that is innervated by the sympathetic nervous system. The main limitation of this study is its focus on healthy rodent adipocytes. Future work is needed to extend these results in humans and to determine whether maladaptation of BMAT with disease leads to relevant ultrastructural changes in the BMA niche.
Supplementary Material
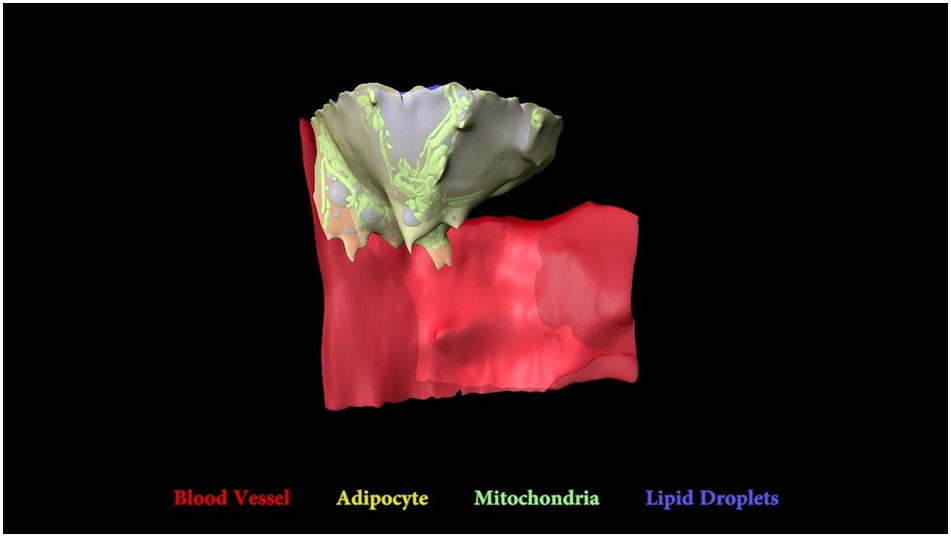
General characteristics of the tibial bone marrow adipocyte and its interactions with a sinusoidal blood vessel. Blood vessel (red), adipocyte cytoplasm (yellow), lipid (blue), mitochondria (green). Imaging location: C57BL/6J mouse, proximal tibia (Dataset #1).
Interaction of a bone marrow adipocyte with an erythroblast island. Bone marrow adipocyte cytoplasm (yellow), lipid (blue), nucleus (dark blue). Erythroblast island core macrophage (green), macrophage lipid (blue), macrophage nucleus (dark green). Erythroblast cells (light blue). Imaging location: C3H/HeJ mouse, proximal tibia (Dataset #3).
Innervation of the bone marrow and osteoblast niche. Tyrosine hydroxylase positive sympathetic nerves (green), arteriolar blood vessel (red), bone marrow adipocyte lipid (dark blue), mineralized bone (orange), osteoid (transparent orange), osteoblast layer (blue with dark blue nuclei), lipid-filled cell (yellow cytoplasm with blue lipid droplets and dark, circular nucleus). Imaging location: C3H/HeJ mouse, tail vertebrae (Dataset #5).
A loose, fibrous extracellular matrix can be observed between the bone marrow adipocyte (BMA) and the surface of the endothelial cell (EC) (arrowheads). This loose matrix is also present between endothelial cells and pericytes and between pericytes and the BMAT adipocyte. Imaging location: C57BL/6J mouse, proximal tibia (Dataset #1).
The erythroblast in the C3H tibial dataset was associated with an impressive number of hematopoietic cells – 54 in total. Of these, 47 cells (87%) were nucleated erythroblasts (Eb), one cell had large granules consistent with that of a basophil (B), and six cells had smaller granules like those of the myeloid/granulocyte (M/G) lineage.
Highlights.
Bone marrow adipocytes display hallmarks of metabolically active cells including multiple lipid droplets and a dense mitochondrial network.
Remodeling of the BMA lipid droplet is compartmentalized - polarized toward the vasculature, the hematopoietic cells, or the bone surface.
Bone marrow adipocytes are directly associated with the sinusoidal vasculature and may be encased by perivascular cells.
Bone marrow adipocytes interface directly with a subset of hematopoietic cells including erythroblast islands and cells of the myeloid/granulocyte lineage.
A subset of bone marrow adipocytes are innervated by the sympathetic nervous system.
Acknowledgments
This work was supported by the National Institutes of Health, grants R00-DE024178 and U01-DK116317 (E.L.S.). Funding for this project was provided by the Children’s Discovery Institute of Washington University and St. Louis Children’s Hospital (C.S.C). Lastly, completion of this work was supported by a fellowship from the Washington University career center (H.R.) and BioSURF summer research fellowship (S.P).
Abbreviations
- BMA
bone marrow adipocyte
- BMAT
bone marrow adipose tissue
- EM
electron microscopy
- FIB-SEM
focused ion beam scanning electron microscopy
- WAT
white adipose tissue
- PBS
phosphate buffered saline
Footnotes
Publisher's Disclaimer: This is a PDF file of an unedited manuscript that has been accepted for publication. As a service to our customers we are providing this early version of the manuscript. The manuscript will undergo copyediting, typesetting, and review of the resulting proof before it is published in its final citable form. Please note that during the production process errors may be discovered which could affect the content, and all legal disclaimers that apply to the journal pertain.
Bibliography
- 1.Carpentier J, Perrelet A, Orci L. Morphological changes of the adipose cell plasma membrane during lipolysis. J Cell Biol. 1977 Jan;72(1):104–117. doi: 10.1083/jcb.72.1.104. [DOI] [PMC free article] [PubMed] [Google Scholar]
- 2.Lončar D, Bedrica L, Mayer J, Cannon B, Nedergaard J, Afzelius BA, et al. The effect of intermittent cold treatment on the adipose tissue of the cat. J Ultrastruct Mol Struct Res. 1986 Oct;97(1–3):119–129. doi: 10.1016/s0889-1605(86)80012-x. [DOI] [PubMed] [Google Scholar]
- 3.Loncar D, Afzelius BA, Cannon B. Epididymal white adipose tissue after cold stress in rats. I. Nonmitochondrial changes. J Ultrastruct Mol Struct Res. 1988 Dec;101(2–3):109–122. doi: 10.1016/0889-1605(88)90001-8. [DOI] [PubMed] [Google Scholar]
- 4.Loncar D. Convertible adipose tissue in mice. Cell Tissue Res. 1991 Oct;266(1):149–161. doi: 10.1007/BF00678721. [DOI] [PubMed] [Google Scholar]
- 5.Blanchette-Mackie EJ, Scow RO. Lipolysis and lamellar structures in white adipose tissue of young rats: lipid movement in membranes. J Ultrastruct Res. 1981 Dec;77(3):295–318. doi: 10.1016/s0022-5320(81)80026-3. [DOI] [PubMed] [Google Scholar]
- 6.Napolitano L. The differentiation of white adipose cells. an electron microscope study. J Cell Biol. 1963 Sep;18:663–679. doi: 10.1083/jcb.18.3.663. [DOI] [PMC free article] [PubMed] [Google Scholar]
- 7.Wu J, Boström P, Sparks LM, Ye L, Choi JH, Giang AH, et al. Beige adipocytes are a distinct type of thermogenic fat cell in mouse and human. Cell. 2012 Jul 20;150(2):366–376. doi: 10.1016/j.cell.2012.05.016. [DOI] [PMC free article] [PubMed] [Google Scholar]
- 8.Waldén TB, Hansen IR, Timmons JA, Cannon B, Nedergaard J. Recruited vs. nonrecruited molecular signatures of brown, “brite,” and white adipose tissues. Am J Physiol Endocrinol Metab. 2012 Jan 1;302(1):E19–31. doi: 10.1152/ajpendo.00249.2011. [DOI] [PubMed] [Google Scholar]
- 9.Lim S, Honek J, Xue Y, Seki T, Cao Z, Andersson P, et al. Cold-induced activation of brown adipose tissue and adipose angiogenesis in mice. Nat Protoc. 2012 Mar 1;7(3):606–615. doi: 10.1038/nprot.2012.013. [DOI] [PubMed] [Google Scholar]
- 10.Tavassoli M. Marrow adipose cells. Ultrastructural and histochemical characterization. Arch Pathol. 1974 Sep;98(3):189–192. [PubMed] [Google Scholar]
- 11.Tavassoli M. Ultrastructural development of bone marrow adipose cell. Acta Anat (Basel) 1976;94(1):65–77. doi: 10.1159/000144545. [DOI] [PubMed] [Google Scholar]
- 12.Scheller EL, Cawthorn WP, Burr AA, Horowitz MC, MacDougald OA. Marrow adipose tissue: trimming the fat. Trends Endocrinol Metab. 2016 Jun;27(6):392–403. doi: 10.1016/j.tem.2016.03.016. [DOI] [PMC free article] [PubMed] [Google Scholar]
- 13.Scheller EL, Rosen CJ. What’s the matter with MAT? Marrow adipose tissue, metabolism, and skeletal health. Ann N Y Acad Sci. 2014 Apr;1311:14–30. doi: 10.1111/nyas.12327. [DOI] [PMC free article] [PubMed] [Google Scholar]
- 14.Devlin MJ, Cloutier AM, Thomas NA, Panus DA, Lotinun S, Pinz I, et al. Caloric restriction leads to high marrow adiposity and low bone mass in growing mice. J Bone Miner Res. 2010 Sep;25(9):2078–2088. doi: 10.1002/jbmr.82. [DOI] [PMC free article] [PubMed] [Google Scholar]
- 15.Cawthorn WP, Scheller EL, Learman BS, Parlee SD, Simon BR, Mori H, et al. Bone marrow adipose tissue is an endocrine organ that contributes to increased circulating adiponectin during caloric restriction. Cell Metab. 2014 Aug 5;20(2):368–375. doi: 10.1016/j.cmet.2014.06.003. [DOI] [PMC free article] [PubMed] [Google Scholar]
- 16.Bredella MA, Fazeli PK, Miller KK, Misra M, Torriani M, Thomas BJ, et al. Increased bone marrow fat in anorexia nervosa. J Clin Endocrinol Metab. 2009 Jun;94(6):2129–2136. doi: 10.1210/jc.2008-2532. [DOI] [PMC free article] [PubMed] [Google Scholar]
- 17.Tavassoli M. Marrow adipose cells. Histochemical identification of labile and stable components. Arch Pathol Lab Med. 1976 Jan;100(1):16–18. [PubMed] [Google Scholar]
- 18.Bathija A, Davis S, Trubowitz S. Bone marrow adipose tissue: response to acute starvation. Am J Hematol. 1979;6(3):191–198. doi: 10.1002/ajh.2830060303. [DOI] [PubMed] [Google Scholar]
- 19.Lo HG, Jin RU, Sibbel G, Liu D, Karki A, Joens MS, et al. A single transcription factor is sufficient to induce and maintain secretory cell architecture. Genes Dev. 2017 Jan 15;31(2):154–171. doi: 10.1101/gad.285684.116. [DOI] [PMC free article] [PubMed] [Google Scholar]
- 20.Yokoyama T, Etoh T, Kitagawa H, Tsukahara S, Kannan Y. Migration of erythroblastic islands toward the sinusoid as erythroid maturation proceeds in rat bone marrow. J Vet Med Sci. 2003 Apr;65(4):449–452. doi: 10.1292/jvms.65.449. [DOI] [PubMed] [Google Scholar]
- 21.Manwani D, Bieker JJ. The erythroblastic island. Curr Top Dev Biol. 2008;82:23–53. doi: 10.1016/S0070-2153(07)00002-6. [DOI] [PMC free article] [PubMed] [Google Scholar]
- 22.Mach DB, Rogers SD, Sabino MC, Luger NM, Schwei MJ, Pomonis JD, et al. Origins of skeletal pain: sensory and sympathetic innervation of the mouse femur. Neuroscience. 2002;113(1):155–166. doi: 10.1016/s0306-4522(02)00165-3. [DOI] [PubMed] [Google Scholar]
- 23.Smith RM, Jarett L. Surface structure changes of rat adipocytes during lipolysis stimulated by various lipolytic agents. A scanning electron microscopic study. J Cell Biol. 1980 Jan;84(1):57–65. doi: 10.1083/jcb.84.1.57. [DOI] [PMC free article] [PubMed] [Google Scholar]
- 24.Nombela-Arrieta C, Manz MG. Quantification and three-dimensional microanatomical organization of the bone marrow. Blood Advances. 2017 Feb 14;1(6):407–416. doi: 10.1182/bloodadvances.2016003194. [DOI] [PMC free article] [PubMed] [Google Scholar]
- 25.Craft CS, Scheller EL. Evolution of the Marrow Adipose Tissue Microenvironment. Calcif Tissue Int. 2016 Jul 1;100(5):1–15. doi: 10.1007/s00223-016-0168-9. [DOI] [PMC free article] [PubMed] [Google Scholar]
- 26.Mattacks CA, Pond CM. Interactions of noradrenalin and tumour necrosis factor alpha, interleukin 4 and interleukin 6 in the control of lipolysis from adipocytes around lymph nodes. Cytokine. 1999 May;11(5):334–346. doi: 10.1006/cyto.1998.0442. [DOI] [PubMed] [Google Scholar]
- 27.Pond CM, Mattacks CA. The source of fatty acids incorporated into proliferating lymphoid cells in immune-stimulated lymph nodes. Br J Nutr. 2003 Mar;89(3):375–383. doi: 10.1079/BJN2002784. [DOI] [PubMed] [Google Scholar]
- 28.Boyd AL, Reid JC, Salci KR, Aslostovar L, Benoit YD, Shapovalova Z, et al. Acute myeloid leukaemia disrupts endogenous myelo-erythropoiesis by compromising the adipocyte bone marrow niche. Nat Cell Biol. 2017 Nov;19(11):1336–1347. doi: 10.1038/ncb3625. [DOI] [PubMed] [Google Scholar]
- 29.Bathija A, Davis S, Trubowitz S. Marrow adipose tissue: response to erythropoiesis. Am J Hematol. 1978;5(4):315–321. doi: 10.1002/ajh.2830050406. [DOI] [PubMed] [Google Scholar]
- 30.Suresh S, Alvarez JC, Noguchi CT. Paper: Erythropoietin Eliminates Increased Bone Marrow Adiposity and Alters Bone Features in Obese Mice [Internet] [cited 2017 Dec 3];American Society of Hematology. 2017 Available from: https://ash.confex.com/ash/2017/webprogram/Paper102008.html.
- 31.Zhou BO, Yu H, Yue R, Zhao Z, Rios JJ, Naveiras O, et al. Bone marrow adipocytes promote the regeneration of stem cells and haematopoiesis by secreting SCF. Nat Cell Biol. 2017 Aug;19(8):891–903. doi: 10.1038/ncb3570. [DOI] [PMC free article] [PubMed] [Google Scholar]
- 32.Veldhuis-Vlug AG, Rosen CJ. Mechanisms of marrow adiposity and its implications for skeletal health. Metab Clin Exp. 2017 Feb;67:106–114. doi: 10.1016/j.metabol.2016.11.013. [DOI] [PMC free article] [PubMed] [Google Scholar]
- 33.Biermann A, Graf von Keyserlingk D. Ultrastructure of reticulum cells in the bone marrow. Acta Anat (Basel) 1978;100(1):34–43. doi: 10.1159/000144879. [DOI] [PubMed] [Google Scholar]
- 34.Zhou BO, Yue R, Murphy MM, Peyer JG, Morrison SJ. Leptin-receptor-expressing mesenchymal stromal cells represent the main source of bone formed by adult bone marrow. Cell Stem Cell. 2014 Aug 7;15(2):154–168. doi: 10.1016/j.stem.2014.06.008. [DOI] [PMC free article] [PubMed] [Google Scholar]
- 35.Mizoguchi T, Pinho S, Ahmed J, Kunisaki Y, Hanoun M, Mendelson A, et al. Osterix marks distinct waves of primitive and definitive stromal progenitors during bone marrow development. Dev Cell. 2014 May 12;29(3):340–349. doi: 10.1016/j.devcel.2014.03.013. [DOI] [PMC free article] [PubMed] [Google Scholar]
- 36.Kunisaki Y, Bruns I, Scheiermann C, Ahmed J, Pinho S, Zhang D, et al. Arteriolar niches maintain haematopoietic stem cell quiescence. Nature. 2013 Oct 31;502(7473):637–643. doi: 10.1038/nature12612. [DOI] [PMC free article] [PubMed] [Google Scholar]
- 37.Scheller EL, Doucette CR, Learman BS, Cawthorn WP, Khandaker S, Schell B, et al. Regionspecific variation in the properties of skeletal adipocytes reveals regulated and constitutive marrow adipose tissues. Nat Commun. 2015 Aug 6;6:7808. doi: 10.1038/ncomms8808. [DOI] [PMC free article] [PubMed] [Google Scholar]
- 38.Fujimoto T, Parton RG. Not just fat: the structure and function of the lipid droplet. Cold Spring Harb Perspect Biol. 2011 Mar 1;3(3) doi: 10.1101/cshperspect.a004838. [DOI] [PMC free article] [PubMed] [Google Scholar]
Associated Data
This section collects any data citations, data availability statements, or supplementary materials included in this article.
Supplementary Materials
General characteristics of the tibial bone marrow adipocyte and its interactions with a sinusoidal blood vessel. Blood vessel (red), adipocyte cytoplasm (yellow), lipid (blue), mitochondria (green). Imaging location: C57BL/6J mouse, proximal tibia (Dataset #1).
Interaction of a bone marrow adipocyte with an erythroblast island. Bone marrow adipocyte cytoplasm (yellow), lipid (blue), nucleus (dark blue). Erythroblast island core macrophage (green), macrophage lipid (blue), macrophage nucleus (dark green). Erythroblast cells (light blue). Imaging location: C3H/HeJ mouse, proximal tibia (Dataset #3).
Innervation of the bone marrow and osteoblast niche. Tyrosine hydroxylase positive sympathetic nerves (green), arteriolar blood vessel (red), bone marrow adipocyte lipid (dark blue), mineralized bone (orange), osteoid (transparent orange), osteoblast layer (blue with dark blue nuclei), lipid-filled cell (yellow cytoplasm with blue lipid droplets and dark, circular nucleus). Imaging location: C3H/HeJ mouse, tail vertebrae (Dataset #5).
A loose, fibrous extracellular matrix can be observed between the bone marrow adipocyte (BMA) and the surface of the endothelial cell (EC) (arrowheads). This loose matrix is also present between endothelial cells and pericytes and between pericytes and the BMAT adipocyte. Imaging location: C57BL/6J mouse, proximal tibia (Dataset #1).
The erythroblast in the C3H tibial dataset was associated with an impressive number of hematopoietic cells – 54 in total. Of these, 47 cells (87%) were nucleated erythroblasts (Eb), one cell had large granules consistent with that of a basophil (B), and six cells had smaller granules like those of the myeloid/granulocyte (M/G) lineage.