

Summary
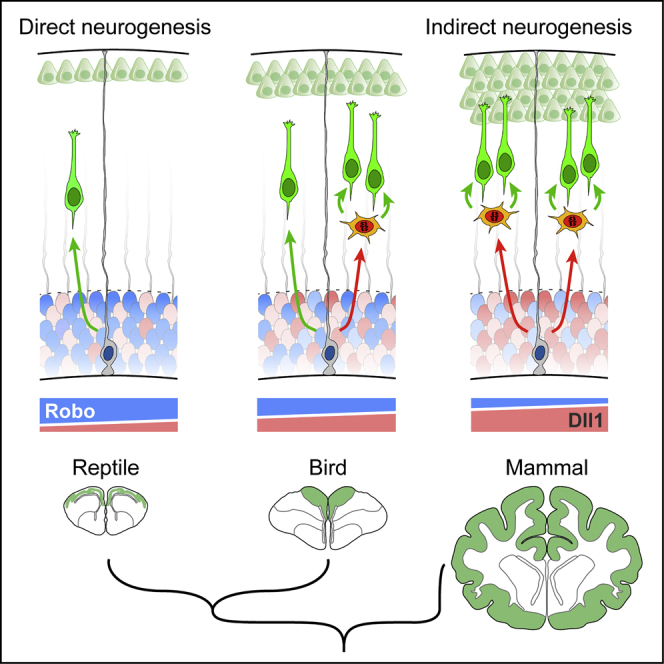
Cerebral cortex size differs dramatically between reptiles, birds, and mammals, owing to developmental differences in neuron production. In mammals, signaling pathways regulating neurogenesis have been identified, but genetic differences behind their evolution across amniotes remain unknown. We show that direct neurogenesis from radial glia cells, with limited neuron production, dominates the avian, reptilian, and mammalian paleocortex, whereas in the evolutionarily recent mammalian neocortex, most neurogenesis is indirect via basal progenitors. Gain- and loss-of-function experiments in mouse, chick, and snake embryos and in human cerebral organoids demonstrate that high Slit/Robo and low Dll1 signaling, via Jag1 and Jag2, are necessary and sufficient to drive direct neurogenesis. Attenuating Robo signaling and enhancing Dll1 in snakes and birds recapitulates the formation of basal progenitors and promotes indirect neurogenesis. Our study identifies modulation in activity levels of conserved signaling pathways as a primary mechanism driving the expansion and increased complexity of the mammalian neocortex during amniote evolution.
Keywords: evolution, Pax6, Tbr2, Notch, radial glia, intermediate progenitor, microcephaly, electroporation
Graphical Abstract
Highlights
-
•
Neurogenesis in mammalian neocortex is largely indirect, direct in reptiles and birds
-
•
Low Robo and high Dll1 signaling is necessary for indirect neurogenesis
-
•
Blocking Robo and increased Dll1 in non-mammals induces indirect neurogenesis and SVZ
-
•
High Robo–low Dll1 blocks indirect neurogenesis in human cerebral organoids
Levels of Robo and Notch signaling across amniotes determines their predominant mode of neurogenesis, with consequences on final cerebral cortex size and complexity
Introduction
Brain size differs dramatically among amniotes (i.e., reptiles, birds, and mammals), largely due to differences in size of the cerebral cortex. This is thought to reflect the evolutionary expansion of the cerebral cortex, which culminated in the mammalian neocortex (NCx) (Finlay and Darlington, 1995, Northcutt, 2002). Cortical expansion during amniote evolution involved a significant increase in neuron number and the generation of new neuron types that formed new layers, extending the three-layered reptilian paleocortex into the six-layered mammalian NCx (Dugas-Ford and Ragsdale, 2015). The developmental mechanisms that regulated this evolutionary expansion and complexification of the cerebral cortex remain unknown.
Differences in cerebral cortex size and composition are thought to result from variations in the lineage of neural progenitor cells during development (De Juan Romero and Borrell, 2015, Fish et al., 2008, Kriegstein et al., 2006). Radial glia cells (RGCs) are the primary type of progenitors in the embryonic cortex; they cluster to form the ventricular zone (VZ) and undergo mitosis on the VZ apical side. Prior to cell division, each RGC must make a binary decision to leave the cell cycle or to stay. In the former, the RGC produces daughter cells that differentiate as neurons, a process known as “direct neurogenesis” (Figure 1A). In the latter case, daughter cells re-enter the cell cycle and remain as progenitors (Malatesta et al., 2000, Noctor et al., 2001, Noctor et al., 2004). When re-entering the cell cycle, RGCs may produce other RGCs or intermediate progenitor cells (IPCs). IPCs migrate basally to form the subventricular zone (SVZ), where they divide to ultimately produce neurons, a process known as “indirect neurogenesis” (Figure 1A) (Haubensak et al., 2004, Miyata et al., 2004, Noctor et al., 2004). Direct neurogenesis produces neurons fast, but RGCs can only produce one or two neuron(s) per cell cycle; thus, the number finally produced is small. With indirect neurogenesis, neuron production is slower because it involves intermediate steps of IPC generation and SVZ formation, but final neuron production is greater (Kriegstein et al., 2006). Reptile and bird embryos do not form an SVZ in the dorsal telencephalon (Cheung et al., 2007), so development of their small cortex homolog (Dugas-Ford and Ragsdale, 2015) depends on direct neurogenesis. In contrast, mouse embryos display a distinct SVZ with abundant IPCs, and indirect neurogenesis substantially contributes to the formation of their larger cortex (Attardo et al., 2008, Kowalczyk et al., 2009, Vasistha et al., 2015). In humans and other primates with a very large cerebral cortex, their abundant neurogenesis involves the massive generation of IPCs and other basal progenitors, forming an exceptionally sized SVZ (Hansen et al., 2010, Smart et al., 2002).
Figure 1.

Early Neurogenesis Is More Abundant in OB than Adjacent NCx in Mouse Embryo
(A) Schematic of progenitor cell lineages in direct and indirect neurogenesis. N, neuron; CP, cortical plate.
(B) Parasagittal sections of developing mouse telencephalon. Dashed lines indicate extent of the OB. MGE, medial ganglionic eminence; Sp, septum.
(C–F) Distribution and abundance of neurons (Tuj1+ and Tbr1+ cells) in OB and NCx at E12.5, and quantifications as indicated (n = 3–9 embryos per group; t test). ML, mantle layer.
(G) Cumulative BrdU labeling at E12.5 to measure cell cycle length (n = 3 embryos per time-point).
(H and I) Analysis of cell cycle exit at E12.5 (BrdU+Ki67−, arrowheads; n = 3 embryos per group; χ2-test).
(J and K) Distribution of IPCs (Tbr2+Tbr1−, red arrowheads) and neurons (Tbr1+, green arrowheads; or Tbr2+Tbr1+, white arrowheads) at E12.5, and quantifications of Tbr2+ cells, IPCs (E12.5) and basal mitoses at the indicated ages (n = 3-11 embryos per group; t tests for density, χ2-tests for co-localization).
Values are mean + SEM; ∗p < 0.05; ∗∗p < 0.01; ∗∗∗p < 0.001. Scale bars: 300 μm (B), 50 μm (C–J).
See also Figure S1.
The balance between progenitor cell self-renewal and neurogenesis is subject to complex molecular regulation (Taverna et al., 2014). Genetic screens and functional analyses have identified key signaling pathways regulating progenitor cell lineage and NCx development in mammals (Florio et al., 2015, Taverna et al., 2014). However, the genetic mechanisms underlying cerebral cortex evolution in amniotes, including the emergence of IPCs, increased number and types of neurons, and especially the regulation of direct versus indirect neurogenesis, remain largely unknown (Florio et al., 2017, Nomura et al., 2016). To identify developmental mechanisms responsible for the evolutionary expansion of the amniote cortex and emergence of the mammalian NCx, we first focus on mouse, comparing the early embryonic NCx (“evolutionarily new cortex”) and olfactory bulb (OB), a component of the paleocortex (“evolutionarily old cortex”). We find that direct neurogenesis is abundant in OB but scarce in NCx and that this difference is established by regulation of Slit/Robo signaling levels. Our gain- and loss-of-function experiments show that high Robo1 and Robo2 signaling leads to low levels of Dll1 and increased Jag1 and Jag2 expression. We show that this is necessary and sufficient to elicit direct neurogenesis in NCx and impair the formation of superficial layer neurons in favor of deep layers. We show that the same signaling mechanism operates in the cortex of birds and reptiles, where endogenous high Robo and low Dll1 expression sustain the predominance of direct neurogenesis. Strikingly, attenuation of Robo1 and Robo2 and increased Dll1 is sufficient to drive IPC formation in snake cortex, otherwise devoid of indirect neurogenesis. Finally, we show that gain of Robo1 and Robo2 plus loss of Dll1 impairs basal progenitor formation and drives direct neurogenesis also in human cerebral organoids. Our results suggest that attenuation of Robo signaling during amniote evolution was a primary mechanism driving the expansion and increased complexity of the mammalian cerebral cortex.
Results
Faster Neuron Accumulation in the Early Mouse Embryonic OB than NCx
To identify genetic mechanisms involved in the evolutionary expansion of the amniote cerebral cortex, we first investigated developmental mechanisms that recapitulate this expansion. Focused on mouse, we compared the embryonic development of the evolutionarily young NCx with the evolutionarily older OB (Dugas-Ford and Ragsdale, 2015). The latter is much less expanded than the NCx and part of the paleocortex (the most primitive form of cortex), while both structures develop from regions of the dorsal telencephalic primordium that are virtually indistinguishable at the onset of neurogenesis.
Between embryonic day (E) 12.5 and E14.5, the prospective OB grows much faster than the adjacent NCx, prompting its evagination (Figure 1B), so we investigated the cellular mechanisms underlying these different expansion rates. Differences between OB and adjacent NCx were first evident at E12.5, when the thickness of the neuronal layer in OB doubled that of NCx (Figures 1B–1D). The larger number of neurons in OB was not due to decreased developmental apoptosis nor to a massive immigration of GABAergic interneurons (major constituents of the mature OB), as these were absent at E12.5 and a small minority at E14.5 (Figures S1A–S1C). Instead, the initial distinction between OB and NCx emerged from the precocious accumulation of excitatory neurons in the OB, as identified by expression of Tbr1 and βIII-tubulin (Tuj1; Figures 1E and 1F) (Englund et al., 2005). This suggested that the differential growth between OB and NCx starting at E12.5 is due to an accelerated neurogenesis from progenitor cells within the OB primordium, producing excitatory neurons more rapidly than in the NCx. Accordingly, Tbr1+ excitatory neurons populating the OB are born mostly during a very brief period between E11.5 and E12.5 (Figures S1D–S1G), corresponding to mitral cells (Blanchart et al., 2011). This was confirmed by lineage tracing of progenitor cells in the OB primordium (Figures S1H and S1I).
Figure S1.

Differences between Early Growth of OB and NCx Correlate with Mitral Cell Generation, Not with Cell Death or Inhibitory Interneuron Accumulation, Related to Figure 1
(A) Sagittal section of mouse telencephalon at E12.5 stained for activated Caspase 3 and DAPI. Arrowheads indicate Casp3+ cells. H, hippocampus; MGE, medial ganglionic eminence; OE, olfactory epithelium; Sp, septum.
(B) Quantification of linear density of Casp3+ cells in OB and NCx at the indicated ages. Values are mean + SEM; n = 3 embryos per age; t tests, ns = not significant.
(C) Sagittal sections of the olfactory bulb primordium at E12.5 and E14.5 from a transgenic mouse expressing GFP in GAD65+ cells stained for Tbr1 or GABA. Dotted lines indicate the perimeter of the OB primordium. Arrows point at the leading edge of tangentially-migrating interneurons (GAD65+ or GABA+), which are just arriving to the OB primordium by E12.5.
(D) Experimental design for mitral cell birthdating by single BrdU injections and analyses at postnatal day (P) 21.
(E) Coronal sections of mouse OB at P21 after BrdU injections at the indicated ages, stained for Tbr1 to identify mitral cells retaining BrdU. Arrow indicates a cell retaining 100% BrdU, solid arrowheads indicate cells retaining 50% and open arrowheads indicate cells retaining only 25% of BrdU.
(F and G) Quantification of the proportion of mitral cells (Tbr1+) retaining full levels of BrdU (F), or 25%, 50% and 100% of BrdU (G). Values are mean + SEM; n = 3 embryos per stage.
(H) Experimental design to identify cell types produced by apical progenitors in the OB primordium.
(I) Images from brains electroporated with Gfp. Left, external view at E18.5 showing GFP+ mitral cell axons in the lateral olfactory tract (LOT); center and right, sagittal section through the OB at P5 showing GFP+ mitral cells. GL, granule layer; MCL, mitral cell layer.
(J and K) Measurement of the length of G2+M phase of the cell cycle in apical (VZ) and basal (SVZ) progenitors of OB and NCx at E12.5, as defined by the time for BrdU saturation of PH3+ cells after cumulative BrdU labeling (n = 3 embryos per group). Values for the duration of other cell cycle phases, and total cell cycle (Tc), are indicated in (K).
Scale bars: 200 μm (A), 100 μm (C), 50 μm (E), 1 mm (E18.5 in I), 200 μm (P5 in I), 10 μm (P5 detail in I).
Extensive Direct Neurogenesis in OB but Limited in NCx
To determine the mechanism for fast neurogenesis in the OB compared to the adjacent NCx, we studied the behavior of progenitor cells. We found that the cell cycle is 5 hr (40%) longer in OB progenitors than in NCx (Figures 1G, S1J, and S1K). A longer cell cycle in the embryonic telencephalon is a hallmark of progenitor cells committed to exiting cell cycle and producing neurons (Arai et al., 2011). Measures of cell-cycle exit rate showed that this is 3-fold higher in OB than NCx at E12.5 (Figures 1H and 1I), indicating increased neurogenesis in OB at this stage.
Given that most excitatory neurons in NCx are born from IPCs (Kowalczyk et al., 2009, Vasistha et al., 2015), we next compared their abundance. Using Tbr2 as marker, we found that there were twice as many Tbr2+ cells in OB than NCx at E12.5 (Figures 1J and 1K). Because newborn neurons co-express Tbr2 and Tbr1 for some time (Englund et al., 2005), we only considered Tbr2+ and br1− cells as genuine IPCs. This marker combination revealed that, in fact, IPCs were 25% less abundant in OB than NCx at E12.5 (Figures 1J and 1K). To confirm this result, we measured the occurrence of basal mitoses, characteristic of IPCs, by PH3 stains (marker of mitosis). We found a significant lower density of basal mitoses in OB than NCx at E12.5 (Figure 1K). These results demonstrated that neurogenesis is greater in the early OB than NCx, but that IPCs are less abundant, consistent with a lower rate of indirect neurogenesis in OB.
Greater total neurogenesis with fewer IPCs in OB suggested higher direct neurogenesis than in NCx (Figure 1A). We found that the density of apical mitoses, characteristic of RGCs, is ∼30% lower in OB than NCx at E12.5 and E14.5 (Figures 2A and 2B). This was consistent with RGCs in OB having a longer cell cycle—as measured above (Figure 1G) —typical of neurogenic divisions, supporting that much neurogenesis in OB might be direct from RGCs without involvement of IPCs. This would be a key difference with the NCx, where indirect neurogenesis seems to predominate (Attardo et al., 2008, Haubensak et al., 2004, Kowalczyk et al., 2009). We tested this hypothesis in several ways. First, we studied whether differences in apical mitoses between OB and NCx relate to Pax6+ RGCs or to Tbr2+ IPCs because the latter occasionally divide also at the apical surface (Kowalczyk et al., 2009). We found very few Tbr2+ apical mitoses, whereas Pax6+ apical mitoses were very abundant in NCx and reduced by ∼30% in OB (Figures S2A and S2B). Second, Tbr1+ neurons were abundant within the VZ of E12.5 OB—as expected transiently if these are born from the apical divisions of RGCs—but were virtually absent in the NCx (Figures 2C and 2D). Third, IPC-born neurons may occasionally migrate down to the VZ (Noctor et al., 2004) while still retaining Tbr2 protein, whereas RGC-born neurons would be Tbr2-negative in the VZ. We found a high abundance of Tbr1+ and Tbr2− neurons in the OB VZ, virtually absent in the NCx (Figure 2D). Conversely, we observed Tuj1+ neurons retaining Pax6 protein in the OB VZ, but never in NCx (Figure S2C), consistent with direct neurogenesis in OB. Fifth, we performed short-survival BrdU labeling combined with Tbr1 stains to identify newborn neurons close to their birth site (Figures S2D and S2E). Tbr1+ and BrdU+ cells were seen near the apical surface in OB, but not in NCx, consistent with these OB neurons being recently born from apical mitoses. Sixth, we combined single-pulse BrdU incorporation with targeted labeling of apical progenitors by GFP in utero electroporation to identify neurons becoming post-mitotic upon apical division (Figure 2E). We found this to be the case for 48.1% of GFP+ neurons in OB but only 5.3% in NCx (Figures 2F, 2G, S2F, and S2G).
Figure 2.

Higher Frequency of Direct Neurogenesis in OB than NCx
(A–D) Distribution of apical (solid arrowheads) and basal (open arrowheads) mitoses (A) and neurons (C) at E12.5, and quantifications as indicated (n = 3–11 embryos per group; t tests).
(E–G) Experimental design to identify neurons born by direct or indirect neurogenesis based on GFP labeling and BrdU retention, representative examples (OB, mitral cells with 100% BrdU [arrows]; NCx, projection neurons with 25% and 50% BrdU) and quantifications (n = 4 embryos per group; t tests).
(H and I) Time-lapse imaging frames from an RGC dividing in the OB (t = 1:30), and analysis of daughter cells (n = 44 divisions in NCx, 25 divisions in OB; 3 and 5 embryos, respectively; χ2-test).
(J–L) Experimental design for clonal analysis, representative examples and quantification (n = 116 clones NCx, 47 clones OB, 7 embryos; χ2-test). Arrowheads indicate soma of cells in clone. GL, glomerular layer; MCL, mitral cell layer.
Values are mean + SEM; ∗p < 0.05, ∗∗p < 0.01, ∗∗∗p < 0.001. Scale bars: 50 μm (A and C), 10 μm (F, H, and K).
See also Figures S2 and S3.
Figure S2.

Evidence Supporting Abundant Direct Neurogenesis in OB, but Not NCx, at E12.5, Related to Figure 2
(A) Images from parasagittal sections of mouse OB and NCx at E12.5 stained for PH3 (mitoses), Pax6 (RGCs) and Tbr2 (IPCs). Arrowheads point at double-positive nuclei shown at high magnification in the insets.
(B) Quantification of linear density of apical and basal PH3+ nuclei in OB and NCx positive for Pax6 or Tbr2. Values are mean + SEM; n = 4 embryos per group and 2-3 confocal planes for each embryo; t tests; ∗p < 0.05; ∗∗∗p < 0.001.
(C) Single confocal plane images from a sagittal section of the OB at E12.5 stained for Pax6 and Tuj1. Cells 1 and 2 indicated by arrowheads co-express the two markers, as demonstrated by the high-magnification images including orthogonal planes at the levels indicated.
(D and E) Identification of neurons born from apical divisions in vivo. Experimental design used shown in (D). The timing for analysis after BrdU administration was defined following our previous measures of the duration of G2+M phases of the cell cycle. Images in (E) are from a sagittal section of the OB at E12.5 stained with BrdU and Tbr1. The arrowhead indicates the cell magnified to the right, with orthogonal views demonstrating co-localization. This cell is full of BrdU and expresses Tbr1 close to the ventricular border. Similar cells were never observed in NCx.
(F and G) Experimental design and examples of cells born directly or indirectly from VZ mitoses. Upon BrdU injection at E12.5, this is incorporated by RGCs and IPCs in S-phase (F). BrdU+ cells start entering mitosis 3hr later, and then the ventricular side is electroporated, transducing RGC cell bodies next to the apical side but not IPCs in the SVZ, as these are distant from the electroporation surface. After allowing subsequent rounds of cell division, only neurons born by direct neurogenesis (not dividing again) will express GFP and contain 100% BrdU; cells with 50% BrdU or less are born after additional cell cycles, when direct versus indirect neurogenesis are indistinguishable by this method. (G) Examples of neurons in OB and NCx at E18.5 labeled as indicated in (F). High magnifications show examples of GFP+ cells retaining high (100%), medium (50%) or low (25%) levels of BrdU.
Scale bars: 100 μm (A), 25 μm (C, E, and G).
To directly visualize direct neurogenesis, we performed clonal analysis of RGCs. Sparse RGCs were labeled in utero by electroporation (Pilz et al., 2013), and their individual cellular lineage was monitored by videomicroscopy followed by marker analysis (Figure 2H). In OB, 19.2% of RGC mitoses produced neurons directly, while only 5.0% of RGC mitoses produced neurons directly in NCx (Figures 2I and S3; Videos S1, S2, S3, S4, and S5). To have an estimate at the population level in vivo, we analyzed the clonal lineage of individual RGCs in utero using low-titer Gfp-encoding retroviruses (Figures 2J–2L). In OB clones, 24.4% of GFP+ cells were neurons located in the VZ at the expense of one third of RGCs compared to the NCx, where GFP+ neurons in the VZ were 10-fold less frequent. Together, our results demonstrate that the different development of OB and NCx relies on the fate choice of RGCs, favoring direct neurogenesis in OB and indirect neurogenesis in NCx. This allows producing neurons quickly in OB at the expense of consuming RGCs and, thus, a faster but also more limited growth compared to the NCx.
Figure S3.

Videomicroscopy Analyses Demonstrating Abundant Direct Neurogenesis in the OB, but Not NCx, at E12.5, Related to Figure 2
(A) Individual frames from time-lapse videomicroscopy from OB (top) and NCx (bottom), imaged in brain slices 24hr after in utero electroporation of reporter plasmids at E12.5. Images from OB show one RGC (white arrowhead) dividing at t = 0 to generate one RGC (red arrowhead; Tbr1-, Tbr2-) and one neuron (green arrowhead; Tbr1+). Tbr1 and Tbr2 stain images are from a single confocal plane; dotted lines delimit the border of cells. Images from NCx show one RGC (white arrowhead) dividing at t = 3:30 hr to generate two more RGCs (solid green and red arrowheads), each inheriting an apical process and growing a basal process. These RGCs divide again at 18:30 and 20:30, respectively, to generate four RGCs (open green and red arrowheads; Tbr1-, Tbr2-). Scale bar: 15μm.
(B and C) Time plots from representative cell lineages starting as individual RGCs (B), analyzed by videomicroscopy as in (A), and frequency of cell division types observed (C). Three types of cells divisions produced direct neurogenesis (N from RG; red box), and the frequency of all three was much higher in OB than NCx. In contrast, indirect neurogenesis (N from IPC) was frequent in NCx but never observed in our OB imaging experiments. N = 44 divisions from 39 clones in NCx, 25 divisions from 25 clones in OB.
Scale bar: 10 μm.
Videomicroscopy of the lineage of a single RGC in an organotypic slice culture from the rostral neocortex near the mouse OB. Apical surface is down. The slice was prepared 20hr after in utero electroporation, and imaging started 4hrs after slice preparation. Total imaging time is 26hrs. Colored arrowheads follow the same RGC and its progeny through the movie. The initial RGC undergoes interkinetic nuclear migration (INM) to divide at the apical surface and produce 2 RGCs; each of those grows a new basal process and undergoes INM again, to divide apically and produce 2 more RGCs, for a total of 4.
Videomicroscopy of the lineage of a single RGC in an organotypic slice culture from the rostral neocortex near the mouse OB. Apical surface is down. Total time elapsed is 26hrs. Colored arrowheads follow the same RGC and its progeny through the movie. The initial RGC undergoes interkinetic nuclear migration (INM) to divide at the apical surface and produce 2 RGCs; each of those grows a new basal process and undergoes INM again, to divide apically and produce 2 more RGCs, for a total of 4.
Videomicroscopy of the lineage of a single RGC in an organotypic slice culture from the rostral neocortex near the mouse OB. Apical surface is down. Total time elapsed is 26hrs. Colored arrowheads follow the same RGC and its progeny through the movie. The initial RGC undergoes interkinetic nuclear migration (INM) to divide apically and produce 1 IPC (green arrowhead) plus 1 RGC (red arrowhead); the RGC undergoes INM again to divide at the apical surface and produce 2 more RGCs (open red arrowheads), whereas the IPC divides terminally at a basal position, without INM, to produce 2 neurons (open green arrowheads).
Videomicroscopy of the lineage of a single RGC in an organotypic slice culture from the mouse OB. Apical surface is down. Total time elapsed is 13hrs. The initial RGC undergoes interkinetic nuclear migration to divide in the apical surface to produce 1 RGC (top cell) plus 1 neuron (bottom cell).
Videomicroscopy of the lineage of a single RGC in an organotypic slice culture from the mouse OB. Apical surface is down. Total time elapsed is 9hrs. Colored arrowheads follow the same RGC and its progeny through the movie. The initial RGC divides at the apical surface to produce 1 RGC (red arrowhead) plus 1 neuron (green arrowhead).
Robo Receptors Promote Direct Neurogenesis in Mouse
In the parietal cerebral cortex of mouse embryos, Robo signaling modulates the balance between RGC self-renewal and IPC production (Borrell et al., 2012). We hypothesized that Robo signaling may also be important in determining whether RGCs undergo direct or indirect neurogenesis. Figures 3A and S4A show that the abundance of Robo1 and Robo2 mRNA in the VZ is 4-fold higher in OB than NCx starting at E12.5. Robo1 and Robo2 mRNA and protein were frequently expressed by Pax6+ RGCs and, to a lesser extent, by Tbr2+ cells in the VZ (Figures 3A, S4C, and S4D). While single mutant embryos deficient for Robo1 or Robo2 seemed unaffected, double mutants (Robo1/2−/−) displayed prominent OB defects, with reduced evagination starting at E14.5 (Figures 3B and S5A–S5D) (Nguyen-Ba-Charvet et al., 2008), indicating a key role of Robo1 and Robo2 in early OB growth and development. In Robo1/2−/− mutant embryos, the typical greater accumulation of neurons in OB compared to NCx at E12.5 was significantly diminished (Figures 3C and 3D). This was not due to increased cell death because control and mutant embryos displayed similarly scarce levels of apoptosis (data not shown). Instead, in Robo1/2−/− mutants, most parameters that related to cell proliferation were remarkably similar between OB and NCx as opposed to control littermate embryos: abundance of apical and basal mitoses, abundance of Pax6+ and Tbr2+ mitoses, rate of cell-cycle exit, and cell-cycle length (Figures 3D–3G). Importantly, deficit in neurogenesis in the mutant OB was not related to deficit in IPCs, with similar abundance in OB and NCx of mutant embryos as opposed to controls (Figures 3H and 3I). Instead, mutant OBs contained much fewer Tuj1+ and Tbr1+ neurons in the VZ, very few of which were Tbr2− (non-IPC derived; Figures 3C, 3H, and 3I).
Figure 3.

Robo1 and Robo2 Promote Direct Neurogenesis in OB
(A) ISH and qRT-PCR for Robo1 and 2 at E12.5 (n = 3 embryos; t tests). Arrowheads indicate Pax6+ cells expressing Robo mRNA.
(B) Control and Robo1 and Robo2 mutant brains at E18.5; sc, superior colliculus.
(C and D) Distribution and abundance of neurons and mitoses at E12.5 (n = 3–11 embryos per group; t tests). Images in (C) are from OB.
(E) Cell-cycle exit at E12.5 (n = 3 embryos per condition; χ2-tests).
(F) Linear density of apical and basal mitoses positive for Pax6 or Tbr2 at E12.5 (n = 4 embryos per group, 2–3 confocal planes per embryo).
(G) Cumulative BrdU labeling at E12.5 to measure length of cell cycle phases (n = 3 embryos per group and time-point) and summary table of results. Tc, total cycle; Tc-s, cycle minus S-phase; Ts, S-phase.
(H and I) Distribution and abundance of IPCs (Tbr2+Tbr1−, red arrowheads) and neurons (Tbr1+, green arrowheads; and Tbr2+Tbr1+, white arrowheads) and quantifications at E12.5 (n = 3 embryos per group; t test for density, χ2-test for colocalization).
(J–L) Experimental design for progenitor cell clonal analysis, representative examples and quantification (WT: n = 116 clones NCx; 47 clones OB—KO: n = 125 clones NCx; 40 clones OB—7 embryos per group). One-way ANOVA and χ2-test.
Values are mean + SEM; ns = not significant; ∗p < 0.05, ∗∗p < 0.01, ∗∗∗p < 0.001. Scale bars: 100 μm (A), 1 mm (B), 50 μm (C and H), 10 μm (K).
See also Figures S4, S5, and S6.
Figure S4.

Robo Receptors and Slit Ligands Are Expressed in the Mouse Telencephalon during Embryonic Development, Related to Figure 3
(A and B) ISH for Robo1, Robo2, Slit1, Slit2 and Slit3 in the developing mouse telencephalon from E11.5 to E16.5. Stars indicate low expression of Robo1 and 2 mRNA in the VZ of NCx, and asterisks indicate high expression of Robo1 and 2 in the VZ of OB, between E12.5 and E16.5. Slits are expressed at moderate-low levels in the VZ of OB and NCx between E14.5 and E16.5. High-magnification details in (B) show strong expression of Slit2 and Slit3 mRNA in the choroid plexus epithelium (CPE) at E12.5, E14.5 and E16.5.
(C) ISH for Robo1 and Robo2 and immunostaining for Tbr2 in OB, demonstrating co-expression in many Tbr2+ cells but not all (solid and open arrowheads, respectively).
(D) Single confocal plane images of double inmunostains in E12.5 OB for Robo1 and Robo2, with Tbr2 and Pax6, demonstrating protein co-expression in many Pax6+ cells and some Tbr2+ cells (arrowheads). Dashed line indicates apical border of VZ.
Scale bars: 200 μm (E11.5, E12.5), 500 μm (E14.5, E16.5). MGE, medial ganglionic eminence; Sp, septum.
Figure S5.

Regulation of OB Neurogenesis and Growth by Robo Receptors and Slit Ligands, Related to Figure 3
(A) Sagittal sections of the rostral telencephalon showing the growth and evagination of the OB in WT and mutant embryos from E12.5 to E18.5; dashed lines indicate OB perimeter.
(B) External lateral view of the brain in WT (+/+) and Robo1/2−/− embryos.
(C) Measurement of the OB perimeter on sagittal sections from WT and Robo1/2−/− embryos from E11.5 to E16.5 (n = 3-9 embryos per group).
(D) ISH on sagittal sections from WT and mutant embryos at E18.5 for the indicated genes, which delineate the extension of the OB by being either selectively expressed (Reln, Grm1, Tbr2) or selectively absent (Bhlhe22) in the mitral cell layer (MCL).
(E–H) Distribution and abundance of Tbr1+ and Tuj1+ neurons (E and G) and PH3+ apical and basal mitoses (F,H) in OB and NCx of WT and Slit1/2−/− embryos at E12.5. Plots show density of cells per 100 μm of ventricular surface in the VZ (left) and mantle layer (ML) or cortical plate (CP) (n = 3 embryos per group).
Values are mean ± SEM; t tests, ∗p < 0.05, ∗∗p < 0.01, ∗∗∗p < 0.001, ns = not significant. Scale bars: 200 μm (A: E12.5, E14.5), 500 μm (A: E16.5, E18.5; D), 1 mm (B), 50 μm (E and F).
Altogether, these results are consistent with a dramatic reduction of direct neurogenesis in the OB of Robo1/2 mutants. This was confirmed by short-term clonal analysis of apical progenitors in vivo using Gfp retroviruses. In OB clones from control littermates, 24% of cells were neurons in the VZ, and only 39% were RGCs, in sharp contrast to Robo1/2−/− OB clones where only 2% of cells were neurons in the VZ and 64% were RGCs, the latter composition being highly similar to that of NCx clones in both controls and mutants (Figures 3J–3L).
The canonical ligands for Robo receptors are Slit1, 2, and 3. We found that Slit1 and Slit2 mRNAs are expressed in the VZ of NCx, septum, and basal ganglia, whereas Slit2 and Slit3 are highly expressed in the choroid plexus epithelium (Figures S4A and S4B). Although none were expressed in the OB primordium, Slit proteins are present in the cerebro-spinal fluid of E12.5 mouse embryos (Borrell et al., 2012), thus being readily available as ligands for Robo receptors expressed by OB RGCs. Analysis of the OB in Slit1/2−/− embryos showed that they are phenocopies of Robo1/2−/− mutants: scarcity of neurons in ML/CP and VZ and high density of apical mitoses, similar to the NCx (Figures S5E–S5H). This supported that Slit/Robo signaling promotes direct neurogenesis in the OB.
Accelerated early growth of the OB has been proposed to be triggered by pioneer axons from the olfactory epithelium onto OB progenitor cells (Gong and Shipley, 1995). Olfactory sensory neurons express and require Robo receptors to target the OB (Marillat et al., 2002, Nguyen-Ba-Charvet et al., 2008), so the deficient direct neurogenesis in OB of Robo1 and Robo2 mutants could be an indirect phenotype of RGCs from axon guidance defects. To test this, we used in utero electroporation to manipulate Robo signaling selectively in VZ progenitor cells of the OB in wild-type (WT) embryos, where pioneer olfactory axons are intact. We blocked Robo1 and Robo2 by overexpressing dominant-negative variants (dnR1 and dnR2) (Stein and Tessier-Lavigne, 2001) as shown by axon growth cone collapse assays (Figure S6A). Overexpression of dnR1/2 in OB RGCs reduced by 50% the abundance of GFP+ neurons in the VZ (Figures 4A to 4C). Conversely, we activated Robo signaling by electroporation of constitutively active Robo receptors (mR1 and mR2) (Bai et al., 2011, Stein and Tessier-Lavigne, 2001) as shown by axon branching assays (Figure S6B). Overexpression of mR1/2 increased the already high abundance of neurons in the VZ of OB. This demonstrated that Robo receptors drive RGCs into direct neurogenesis independently from olfactory axons. Remarkably, in these experiments, we also observed significant variations of neuron numbers in the VZ among GFP-negative cells (Figures 4B and 4C), suggesting that Robo signaling influences direct neurogenesis both cell-autonomously and non-autonomously.
Figure S6.

Functional Validation of Genetic Reagents and Test of Interaction between Robo and Notch Signaling, Related to Figures 4, 5, and 7
(A and B) Validation of dnRobo and myrRobo as dominant-negative and constitutively active for Robo signaling, respectively. In (A), growth cone collapse assay of growing axons from explants of embryonic mouse retinas, electroporated to express Gfp or dnRobo and exposed to recombinant Slit protein or vehicle solution. Failure of response to Slit upon dnRobo-overexpression demonstrates its dominant-negative effect (n = 44-58 growth cones per group, 3 independent experiments). In (B), branching assay of growing axons from single neurons of embryonic rat dorsal root ganglion, overexpressing Gfp alone or with myrRobo constructs as indicated. Exuberant axonal branching typically elicited by Slit-Robo signaling occurs in myrRobo-expressing neurons in the absence of Slit, demonstrating constitutive activation of Robo signaling (n = 5-10 neurons per group).
(C–F) Validation of crispr constructs for disruption of Dll1 in mouse and human. (C) Top, sequence of the gRNA targeting mouse Dll1, and schematic of the orientation and location of the targeting site (black arrow) within the mDll1 coding sequence (gray bar). Bottom, validation of Crispr-mediated editing of the mDll1 locus upon electroporation with gDll1 plus Cas9, but not with Cas9 alone. Different lanes correspond to independent electroporated embryos. M, molecular weight marker. Arrow indicates 1,025 bp amplicon, arrowheads indicate the products of PCR amplicon digestion by Syrveyor Nuclease (656 + 368 bp), absent in the Cas9-alone lanes. (D) Left, sequence of the gRNA targeting human Dll1, and schematic of the orientation and location of the targeting site (black arrow) within the hDll1 coding sequence (gray bar). Right, chromograms for genome sequence validation of Crispr-mediated editing of the hDll1 locus upon electroporation of cerebral organoid with gDll1 plus Cas9. A 270bp fragment was inserted at position 54 of the coding sequence, introducing a STOP codon in position 76. (E and F) Effect of electroporating crDll1 in NCx (green cells) on the abundance of Dll1 protein (red). Details are examples VZ cells loosing Dll1 protein (arrowheads) from the cell surface upon crDll1 (n = 3 embryos per group).
(G–K) Antibody stain for GFP and Robo1 or Dll1 in NCx at E13.5 upon electroporation of the indicated plasmid combinations at E12.5, and quantifications (paired t test). Arrowheads indicate area of increased Robo (n = 3 embryos per group).
Values are mean + SEM; paired or independent samples t tests; ∗p < 0.05; ns, not significant. Scale bars: 30 μm (E), 50 μm (G and H).
Figure 4.

Robo Receptors Cooperate with Dll1 to Regulate Direct Neurogenesis in OB and NCx
(A–C) Experimental design to manipulate Robo function in OB primordium, representative examples (arrowheads indicate Tbr1+ cells), and quantifications.
(D and E) WT NCx electroporated with the indicated plasmid combinations, and ratio of density of Tuj1+ cells (red) in the VZ between electroporated and non-electroporated hemispheres. Dll1 rescue refers to electroporation with mR1/2+crDll1+chicken Dll1.
(F–K) ISH for Notch pathway genes in control and Robo1/2−/− embryos at E12.5. Dashed line in (F) indicates area with low Dll1 mRNA, corresponding to OB primordium. Panels shown in (F) and (I) are tiled images.
(L and M) WT OB electroporated with the indicated plasmid combinations, and abundance of Tbr1+ cells in the VZ.
Red shadowing and asterisks in (C, E, and M) indicates values in each experimental group corresponding to GFP- cells. Values are mean + SEM; n = 3-5 embryos per condition; ∗p < 0.05; ∗∗p < 0.01; ∗∗∗p < 0.001; one-way ANOVA followed by χ2-test for co-localization, or t test for density. Scale bars: 100 μm (B,D,L), 300 μm (F,I), 100 μm (F’–H and I’–K).
See also Figure S6.
Robo-Dll1 Cooperation in Direct Neurogenesis
To test whether Robo signaling is a general mechanism promoting direct neurogenesis across the telencephalon, we overactivated Robo1/2 signaling in the NCx, where endogenous expression is low and direct neurogenesis is scarce (Figure 3A). Unexpectedly, overexpression of mR1/2 alone was insufficient to elicit a prominent increase of direct neurogenesis in NCx (Figures 4D and 4E). This suggested the possibility that other signals may cooperate with Robo to promote direct neurogenesis in OB, which may be absent in NCx.
The Notch signaling pathway is critical in regulating cortical neurogenesis, and it interacts with Slit/Robo signaling to regulate IPC production from RGCs (Borrell et al., 2012, Nelson et al., 2013). We analyzed the modulation of direct neurogenesis in this context. We found Delta-like 1 (Dll1), a canonical ligand of Notch1, expressed at markedly lower levels in OB than NCx, while Notch1 expression was similar (Figures 4F and 4G). Figures 4I and 4J shows that the local reduction of Dll1 levels in OB is absent in Robo1/2−/− mutants and thus is Robo-dependent. This suggested that reduced Dll1 expression might be downstream of Robo in regulating direct neurogenesis. However, CRISPR/Cas9-mediated impairment of Dll1 expression (crDll1) alone had no effect on direct neurogenesis in NCx (Figures 4D and 4E and S6C–S6F). Instead, the combination of crDll1 and mRobo1/2 was sufficient to increase direct neurogenesis prominently, doubling the abundance of neurons in the VZ of NCx (Figures 4D and 4E). This effect was blocked by additionally expressing chick Dll1, resistant to our CRISPR RNA guides against mouse Dll1, demonstrating their specificity and the key involvement of Dll1 in this process (Figure 4E).
Next, we tested if Dll1 is also involved in regulating direct neurogenesis in OB. In utero overexpression of Dll1 in OB decreased direct neurogenesis but less effectively than dnR1/2 (Figures 4L and 4M). Importantly, the two manipulations combined had the greatest effect, indicating that direct neurogenesis in OB is also induced by the coincident occurrence of high Robo and low Dll1 levels. Thus, high Robo signaling, with the necessary co-operation of low Dll1, is a conserved mechanism driving direct neurogenesis in both OB and NCx.
Robo-Dll1 Promotes Direct Neurogenesis via Jagged
Dll1 binding and activating Notch1 drives Hes1 transcription and then maintenance of the stem cell fate (Ishibashi et al., 1995). Accordingly, alongside low Dll1, we found extremely low levels of Hes1 mRNA in OB compared to NCx. In the OB of Robo1/2 mutants, Hes1 levels were much higher than in WT littermates, similar to NCx (Figures 4H and 4K). This difference was not due to Hes1 being downregulated in NCx of Robo1/2−/− mutants, shown previously (Borrell et al., 2012), as that effect is extremely modest compared to the dramatic difference observed here in OB. This suggested that Notch activity might be lower in OB and might be a requisite to promote direct neurogenesis. Our above manipulations caused changes in direct neurogenesis that included a cell-non-autonomous component (GFP− cells), consistent with changes in Notch-Dll lateral inhibition. To confirm differences in Notch activity between OB and NCx, we analyzed levels of Hes5 mRNA expression, a canonical downstream effector and faithful readout of Notch activation. We found identical levels of Hes5 in OB and NCx (Figures 5A and 5B), indicating that levels of Notch activity are not significantly different between these regions, and thus, this does not determine the choice between direct and indirect neurogenesis.
Figure 5.

Robo/Dll1/Jag Signaling Drives Direct Genesis of Deep-Layer Corticofugal Neurons
(A–G) ISH stains for Notch pathway genes in control and Robo1/2−/− embryos at E12.5, and intensity quantification (paired t test).
(H) ISH stains for Jag1 and 2 in NCx upon electroporation of the indicated plasmid combination (EP), and quantification of intensity (ratio to contralateral non-electroporated hemisphere; paired t test).
(I) WT NCx electroporated with the indicated plasmid combinations, and ratio of density of Tuj1+ cells (red) in the VZ between electroporated and non-electroporated hemispheres (t test).
(J) Experimental design to identify the fate of neocortical neurons born by direct neurogenesis.
(K–M) WT NCx electroporated with the indicated plasmid combinations, and laminar distribution of all GFP+ cells (L), top) and with 100% BrdU label (born by direct mode, arrowheads; [L], bottom; one-way ANOVA followed by χ2-test).
(N–P) Identification of neuron types in WT OB electroporated with the indicated plasmid combinations, and quantification (χ2-test). Left plot is cell types in any layer; right plot is cell types sorted by layers.
Values are mean + SEM, n = 3–5 embryos per group; ∗’p = 0.050; ∗p < 0.05; ∗∗p < 0.01; ∗∗∗p < 0.001. Scale bars: 50 μm (A–I, M, and O), 400 μm (K).
See also Figures S6 and S7.
Given the scarcity of Dll1 in OB, we searched for other ligands activating Notch. We found Jagged (Jag) 1 and Jag2 expressed in OB at modest levels but nearly double to NCx, with minimal expression, while they were nearly absent from OB in Robo1/2−/− mutants (Figures 5C–5G). These expression patterns were complementary to Dll1 and similar to Robo1 and Robo2, such that high Jag expression correlated with abundant direct neurogenesis. Consistent with this, the combined gain of Robo and loss of Dll1 in NCx (in utero electroporation of mR1/2+crDll1), which drives direct neurogenesis, elicited the ectopic expression of Jag1 and Jag2 (Figure 5H). This suggested that upregulation of Jag may be downstream of Robo-Dll1 to mediate direct neurogenesis. Remarkably, overexpression of Jag1 alone was sufficient to significantly increase direct neurogenesis in NCx (Figure 5I).
The above results showed that Robo, Dll1, and Jag are active players in defining direct versus indirect neurogenesis in mouse. Our analyses of Robo1/2−/− mutants demonstrated that high Robo reduces Dll1 and increases Jag1 and Jag2 expression, and experimental gain of Robo and loss of Dll1 increases Jag1. Under both these conditions, direct neurogenesis predominates. To determine if Dll1 or Jag1 regulate Robo expression reciprocally, we electroporated crDll1 or Jag1 in the NCx of WT embryos. Levels of Robo protein increased slightly (though significantly) upon electroporation of crDll1 but were not affected by Jag1 overexpression, which also did not alter levels of Dll1 at our resolution of detection (Figures S6G–S6K). Our results demonstrated that under conditions of high Robo and low Dll1, Jag1 expression is enhanced, driving direct neurogenesis.
Direct Neurogenesis Produces Deep Layer Corticofugal Neurons
While the OB is archaic in origin and common to amniotes, the NCx is an evolutionary innovation of mammals (Puelles et al., 2000, Rowe et al., 2011). Our above results supported the notion that the evolutionary expansion of the amniote cerebral cortex into the mammalian NCx resulted from a reduction in direct neurogenesis, favoring the more productive indirect mode. A prominent feature linked to expansion of the amniote cortex is the generation of new neuron types, forming the superficial layers 2/3, exclusive to mammals (Dugas-Ford and Ragsdale, 2015). If indirect neurogenesis contributed to this innovation, forced direct neurogenesis in mouse NCx should lead to a loss of superficial layer neurons and gain in deep layers, constituent of the reptile and avian cortex homolog. We studied the fate of mouse cortical neurons produced by direct neurogenesis upon mR1/2+crDll1 overexpression. We labeled neurons born directly from RGCs by combining a single BrdU pulse with in utero electroporation of GFP at E12.5 and analyzed their fate at maturity (Figure 5J). Overexpressing mR1/2+crDll1 caused a specific loss of GFP+ cells from layer 2/3 and increase in deep layers (Figures 5K and 5L). Layer-specific marker analysis showed that this change in position was not due to defective neuron migration but to the specific increase in bona fide deep layer neurons (Ctip2+) at the expense of superficial layers (Cux1+; Figures S7A–S7C). Focused on GFP+ cells retaining 100% of BrdU (Figure 5M), we found that induced direct neurogenesis led to 3–5 times more layer 5 and 6 neurons expressing Tbr1 and Ctip2 (Figures 5L and S7D) than controls. We confirmed the identity of directly generated neurons in layer 5 by tracing their cortico-spinal axonal projections with CTB (Figure S7E). In mR1/2+crDll1 mice, we found a higher abundance of CTB+ electroporated neurons and a much greater proportion of CTB+GFP+ neurons formed by direct neurogenesis (100% BrdU; Figures S7F and S7G), confirming their subcerebral projection identity.
Figure S7.

Robo/Dll1 Signaling Drives Direct Genesis of Deep-Layer Corticofugal Neurons and Regulates Direct Neurogenesis in Brain Regions with Ancestral Origin, Related to Figure 5
(A–D) Analysis of fate marker expression by directly generated neurons (arrowheads) upon electroporation with the indicated plasmid combinations. Plots in (C) show the proportion of GFP+ cells within each layer (top) and of all GFP+ cells in NCx (bottom) expressing each marker. Plots in (D) show the proportion of cells positive for GFP and Tbr1 (left), or Ctip2 (right), within each layer that retain 100% BrdU label (n = 3-5 animals per condition; one way ANOVA followed by χ2-test).
(E) Experimental design to determine axonal projection identity of neocortical neurons born by direct neurogenesis at E12.5.
(F and G) Retrograde labeling of corticospinal-projecting neurons generated directly upon electroporation with the indicated plasmid combinations, and analysis of abundance. Insets show soma of single CTB+GFP+ neurons. Plots in (G) show proportion of CTB-traced neurons expressing GFP (top; arrowheads in (F) and proportion of CTB+GFP+ neurons retaining 100% BrdU label (bottom) (n = 3-4 animals per condition; χ2-test).
(H) Tuj1 and PH3 stains of the embryonic spinal cord and hippocampal primordium, showing that virtually all mitoses are apical and neurons are very abundant in the VZ of both regions, two traits indicative of direct neurogenesis.
(I) ISH in coronal sections of hippocampus and adjacent neocortex at E12.5. Expression of Robo1, Robo2, and of Slit2 and Slit3, mRNAs is most prominent in hippocampus primordium (H) and choroid plexus epithelium (CPE), respectively.
(J and K) Distribution and abundance of Tuj1+ / Tbr1+ neurons (arrowheads) in hippocampal primordium and adjacent neocortex from control and Robo1/2−/− mutants at E12.5 (n = 3 embryos per group; t tests).
Values are mean + SEM; ∗p < 0.05; ∗∗p < 0.01; ∗∗∗p < 0.001; ∗∗∗p < 0.001. Scale bars: 200 μm (A and B); 100 μm (I), 50 μm (F and J).
We also investigated the fate of OB neurons generated upon blocking direct neurogenesis with dnR1/2+Dll1. Compared to controls, reduced direct neurogenesis led to a loss of Reln+ and 42% gain of Reln− cells, combined with the displacement of a significant number of Reln+ cells from the mitral cell layer to the inner plexiform layer (Figures 5N–5P), as also observed in Robo1/2−/− mutants (Figure S5D). Together, our results reinforced the notion that reduction of direct neurogenesis during embryonic development was a key event in the evolution of the amniote cerebral cortex, expanding neuron production and cortical size, as well as driving the generation of superficial layer neurons in NCx. At the molecular level in the mouse, this is achieved by attenuation of Robo expression levels.
Robo Function in Cortical Neurogenesis Is Conserved in Birds and Snakes
We next examined the occurrence of direct neurogenesis in other parts of the mammalian brain that are evolutionarily old like the OB, such as the hippocampus (part of archicortex, or “old cortex”) and spinal cord (SC) (Puelles et al., 2000, Rowe et al., 2011). Neurogenesis in SC occurs directly from RGC divisions (Das and Storey, 2014), evidenced by the lack of basal mitoses and abundance of Tuj1+ neurons in the VZ (Figure S7H). The hippocampal primordium also contains numerous Tuj1+ and Tbr1+ neurons in the VZ, similar to SC and OB and contrary to the NCx, indicative of ongoing direct neurogenesis (Figure S7J). At the molecular level, Robo1 and Robo2 expression in the VZ is relatively higher in hippocampus than NCx (Figure S7I). Robo1/2−/− embryos displayed a dramatic reduction of neurons in the hippocampal VZ, down to levels similar to the NCx (Figures S7J and S7K). This finding supported that direct neurogenesis controlled by Robo receptors may be an evolutionarily conserved mechanism of telencephalic development.
To determine if Robo driving direct neurogenesis in the cerebral cortex is a mechanism conserved across amniote phylogeny, we analyzed the homolog of the embryonic cerebral cortex in two sauropsids: a bird (chicken) and a squamate reptile (African house snake). In chick embryos, two domains of the dorsal pallium (DP) were clearly distinguishable: a medial domain (mDP), containing virtually no basal mitoses and many Tuj1+ cells in the VZ, indicative of direct neurogenesis; and a lateral domain (lDP), with many basal mitoses and few Tuj1+ cells in the VZ, indicative of indirect neurogenesis (Figures 6A–6D). Concomitantly, the VZ of mDP exhibited high mRNA levels of Robo1 and low Dll1, whereas the lDP displayed low Robo1 and high Dll1 levels (Figures 6E–6H). These differences between chick mDP and lDP were remarkably similar to those between the mouse OB and NCx. Importantly, levels of Robo1 in the VZ were higher in chick than in mouse, outlining a progressive and significant reduction of Robo expression from chick mDP to chick lDP, mouse OB, and mouse NCx (Figure 6I). We tested the functional significance of these regional differences by in ovo electroporation of chick embryos. Overexpression of dnR1/2+Dll1 in the mDP led to a significant decrease in Tbr1+ VZ neurons and a 3-fold increase in basal mitoses, promoting indirect neurogenesis (Figures 6J–6L). Similar to the mouse NCx, only modification of Robo and Dll together, but not alone, affected significantly the balance direct versus indirect neurogenesis (Figure 6M). Identical results were obtained in lDP (Figures 6N and 6O). The changes that were most dramatic evidenced the existence of a cell non-autonomous component (changes in GFP− cells; Figures 6L and 6O), similar to our findings in mouse and consistent with a conserved signaling mechanism. Conversely, overexpression of mR1/2 in lDP led to a dramatic increase in Tbr1+ VZ neurons and loss of basal mitoses, promoting direct neurogenesis (Figures 6N and 6O). Importantly, the basal mitoses that emerged most abundantly upon dnR1/2+Dll1 were Tbr2+ (Figures 6P and 6Q), excluding that this was simply the result of delamination of RGCs and demonstrating a dramatic increase in IPCs. Finally, we examined the long-term consequences of promoting indirect neurogenesis in the chick DP by clonal analysis of single progenitor cell lineages (Figure 6R). Our results showed that promoting indirect neurogenesis by overexpressing dnR1/2+Dll1 nearly doubled the neurons produced per VZ progenitor with a much greater number of clones containing more than 4 neurons (up to 9 per clone; Figures 6S–6U). These results demonstrated that the balance between direct and indirect neurogenesis in the DP of birds, including amplification of IPCs, is regulated by the levels of Robo-Dll1 signaling, as in the mammalian OB and NCx.
Figure 6.

Robo/Dll1 Signaling Regulates the Balance between Direct Neurogenesis and IPC Abundance in Chick Dorsal Pallium
(A–D) Analysis of chick dorsal pallium at 6 days post-ovoposition (dpo), showing many neurons in the VZ (solid arrowheads) in the medial part (mDP; B) and basal mitoses (open arrowheads) in the lateral (lDP; C; n = 3 embryos; t tests).
(E–H) ISH in chick DP at 6 dpo, and quantifications of intensity (au, arbitrary units). High magnifications show chkRobo1 (E’ and E”) and chkDll1 (G’ and G”) in the indicated regions. Panel shown in (G) is a tiled image.
(I) qPCR analysis in the VZ of the regions and species indicated. Values are ratio Robo1 to Gapdh (n = 12–15 replicates; paired or independent samples t tests).
(J–O) Experimental design to manipulate in ovo Robo and Dll1 in mDP and lDP, representative examples and quantifications of neurons in the VZ (Tbr1+) and basal mitoses (PH3, open arrowheads; n = 3-5 embryos per group; t tests in L and Q; one-way ANOVA followed by t tests in M and O). Red shadowing and asterisks in (L) and (O) indicate values within group corresponding to GFP− cells.
(P and Q) Expression of Tbr2 in basal PH3+ mitoses (solid arrowhead, Tbr2+; open arrowhead, Tbr2−) upon electroporation of dnR1/2+Dll1 in mDP (as in J and K), and quantification (n = 4–5 embryos; t tests).
(R–U) Analysis of neuronal clones (GFP+RFP+Tuj1+) upon overexpression of dnR1/2+Dll1+Gfp, representative examples and quantification (n = 52 clones Gfp, 59 clones dnR1/2+Dll1+Gfp, 3–7 embryos; t test or χ2-test).
Values are mean + SEM; ∗p < 0.05; ∗∗p < 0.01; ∗∗∗p < 0.001. Scale bars: 100 μm (A, E, F, and G), 50 μm (B, C, K, N, P, and S).
To extend our analyses to a wider range of amniotes, we studied the dorsal cortex (DC) of the African house snake (Figure 7A). In the DC of snake embryos, we found only apical mitoses accompanied by frequent neurons in the VZ (Figures 7B and 7C), but no basal mitoses, indicating that direct neurogenesis is the only mode of embryonic cortical neurogenesis in this reptile. As in mouse OB and chick mDP, Robo levels in the VZ of the snake DP were high (for Robo2, as Robo1 was not expressed; data not shown) and Dll1 levels were low (Figures 7D and 7E), again consistent with this combination promoting direct neurogenesis. To test whether this signaling axis regulates the mode of cortical neurogenesis also in squamate reptiles, we overexpressed dnR1/2+Dll1 in snake embryos by in ovo electroporation (Figure 7F). Figures 7G and 7H show that this manipulation in the DP of snake embryos led to fewer neurons in the VZ and thus reduced direct neurogenesis. This manipulation also led to the emergence of abundant basal mitoses (Figure 7H, red circles), as we had observed in chick. The majority of basal mitoses were GFP− (73%, n = 33; Figure 7G’), consistent with a significant contribution of cell non-autonomous mechanisms, as in mouse and chick. Remarkably, these basal mitoses systematically aligned at the basal border of the VZ, seemingly forming an SVZ like in the mammalian NCx. This is a most outstanding outcome because the presence of IPCs and basal mitoses in the developing cerebral cortex, forming a secondary germinal layer, are gold-standard milestones of neocortex mammalian evolution that are not existent in reptiles (Cheung et al., 2007).
Figure 7.

Conserved Function of Robo/Dll1 in Snake and Human Cortex to Regulate the Balance between Direct Neurogenesis and Basal Progenitor Formation
(A) Simplified phylogenic tree of amniotes with approximate reference to relative brain size and layout.
(B and C) Dorsal cortex of snake embryo at 6 dpo with neurons in the VZ (arrowheads) and apical but not basal mitoses (red).
(D and E) ISH against snake Robo2 and Dll1 in snake dorsal cortex (DC) at 6 dpo. These panels are tiled images.
(F–H) Experimental design for in ovo genetic manipulation of snake DC, representative examples and quantifications (n = 3–4 embryos per group; t tests). White arrowheads indicate basal mitoses, green arrowheads indicate GFP+ cells, typically sparse. Details in (G’) are examples of basal mitoses in GFP− cells. Right plot in (H) shows the location of PH3+ nuclei (circles) relative to the apical-basal extent of the VZ.
(I–K) Experimental design for genetic manipulation of human cerebral organoids, examples, and quantifications (n = 3–4 organoids per group; t tests). Arrowheads indicate NeuN+ neurons in the VZ. Red shadowing in (H) and (K) indicates values within group corresponding to GFP- cells.
Values are mean + SEM; ∗p < 0.05; ∗∗p < 0.01; ∗∗∗p < 0.001; ns, not significant. MZ, mantle zone. Scale bars: 150 μm (B, D, and E), 75 μm (C and G), 50 μm (J).
See also Figure S6.
The above findings demonstrated that high Robo signaling in the cortex of birds and reptiles promotes direct neurogenesis and blocks basal progenitor formation, limiting cortex size. In contrast, endogenous attenuation of Robo signaling in the rodent NCx reduces direct neurogenesis and promotes IPC generation, increasing neuron production and cortical size. Given that the human neocortex is one of the largest among mammals, we investigated if this same signaling mechanism operates in the early human embryo. We generated cerebral organoids from human iPS cells and, after 39 days in culture, electroporated mRobo1/2+crDll1 (Figures 7I and S6D) (Lancaster and Knoblich, 2014). The overall morphology and appearance of organoids were not different between controls and those receiving mR1/2+crDll1. They were mainly comprised of a VZ, containing GFP+ cells with the elongated morphology typical of RGCs, plus a thin mantle zone (MZ) filled with NeuN+ and multipolar GFP+ cells, neuronal features (Figure 7J). NeuN+ neurons were rarely seen within the VZ. PH3+ mitotic nuclei were found abundant at the apical surface of VZ and in fewer numbers at its basal side, bordering the MZ. Organoid regions electroporated with mR1/2+crDll1 displayed 3 times more NeuN+ neurons in the VZ and only 20% of basal PH3+ mitoses of adjacent non-electroporated regions within the same organoid ventricles or of organoids receiving control plasmids (Figures 7J and 7K). As in our previous experimental models, increased direct neurogenesis included a significant increase in GFP− neurons, indicating the involvement of cell-non-autonomous mechanisms. These results demonstrated that Robo signaling is also endogenously attenuated in VZ cells of human cerebral organoids, where it limits direct neurogenesis and promotes IPC generation and SVZ formation, as in mouse NCx.
Discussion
The evolutionary emergence of mammals was critically marked by the formation of the NCx. Compared to the small and relatively simple dorsal cortex of other amniotes, the mammalian NCx is much larger and complex, containing greater numbers and types of neurons. At the cellular level, this is associated with a binary decision of RGCs to generate or not generate neurons directly. In reptiles and birds, most cortical neurons are produced directly by RGCs, whereas in the mammalian NCx, most are produced indirectly via IPCs, greatly amplifying the neurogenic output (De Juan Romero and Borrell, 2015). Here, we identify for the first time a molecular signal that determines the mode of cortical neurogenesis across amniotes. Our results in snake, chicken, mouse, and human demonstrate that during amniote evolution, attenuation of Robo1 and Robo2 and increase of Dll1 expression in RGCs changed the balance from direct to indirect neurogenesis. Our findings strongly suggest that this genetic evolution was key for cortical expansion in amniotes and the emergence of landmark features of the mammalian neocortex: formation of IPCs, SVZ, and layer 2/3 neurons (Cheung et al., 2010).
The evolution of development is thought to be significantly driven by gene cooption, promoting new uses for an existing genetic toolkit (True and Carroll, 2002). Previous studies demonstrate that the emergence of novel genes was likely central in the evolutionary expansion of the human cerebral cortex (Florio et al., 2015, Florio et al., 2017). Our results demonstrate for the first time the existence of a new and orthogonal mechanism driving cortical expansion in evolution: regulation of the activity levels of a highly conserved signaling pathway (Brose et al., 1999). High Robo signaling drives direct neurogenesis, limiting neuron number and size of telencephalic structures, as in OB and nonmammalian cortex, while low Robo allows indirect neurogenesis, producing basal progenitors and more neurons as in the mammalian NCx. However, complete absence of Robo, as in knockout mice, is severely deleterious to basal progenitors, impairing further expansion of NCx (Borrell et al., 2012). In the OB of these mutants, this deleterious effect combines with the suppressed direct neurogenesis, resulting in much-reduced neuron production and OB size. RGCs in direct neurogenesis mode have a longer cell cycle than in indirect mode, so loss of Robo also alters frequency of their apical mitoses. The magnitude of this effect varies between cortical regions (Borrell et al., 2012 and this study), likely owing to axial gradients in cortical development.
Our results show that the mode of neurogenesis is determined by the interaction between Robo and Notch signaling. High levels of Robo block expression of Dll1, and this combination promotes expression of Jag1 and Jag2, driving direct neurogenesis, as observed in OB and contrary to the NCx. The classical Dll-Notch lateral inhibition pathway establishes that the levels of Dll1 determine the level of Notch activity on signal-receiving cells and thereon the fate of daughter cells (Kawaguchi et al., 2008). Here, we find that a shift in Notch ligand composition, without a significant variation in total Notch activity, defines the fate of daughter cells (neurons or IPCs) and thus the mode of neurogenesis. A similar mechanism determines the mode of tumor angiogenesis, depending on whether the Notch ligand is Jag or Dll (Kangsamaksin et al., 2015). Different Dll ligands activate Notch with different temporal dynamics, with consequences on downstream signaling including Hes1 expression and fate of daughter cells in the chick neural crest (Nandagopal et al., 2018). Accordingly, our current and previous results from OB and NCx in Robo mutants (Borrell et al., 2012) congruently suggest that the presence or absence of Jag1 and Jag2 in the context of high or low levels of Robo expression, as in OB and NCx respectively, modifies how Robo influences Hes1 expression in the telencephalon.
Previous studies of Dll1 manipulation have shown premature neurogenesis upon massive (but not sparse) loss of Dll1 (Kawaguchi et al., 2008). This may explain why our sparse electroporation of crDll1 alone is not sufficient to drive direct neurogenesis in NCx but requires the cooperation of Robo signaling to sufficiently block Dll1. We find that this increased direct neurogenesis in high Robo and loss of Dll1 may be mediated by upregulation of Jag1 and Jag2 and is coherent with the inverse effect of sparse overexpression of Dll1, promoting indirect neurogenesis (Kawaguchi et al., 2008). Future investigations should detail the molecular links between Robo, Dll, and Jag to regulate modes of neurogenesis.
The influence of Robo signaling on cortical expansion extends much beyond driving direct neurogenesis. Our results show that endogenous high Robo signaling prevents the formation of basal progenitors in the snake dorsal cortex, where they are virtually absent. Particularly remarkable is our finding in the dorsal cortex of snake embryos: experimental loss of Robo and gain of Dll1 is sufficient to induce de novo formation of abundant basal progenitors. These align basal to the VZ forming a proto-SVZ, recapitulating in a snake a process otherwise restricted to the mammalian NCx. Altogether, our experiments potentially uncover the key events that occurred during evolution of the mammalian brain: attenuation of Robo receptor signaling intensity was responsible for the evolutionary emergence of cortical basal progenitors and the SVZ; and the blockade of direct neurogenesis, which combined allowed the subsequent phenomenal expansion and complexification of the mammalian cerebral cortex.
STAR★Methods
Key Resources Table
| REAGENT or RESOURCE | SOURCE | IDENTIFIER |
|---|---|---|
| Antibodies | ||
| Rat monoclonal anti-BrdU | Abcam | Cat# ab6326, RRID:AB_2313786 |
| Rabbit polyclonal anti-cleaved Caspase 3 | Cell signaling | Cat# 9661, RRID:AB_2341188 |
| Chicken polyclonal anti-GFP | Aves Lab | Cat# GFP-1020, RRID:AB_10000240 |
| Rabbit polyclonal anti-Ki67 | Abcam | Cat# ab15580, RRID:AB_443209 |
| Rabbit polyclonal anti-phosphohistone H3 | Upstate | Cat# 06-570, RRID:AB_310177 |
| Rabbit polyclonal anti-Tbr1 | Abcam | Cat# ab31940, RRID:AB_2200219 |
| Rabbit polyclonal anti-Tbr2 | Abcam | Cat# ab23345, RRID:AB_778267 |
| Mouse monoclonal anti-bIII tubulin | Covance | Cat# MMS-435P, RRID:AB_2313773 |
| Rabbit polyclonal anti-Pax6 | Merck Millipore | Cat# AB2237, RRID:AB_1587367 |
| Rabbit polyclonal anti-GABA | Sigma | Cat# A2052, RRID:AB_477652 |
| Rabbit polyclonal anti-Reelin | MBL | Cat# D223-3, RRID:AB_843523 |
| Rabbit polyclonal anti-Cux1 | Santa Cruz | Cat# sc-13024, RRID:AB_2261231 |
| Rat monoclonal anti-Ctip2 | Abcam | Cat# ab18465, RRID:AB_2064130 |
| Mouse monoclonal anti-NeuN | Merck Millipore | Cat# MAB377, RRID:AB_2298772 |
| Sheep polyclonal anti-Dll1 | R&D Systems | Cat# AF3970, RRID:AB_2092836 |
| Goat polyclonal anti-Robo1 | R&D Systems | Cat# AF1749, RRID:AB_354969 |
| Goat polyclonal anti-Robo2 | R&D Systems | Cat# AF3147, RRID:AB_2181857 |
| Rabbit polyclonal anti-DsRed | Clontech Laboratories | Cat# 632496, RRID:AB_10013483 |
| Mouse monoclonal anti-c-Myc (9E10) | Santa Cruz | Cat# sc-40, RRID:AB_627268 |
| Donkey Alexa488 anti-mouse IgG | Invitrogen | Cat# A-21202, RRID:AB_141607 |
| Donkey Alexa555 anti-mouse IgG | Invitrogen | Cat# A-31570, RRID:AB_2536180 |
| Donkey Alexa488 anti-rabbit IgG | Invitrogen | Cat# A-21206, RRID:AB_141708 |
| Donkey Alexa555 anti-rabbit IgG | Invitrogen | Cat# A-31572, RRID:AB_162543 |
| Donkey Alexa488 anti-chicken IgY | Jackson Immunoresearch | Cat# 703-545-155, RRID:AB_2340375 |
| Cy2-streptavidin | Jackson Immunoresearch | Cat# 016-220-084, RRID:AB_2337246 |
| Cy5-streptavidin | Jackson Immunoresearch | Cat# 016-170-084, RRID:AB_2337245 |
| Goat Biotinylated anti-Rabbit IgG | Vector Laboratories | Cat# BA-1000, RRID:AB_2313606 |
| Goat Biotinylated anti-Rat IgG | Vector Laboratories | Cat# BA-9400, RRID:AB_2336202 |
| Donkey Cy3 Fab fragment anti-Rat IgG | Jackson Inmmunoresearch | Cat# 712-167-003, RRID:AB_2340670 |
| Donkey Cy3 Fab fragment anti-Rabbit IgG | Jackson Inmmunoresearch | Cat# 711-167-003, RRID:AB_2340606 |
| Donkey Cy3 anti-Mouse IgG | Jackson Inmmunoresearch | Cat# 715-165-150, RRID:AB_2340813 |
| Alkaline phosphatase-coupled anti-digoxigenin Fab | Sigma | Cat# 11093274910, RRID:AB_514497 |
| Donkey Alexa555 anti-Goat IgG | Thermo Fisher Scientific | Cat# A-21432, RRID:AB_2535853 |
| Donkey Alexa 555 anti-Sheep IgG | Thermo Fisher Scientific | Cat# A-21436, RRID:AB_2535857 |
| Bacterial and Virus Strains | ||
| MMLV-based RV CAG-GFP | Tashiro et al., 2006 | N/A |
| MMLV-based RV CAG-RFP | Tashiro et al., 2006 | N/A |
| Chemicals, Peptides, and Recombinant Proteins | ||
| Cholera toxin subunit B (CTB) | Thermo Fisher Scientific | Cat# C22842 |
| Nucleofector Kits for Rat Neurons | Lonza | Cat# V4XP-3012 |
| Recombinant Mouse Slit2 Protein, CF | R&D Systems | Cat# Q9R1B9 |
| 5-Bromo-2′-deoxyuridine | Sigma | Cat# B5002 |
| DIG RNA labeling mix | Roche | Cat# 11277073910 |
| T3 polymerase | Roche | Cat# RPOLT3-RO |
| T7 polymerase | Roche | Cat# 10881767001 |
| Sheep serum | Sigma | Cat# S2263 |
| BCIP | Roche | Cat# 10881767001 |
| NBT | Roche | Cat# 11087479001 |
| Blocking reagent | Roche | Cat# 11096176001 |
| Methylcellulose | Sigma | Cat# M0262 |
| DMEM/F12 | Thermo Fisher Scientific | Cat# 11320033 |
| Insulin-transferrin-sodium selenite media supplement | Sigma | Cat# I1884 |
| Corning® BioCoat Poly-L-Lysine 12 mm #1 German Glass Coverslip, 40/Pack, 80/Case | Thermo Fisher Scientific | Cat# 354085 |
| HyClone Fetal Bovine Serum | GE Healthcare | Cat# SV30160.03HI |
| Pluriton Reprogramming Medium | Stemgent | Cat# 00-0070 |
| carrier-free B18R Recombinant Protein | Stemgent | Cat# 03-0017 |
| Lipofectamine RNAiMAX Transfection Reagent | Thermo Fisher Scientific | Cat# 31985062 |
| STEMPRO hESC SFM | Thermo Fisher Scientific | Cat# A1000701 |
| Collagenase Type IV | Thermo Fisher Scientific | Cat# 17104019 |
| mTeSR1 | StemCell Technologies | Cat# 05850 |
| LDEV-Free Geltrex | Thermo Fisher Scientific | Cat# A1413302 |
| Geltrex | Thermo Fisher Scientific | Cat# A1413302 |
| StemPro Accutase Cell Dissociation Reagent | Life Technologies | Cat# A1110501 |
| Rock inhibitor Y-27632(2HCl) | StemCell Technologies | Cat# 72304 |
| Matrigel | Corning | Cat# 354234 |
| Critical Commercial Assays | ||
| SURVEYOR® Mutation Detection Kit - S100 | IDT | Cat# 706020 |
| pGEM®-T Easy Vector Systems | Promega | Cat# A1360 |
| Maxima First Strand cDNA Synthesis Kit for RT-qPCR | Thermo Fisher Scientific | Cat# K1641 |
| E.Z.N.A Plasmid DNA Mini Kit I | Omega | D6943-02 |
| GFX PCR DNA and Gel Band Purification Kit | GE Healthcare | 28-9034-70 |
| RNeasy® Mini Kit | QIAGEN | Ref.74104 |
| DNA, RNA and Protein Purification | Macherey-nagel | Ref.740410.50 |
| Fast SYBR Green Master Mix | Life Technologies | Cat# 4385612 |
| KAPA HiFi HotStart ReadyMix | Kapa Biosystems | Cat# KK2602 |
| Experimental Models: Cell Lines | ||
| Human embryonic kidney 293T | ATCC | Cat# CRL-3216, RRID:CVCL_0063 |
| Human induced pluripotent stem cells (hiPSCs) | ATCC | Cat# CRL-2522, RRID:CVCL_3653 |
| NuFF3-RQ IRR Human newborn foreskin feeder fibroblast | GlobalStem | GSC-3404 |
| Experimental Models: Organisms/Strains | ||
| Gallus gallus, fertilized chicken eggs | Granja Santa Isabel, Córdoba | www.granjasantaisabel.com; Cat#800008 |
| Lamprophis fuliginosus, fertilized snake eggs | Michel C. Milinkovitch’s lab | https://www.lanevol.org/ |
| ICR wild type | Jackson Laboratory | N/A |
| C57BL/6J mice | Jackson Laboratory | Cat#000664; RRID:SCR_004633; http://www.jax.org/ |
| Slit1/2 knock out [CD-1/129Sv/C57BL/6] | Borrell et al., 2012; Thomas Jefferson University | N/A |
| Robo1/Robo2 knock out | Instituto de Neurociencias de Alicante; Borrell et al., 2012 | N/A |
| GAD65-GFP p(C57/b6) transgenic mice | López-Bendito et al., 2004 | N/A |
| Oligonucleotides | ||
| See Table S1 for Crispr guides, qRT-RNA primers, ISH probes and Crispr validation primers | This paper | N/A |
| Recombinant DNA | ||
| Expression plasmid: MMLV Retroviral CAG-GFP | F.H. Gage gift | N/A |
| Expression plasmid: MMLV Retroviral CAG-RFP | F.H. Gage gift | N/A |
| Expression plasmid: CMV-GP | F.H. Gage gift | N/A |
| Expression plasmid: CMV-VSVG | F.H. Gage gift | N/A |
| Expression plasmid: pCIG-Dll1 plasmid | J. Galcerán gift | N/A |
| Expression plasmid: pCAG-Floxp-EGFP-farnesylated | M. Gotz (Pilz et al., 2013) | N/A |
| Expression plasmid: pCAG-Cre | M. Gotz (Pilz et al., 2013) | N/A |
| Expression plasmid: pCAG-Dn-Robo1 | E. Stein gift (Stein and Tessier-Lavigne, 2001) | N/A |
| Expression plasmid: pCAG-Dn-Robo2 | E. Stein gift (Stein and Tessier-Lavigne, 2001) | N/A |
| Expression plasmid: pCAG-myrRobo1 | Borrell et al., 2012 | N/A |
| Expression plasmid: pCAG-myrRobo2 | Borrell et al., 2012 | N/A |
| Expression plasmid: pSpCas9(BB)-2A-GFP (PX458) | Ran et al., 2013 | Addgene Plasmid #48138 |
| Expression plasmid: Jag1-HA pIRES | Koutelou et al., 2008 | Addgene Plasmid #17336 |
| Expression plasmid: pUC19ckDll1 | J. Galcerán gift | N/A |
| Expression plasmid: pCMV-Myc-NICD-FL | J. Galcerán gift | N/A |
| Plasmid ISH probe: MsRobo1 | O. Marín gift; Borrell et al., 2012 | N/A |
| Plasmid ISH probe: MsRobo2 | O. Marín gift; Borrell et al., 2012 | N/A |
| Plasmid ISH probe: MsSlit1 | O. Marín gift; Borrell et al., 2012 | N/A |
| Plasmid ISH probe: MsSlit2 | O. Marín gift; Borrell et al., 2012 | N/A |
| Plasmid ISH probe: MsSlit3 | O. Marín gift; Borrell et al., 2012 | N/A |
| Plasmid ISH probe: MsHes5 | R. Kageyama gift; Borrell et al., 2012 | N/A |
| Plasmid ISH probe: MsDll1 | J. L. R. Rubenstein; Borrell et al., 2012 | N/A |
| Plasmid ISH probe: MsNotch1 | J. L. R. Rubenstein; Borrell et al., 2012 | N/A |
| Plasmid ISH probe: MsReelin | Borrell and Marín, 2006 | N/A |
| Plasmid ISH probe: MsGrm1 | A. Fairén gift | N/A |
| Plasmid ISH probe: MsBhlhe22 | A. Fairén gift | N/A |
| Plasmid ISH probe: MsTbr2 | B. Rico gift | N/A |
| Plasmid ISH probe: MsJag 1 | Francois Guillemot gift | N/A |
| Plasmid ISH probe: MsJag 2 | Francois Guillemot gift | N/A |
| Plasmid ISH probe: ChRobo1 | Escalante et al., 2013 | N/A |
| Plasmid ISH probe: ChRobo2 | Escalante et al., 2013 | N/A |
| Plasmid ISH probe: ChDll1 | This paper | N/A |
| Plasmid ISH probe: SnRobo1 | This paper | N/A |
| Plasmid ISH probe: SnRobo2 | This paper | N/A |
| Plasmid ISH probe: SnDll1 | This paper | N/A |
| Software and Algorithms | ||
| Imaris 8 | Bitplane | http://www.bitplane.com/imaris; RRID:SCR_007370 |
| ImageJ (Fiji), version 2.0.0 | National Institutes of Health | https://imagej.net/Fiji; RRID:SCR_003070 |
| Neurolucida Neuron Tracing Software | MBF Bioscience | http://www.mbfbioscience.com/neurolucida; RRID:SCR_001775 |
| SPSS 19 | IBM | https://ibm-spss-statistics-64bits.softonic.com/?ex=BB-39.6; RRID:SCR_002865 |
| Snapgene | Biotech LLC | http://www.snapgene.com/; RRID:SCR_015053 |
| DNASTAR Lasergene Software | DNASTAR | https://www.dnastar.com/; RRID:SCR_000291 |
| Blue ZEN 2.3 pro | Zeiss | https://www.zeiss.com/microscopy/int/products/microscope-software/zen.html; RRID:SCR_013672 |
| FV10-ASW 4.2 Software | Olympus | http://www.olympus-lifescience.com/en/; RRID:SCR_014215 |
| LAS software | Leica Microsystems, Germany | https://www.leica-microsystems.com/products/microscope-software/; RRID:SCR_013673 |
| StepOne Real-Time PCR Software v2.2 | Applied Biosystems by Life technologies | https://www.thermofisher.com/mx/en/home/technical-resources/software-downloads/StepOne-and-StepOnePlus-Real-Time-PCR-System.html; RRID:SCR_014281 |
Contact for Reagent and Resource Sharing
Further information and request for resources and reagents should be directed to and will be fulfilled by the Lead Contact, Víctor Borrell (vborrell@umh.es).
Experimental Model and Subject Details
None of the animals used in our experiments had been previously used for other procedures. All subjects were test- and drug-naive. The animals presented a healthy status and were employed independently of their gender. The developmental stage of experimental models was chosen depending on the requirements of each experiment, as further detailed below.
Mice
To generate mice carrying loss-of-function alleles for Robo1, the third intron of the Robo1 gene was targeted with a cassette containing a splice acceptor consensus sequence including a transmembrane domain, β-galactosidase/neomycin fusion protein, an internal ribosome entry site (IRES), placental alkaline phosphatase, and a polyA tail. To generate the Robo2 mutant allele, 135 bp of Robo2 DNA, including the 3′ end of the putative first exon, and the 5′ end of the adjacent intron, was replaced with an IRES-tauLacZ expression cassette and a self-excising floxed sperm-specific cre recombinase/neomycin-resistance expression cassette. Homozygous Robo mutant mice were obtained crossing heterozygous sires and dams. For the GAD65 strain, the Gfp open reading frame without its own translation start site was fused in frame to the first exon of the GAD65 gene. WTs and mice carrying loss-of-function alleles for Robo1 and Robo2 were maintained in heterozygosity in an ICR background (Borrell et al., 2012) and WT mice and homozygous GAD65-GFP transgenics were in C57BL/6 background. Mice were kept on a 16:8h light:dark cycle at the Instituto de Neurociencias de Alicante in accordance with Spanish (RD 53/2013) and EU regulations, and experimental protocols were approved by the Universidad Miguel Hernández Institutional Animal Care and Use Committee (IACUC). Slit1/2 mutants were generated in a mixed CD-1/129Sv/C57BL/6 background as described in (Borrell et al., 2012) and maintained in a mixed CD-1/129Sv background at Thomas Jefferson University. Homozygous mutants were generated by timed mating of heterozygous sires and dams. A portion of the coding region for the second leucine rich repeat, located in the 5′-region of the Slit1 gene was replaced with an IRES, a tauGFP fusion protein, and a neomycin resistance gene flanked by a PGK-1 promoter and polyA tail, and by two loxP sites. To avoid translated partial peptides a stop codon and the endoplasmic retention sequence, KDEL, was placed in frame in the Slit1 gene. Similar targeting strategy was used for Slit2 employing the same cassette without the KDEL element. The cassette replaced the likely signal sequence and part of the first leucine rich repeat (LRR1). These animal procedures follow the Guidelines for the Care and Use of Laboratory Animals of the National Institutes of Health with the approved IACUC protocols from the Thomas Jefferson University. The day of vaginal plug was considered as embryonic day (E) 0.5.
ICR WT and Robo1 and Robo2 loss-of-function mice were used for ISH tissue collection and marker analysis at E10.5, E11.5, E12.5, E14.5, E16.5 and E18.5. Electroporations for imaging experiments and clonal analysis were performed at E12.0. Cortical electroporations were done at E12.5 and olfactory bulb electroporations at E12.0. BrdU experiments were performed at E12.5 to determine cell cycle parameters and neuronal birthdating in the cortex. Mitral cell birthdating experiments in the OB were performed at E10.5, E11.5, E12.5 and E13.5. qPCR tissues were collected at E12,5. GAD65-GFP embryos were collected at E12.5 and E14.5 for interneuron migration analysis. For growth cone collapse experiments, E13.5 C57BL/6 WT embryos were used. Slit1/2 mutant and WT siblings embryos were used at E12.5 for marker analysis.
Chicken
Fertilized chicken (Gallus gallus) eggs were obtained from a poultry farm (Granja Santa Isabel, Córdoba) and incubated at 38°C. The day of lay was considered day 0 post-ovoposition (dpo). 6 dpo chickens were used for ISH and marker analysis. Electroporations for progenitor manipulation experiments or clonal analysis were performed at 4 dpo.
Snake
Fertilized eggs from snake (Lamprophis fuliginosus) were from a breeding colony at the University of Geneva and incubated at 28°C. Maintenance of, and experiments on, snakes were approved by the Geneva Canton ethical regulation authority (authorizations GE/82/14 and GE/73/16) and performed according to Swiss law. The day of lay was considered day 0 post-ovoposition (dpo). 6 dpo snakes were used for ISH and marker analysis. Electroporations were performed at 4 dpo for progenitor manipulation experiments.
Human organoids
Male human fibroblasts (CRL-2522, ATCC) were used to induce pluripotent stem cells (iPSCs). The use of iPS cells to generate cerebral organoids was approved by the Ethics Commission of LMU (Ludwig-Maximilians-Universität München), with the associated number 115-16. IPSCs and human organoids were cultured at 37°C, 5% CO2 and ambient oxygen level. During the whole period of cerebral organoid generation the medium was changed every day. Electroporations were performed in cerebral organoids at 39 days after the initial plating of the cells and fixed 7 days post-electroporation.
Retinal explant cultures
Retinal explants for growth cone collapse assays were cultured during 24 hr at 37°C, 5% CO2 and ambient oxygen level. C57BL/6 embryos were employed independently of their gender.
Methods Details
Immunohistochemistry and ISH
Animals were fixed with 4% paraformaldehyde (PFA) in phosphate buffer (PB) pH7.3 at 4°C. Embryos older than E16, postnatal mice and 14 dpo chicken were perfused transcardially and postfixed 30-60 min with 4% PFA. Smaller embryos were fixed by immersion during 30-60 min. Brains were cryoprotected with 30% sucrose, embedded in Cryo-medium Neg-50 (Thermo Scientific), frozen and sectioned under a cryostat at 20μm, 40μm for clonal analysis tissue. P21 mice brains were also cryoprotected, frozen and cryotome cut at 50μm. For immunohistochemistry, sections were permeabilized in PBS containing 0.25% Triton X-100 and blocked in 10% of Horse Serum and 2% Bovine Serum Albumin (BSA) during 2 hr. Brain slices were incubated with primary antibodies overnight in blocking solution, followed by appropriate fluorophore-conjugated secondary antibodies and counterstained with DAPI. For non-fluorescent stains, sections were further processed for the ABC histochemical method (Vector). Primary antibodies used were: anti-BrdU (1:200, rat monoclonal, Abcam); anti-cleaved Caspase 3 (1:150, rabbit polyclonal, Cell signaling); anti-GFP (1:1000, chicken polyclonal, Aves Lab.); anti-Ki67 (1:200, rabbit polyclonal, Abcam); anti-phosphohistone H3 (1:500, rabbit polyclonal, Upstate); anti-Tbr1 (1:500, rabbit polyclonal, Abcam); anti-Tbr2 (1:250, rabbit polyclonal, Abcam); anti-bIII tubulin (1:1000, mouse monoclonal, Covance); anti-Pax6 (1:1000, rabbit polyclonal, Merck Millipore); anti-GABA (1:1000, rabbit polyclonal, Sigma); anti-Reelin (1:500, mouse monoclonal, MBL); anti-Cux1 (1:500, rabbit polyclonal, Santa Cruz); anti-Ctip2 (1:500, rat monoclonal, Abcam); anti-NeuN (1:500, mouse monoclonal, Merck Millipore), anti-Dll (1:200, sheep polyclonal, R&D Systems); anti-Robo1 (1:250, goat polyclonal, R&D Systems); anti-Robo2 (1:250, goat polyclonal, R&D Systems); anti-DsRed (1:1000, rabbit polyclonal, Clontech), anti-c-Myc (1:2000, Santa Cruz). Secondary antibodies used were: biotinylated anti-Rabbit and anti-Rat IgG (Vector); Alexa488 and Alexa555 anti-mouse and anti-rabbit IgG (Invitrogen); Alexa488 anti-chicken IgY; Cy2- and Cy5-streptavidin (Jackson Immunoresearch); Cy3 Fab fragment anti-Rat and anti-Rabbit (Jackson Immunoresearch); Cy3 anti-Mouse (Jackson Immunoresearch); Alexa 555 anti-Goat and anti-Sheep (Thermo Fisher Scientific) and Alkaline phosphatase-coupled anti-digoxigenin Fab (Sigma); all diluted 1:200.
For ISH, sense and anti-sense cRNA probes were synthesized and labeled with digoxigenin (DIG; Roche Diagnostics) according to the manufacturer’s instructions. Briefly, 20 μm-thick frozen brain sections were prehybridized during 2 hr at 62°C in hybridization solution [50% formamide (Ambion), 10% dextran sulfate, 0.2% tRNA (Invitrogen), 1 × Denhardt’s solution (from a 50 × stock; SIGMA), 1 × salt solution (containing 0.2M NaCl, 0.01M Tris, 5mM NaH2PO4, 5mM Na2HPO4, 5mM EDTA, pH 7.5)] and hybridized with DIG-labeled cRNA probes overnight at 62°C diluted in hybridization solution. After sections were washed, blocking solution (MABT buffer solution 1X, 10% Sheep Serum, 10% Blocking reagent) during 2 hr at room temperature and alkaline phosphatase-coupled anti-digoxigenin Fab fragments in blocking solution were applied overnight at 4°C. For visualization of the labeled cRNAs, sections were incubated in nitroblue tetrazolium (NBT)/5-bromo-4-chloro-3-indolyl phosphate (BCIP) solution [3.4 μl/ml from NBT stock and 3.5 μl/ml from BCIP stock in reaction buffer (100mg/ml NBT stock in 70% dimethylformamide; 50mg/ml BCIP stock in 100% dimethylformamide; Roche)].
Bromodeoxyuridine labeling experiments
Bromodeoxyuridine (BrdU, SIGMA) was diluted at 10mg/ml in 0.9% NaCl and always administered at 50mg/kg body weight. For cell cycle length determination, multiple doses of BrdU were intraperitoneally injected in pregnant females at E12.5, spaced every 2hr for a total maximum of 10h and fixed 30 min after injection for each pulse. For cell cycle exit calculation, a single intraperitoneal BrdU injection was administrated at E12.5, embryos were fixed 24hr later and the percentage of BrdU+ cells labeled with Ki67 was calculated. For birthdating analysis, a single dose of BrdU was injected in timed-pregnant mice at E10.5, E11.5, E12.5 or E13.5, and the brains of labeled animals were analyzed at postnatal stage (P) P0 or P21. For BrdU dilution experiments, pregnant mice were injected at E12.5 with a single pulse of BrdU, 3hr later embryos were electroporated in the OB or the adjacent NCx with CAG-GFP plasmids, and analyzed at E18.5 or P21.
Constructs
For retroviral delivery we used GFP-encoding and RFP-encoding constructs subcloned into an MMLV retroviral packaging vector downstream of the CAG promoter (generous gift of F.H. Gage). For Dll1 overexpression we used a pCIG-Dll1 plasmid (generous gift of J. Galcerán). pCAG-Floxp-EGFP-farnesylated and pCAG-Cre, generous gift of M. Gotz (Pilz et al., 2013), were used for time-lapse imaging of single progenitor lineages. Plasmids encoding dominant-negative Robo1 and Robo2 (dn-Robo1, dn-Robo2) and constitutively active Robo1 and Robo2 (myrRobo1, myrRobo2) cloned in a pCAG vector were as described in (Borrell et al., 2012). Dn-Robo1 and dn-Robo2 were a generous gift of E. Stein (Stein and Tessier-Lavigne, 2001). Jag1 and Jag2 ISH probes were a generous gift of F. Guillermot and the plasmid encoding constitutively acting form of Jag1-HA pIRES was acquired from Addgene. Crispr plasmids were generated using pSpCas9(BB)-2A-GFP (PX458) from Addgene, following Zhang Lab’s protocol. Guides against Dll1 were generated by annealing the following oligomers:
Crispr-mouse Dll1-1: CACCGTAACCGCGGGTGCACGCCGG
Crispr-mouse Dll1-2: AAACCCGGCGTGCACCCGCGGTTAC
Crispr-human Dll1-1: CACCATATAAAGAACCGCGGCCTT
Crispr-human Dll1-2: AAACAAGGCCGCGGTTCTTTATATC
For in situ hybridization (ISH) probe synthesis, the following plasmids were used: mouse Robo1, Robo2, Dll1, Notch1, Hes5, Slit1, Slit2, Slit3 (Borrell et al., 2012), reelin (Borrell and Marín, 2006), Grm1, Bhlhe22 (generous gift of A. Fairén) and Tbr2 (generous gift of B. Rico); chicken (Gallus gallus) Robo1, Robo2 (Escalante et al., 2013) and was subcloned into pBS from pUC19ckDll1 (generous gift of J. Galcerán); snake (Lamprophis fuliginosus) ISH probes were cloned by RT-PCR using the following primers:
snRobo1-Fw: TCATCTCATTGATTTTGTTGC
snRobo1-Rv CAAGATATGAAATCCGTGATG
snRobo2-Fw: TGGCACTCCTGGAAACCTAC
snRobo2-Rv CAGTTCATGGATGCTGTTGG
snDll1-Fw: TACCGCTTTGTGTGTGATG
snDll1-Rv GCACCAAATTGTAATCCACTG
Validation of Crispr/Cas-mediated gene editing
The cerebral cortex of ICR mouse embryos aged E12.5 was electroporated in utero with plasmids encoding the mDll1-specific guide and Cas9; for human-specific guides, d40 cerebral organoids were electroporated with plasmids encoding hDll1 guide and Cas9. Editing of the Dll1 genomic locus was analyzed 24-48hr later using the Surveyor Nuclease (Integrated DNA technologies) digestion protocol, following the manufacturer’s instructions (mouse), or by sequencing (human). Briefly, the genomic DNA of electroporated tissue or transfected cells was isolated and PCR amplified with Xpert High Fidelity DNA polymerase (Mirage Biochemicals) and the following primers: Mouse: Fw: GATATAGCCCCGATGAATGC; Rv: AGAGAGCCCAGATGTTCAGC, which produced 1,025 bp amplicons. Human: Fw: TGGGAGGAAGGAGGAAAACG, Rv: AGCAGCCCCTTCTTGTTGAC, which produced 689 bp amplicons. PCR products were either cloned and sequenced (human), or digested with Surveyor Nuclease S at 42°C for 35min and digestion products analyzed by 2% agarose gel electrophoresis (mouse).
Embryonic brain electroporation
Mouse embryos were electroporated in utero in the NCx at E12.5, or in the OB at E12.0. Briefly, pregnant females were deeply anesthetized with isoflurane and the uterine horns exposed; DNA solution (1μl) was injected into the lateral ventricle using pulled glass micropipettes, and square electric pulses (28-35V, 50ms on – 950ms off, 5 pulses) were applied with an electric stimulator (Cuy21EDIT Bex C., LTD) using round electrodes (CUY650P5, Nepa Gene).
For chicken and snake in ovo electroporations, fertilized eggs were incubated as mentioned above until 4 dpo. The day before electroporation, a small portion of yolk was removed through a needle hole with a syringe. Previously to the electroporation, a small window was open in the egg shell to allow further manipulations. At 4 dpo, DNA solution was injected in the lateral telencephalic ventricle of embryos, and square pulses (30V, 5ms, 5 pulses each 500ms) were applied with an electric stimulator (TSS20 Ovodyne Electroporator, MCI) using round electrodes (CUY650P3, Nepa Gene). Manipulated embryos were allowed to continue developing under the same temperature (38.5°C for chicken and 28°C for snake) and in humidity conditions for snake. Embryos were fixed in ice-cold 4% PFA, and their brains processed for IHC or ISH.
Plasmid concentrations were as follows: GFP = 0.75μg/μl; myr-Robo1, myr-Robo2, dnRobo1, dn-Robo2, Dll1, crDll1, Jag1 = 1μg/μl. Combinations of these plasmids were done maintaining the same final individual concentrations.
Retinal electroporation
For retinal electroporation, C57 WT embryos were electroporated in utero at E13.5 with a combination of plasmids including GFP = 0.75μg/μl; dnRobo1, dn-Robo2 = 1μg/μl. DNA solution (0.5μl) was injected subretinally using pulled glass micropipettes, and square electric pulses (35V, 50ms on – 950ms off, 5 pulses) were applied with an electric stimulator (Cuy21EDIT Bex C., LTD) using round electrodes (CUY650P3, Nepa Gene).
Imaging experiments
For live imaging of individual mouse progenitor cells, embryos were electroporated in utero at E12.0 with a combination of plasmids including pCAG-Flox-farnesylated-EGFP (0,4μg/μl) and pCAG-Cre (10ng/μl). The low concentration of Cre plasmid allowed sparse labeling of individual progenitor cells upon recombination of the floxed stop cassette (Pilz et al., 2013). 12hr after electroporation, the brains were dissected out and vibratome sliced at 250 μm in ice-cold DMEM-F12 (Sigma) bubbled with carbogen (5% carbon dioxide + 95% oxygen). Slices were embedded in collagen matrix (Nitta gelatin) on a filter membrane (Millipore) and cultured in DMEM-F12 (Sigma), 5% fetal bovine serum, 5% horse serum, N2 (1:100; Invitrogen), B27 (1:50; Invitrogen), PenStrep (100U/ml), glucose (0,7g/l) and sodium bicarbonate (0,3g/l) (Pilz et al., 2013). Imaging was performed on an inverted microscope under two-photon optics (LEICA SP2), 40x immersion and a 5% CO2/37°C atmosphere (Martínez-Martínez et al., 2016). Stacks of frames separated 5 μm were captured every 30 min for 12-24 hr. Immediately after recording the time-point, slices were fixed in 2% PFA for 30 min, and then further processed for IHC.
Retroviral stocks preparation and concentration
High-title Murine Moloney Leukemia Virus-based (MMLV-based) retrovirus encoding GFP or RFP under the CAG promoter were prepared by transient transfection (together with CMV-vsvg and CMV-gp plasmids) of human embryonic kidney 293T (HEK293) cells as a package cell line, concentrated by ultracentrifugation and viral title estimated by clonal infection (Borrell et al., 2012). Viral solutions were injected using pulled glass micropipettes.
Single progenitor clonal analysis
ICR control and Robo1/2+/− pregnant females carrying E12.0 embryos were deeply anesthetized with isoflurane and individual embryos were injected with 1μl of Gfp-encoding retroviruses (5x10⁶cfu/ml) into the telencephalic ventricles. After 24hr of survival embryos were sacrificed, their heads fixed in 4% PFA, cryostat-sectioned at 40μm and processed for immunohistochemistry as described above.
For chicken clonal analysis, Rfp-encoding retroviruses were injected immediately after electroporation of Gfp or dnR1/2+Dll1+Gfp encoding plasmids in the same telencephalic ventricle. Manipulations were performed as described previously at 4 dpo and chicken embryos were incubated until 14 dpo.
Tissue microdissection and quantitative real-time PCR
For RNA extraction E12.5 mouse brains were dissected in cold RNase free medium and tissue blocks were vibratome cut at 250μm. Living cortical slices were further microdissected with microscalpels in ice-cold RNase free medium to isolate pieces from OB and the adjacent NCx. Tissue pieces were immediately frozen in liquid nitrogen for RNA extraction. Total RNA from each region was extracted using RNeasy Mini Kit (Quiagen) followed by treatment with RNase-Free DNase Set (Quiagen). Template cDNA was generated using Maxima First Strand cDNA Synthesis Kit for quantitative real-time PCR (qRT–PCR; Thermo Fisher). Primers used were:
msRobo1-Fw: CCTTCAGACCTGATCGTCTCC
msRobo1-Rv: TGAGCGCGGGTCATCTTTG
msRobo2-Fw: CTTTGAACGACCCACATTTCTCA
msRobo2-Rv: TCTCAGCGTGTAGTCATCTTTGA
ms18S-Fw: CGGCTACCACATCCAAGGAA
ms18S-Fw: GCTGGAATTACCGCGGCT
For comparison between species RNA was extracted from 6dpo chicken brains, dissected in cold RNase free medium and tissue blocks were vibratome cut at 250μm. Primers used in the mouse and chicken comparison are listed below:
ckROBO1-Fw AGAAGATTTCCCACCTCG
ckROBO1-Rv CTTGCCACGCAGACATAG
ckGAPDH –Fw GTGGTGCTAAGCGTGTTATCATC
ckGAPDH –Rv GGCAGCACCTCTGCCATC
msGAPDH_Fw CTCTTGCTCAGTGTCCTTGCTG
msGAPDH_Rv ATGAATACGGCTACAGCAACAGG
Reprogramming of human fibroblasts to induced pluripotent stem cells
IPSCs were reprogrammed from human newborn foreskin fibroblasts (CRL-2522, ATCC). 2.5x10⁵ NuFF3-RQ IRR human newborn foreskin feeder fibroblasts (GSC-3404, GlobalStem) were seeded per well of a 6-well tissue culture dish with advanced MEM (12491015, Thermo Fisher Scientific) supplemented with 5% HyClone Fetal Bovine Serum, 1% MEM NEAA and GlutaMAX (11140050; 35050061 Thermo Fisher Scientific). On day 1, 70%–80% confluent CRL-2522 fibroblasts were dissociated using 0.25% Trypsin-EDTA (25200056, Life Technologies), counted and seeded on the NuFF3-RQ cells at two different densities: 2x10⁴ cells/well and 4x10⁴ cells/well. On day 2, the medium was changed to Pluriton Reprogramming Medium supplemented with 500ng/ml carrier-free B18R Recombinant Protein. On days 3-18, a cocktail of modified mRNAs (mmRNAs) containing OCT4, SOX2, LIN28, C-MYC, and KLF mmRNAs at a 3:1:1:1:1 stoichiometric ratio was transfected daily. For that purpose, the mmRNAs were mixed in a total volume of 105μl and were combined with a mix of 92μl Opti-MEM I Reduced Serum Medium and 13μl Lipofectamine RNAiMAX Transfection Reagent after separate incubation at RT for 15 min. Cells were transfected for 4hrs, washed and fresh reprogramming medium supplemented with B18R was added to the cultures. The mmRNAs with the following modifications: 5-Methyl CTP, a 150nt poly-A tail, ARCA cap and Pseudo-UTP were obtained from the RNA CORE unit of the Houston Methodist Hospital. 5 days after the first transfection, the first morphological changes were noticed, while the first induced pluripotent stem cell (iPSC) colonies appeared by day 12-15. On day 16, the medium was changed to STEMPRO hESC SFM for five days. Harvesting of the iPSC colonies was performed after 40min incubation at 37°C with 2mg/ml Collagenase Type IV solution in DMEM/F12 (31331093, Thermo Fisher Scientific). The iPSCs were plated on γ-irradiated mouse embryonic fibroblasts (MEFs) and grown in STEMPRO hESC SFM for 10 additional passages. After that the iPSCs were further cultured in a feeder-free culture system, using mTeSR1 on plates coated with LDEV-Free Geltrex. iPSCs were authenticated after reprogramming by karyotyping.
iPSC culture
IPSCs were cultured at 37°C, 5% CO2 and ambient oxygen level on Geltrex coated plates in mTeSR1 medium (STEMCELL Technologies, 05850) with daily medium change. For passaging, iPSC colonies were incubated with StemPro Accutase Cell Dissociation Reagent diluted 1:4 in PBS for 4 min. Pieces of colonies were washed off with DMEM/F12, centrifuged for 5min at 300 x g and resuspended in mTeSR1 supplemented with 10μM Rock inhibitor Y-27632(2HCl) for the first day.
Cerebral organoids generation
Cerebral organoids generation. Cerebral organoids were generated as previously described (Lancaster and Knoblich, 2014). Briefly, iPSCs were dissociated in to single cells using StemPro Accutase Cell Dissociation Reagent (A1110501, Life Technologies) and plated in the concentration of 9000 single iPSCs/well into low attachment 96-well tissue culture plates in hES medium (DMEM/F12GlutaMAX supplemented with 20% Knockout Serum Replacement, 3% ES grade FBS, 1% Non-essential amino acids, 0.1mM 2-mercaptoethanol, 4ng/ml bFGF and 50μM Rock inhibitor Y27632) for 6 days in order to form embryoid bodies (EBs). Rock inhibitor Y27632 and bFGF were removed on the 4th day. On day 6 EBs were transferred into low attachment 24-well plates in NIM medium (DMEM/F12GlutaMAX supplemented with 1:100 N2 supplement, 1% Non-essential amino acids and 5μg/ml Heparin) and cultured for additional 6 days. On day 12 EBs were embedded in Matrigel drops and then they were transfer in 10cm tissue culture plates in NDM minus A medium (DMEM/F12GlutaMAX and Neurobasal in ratio 1:1 supplemented with 1:100 N2 supplement 1:100 B27 without Vitamin A, 0.5% Non-essential amino acids, insulin 2.5μg/ml, 1:100 Antibiotic-Antimycotic and 50μM 2-mercaptoethanol) in order to form organoids. 4 days after Matrigel embedding cerebral organoids were transfer into an orbital shaker and cultured until electroporation in NDM plus A medium (DMEM/F12GlutaMAX and Neurobasal in ratio 1:1 supplemented with 1:100 N2 supplement 1:100 B27 with Vitamin A, 0.5% Non-essential amino acids, insulin 2.5μg/ml, 1:100 Antibiotic-Antimycotic and 50μM 2-mercaptoethanol). During the whole period of cerebral organoid generation, cells were kept at 37°C, 5% CO2 and ambient oxygen level with medium changes every other day. After transferring the cerebral organoids onto the shaker medium was changed twice per week.
Electroporation of cerebral organoids
Cerebral organoids were kept in antibiotics-free conditions prior to electroporation. Electroporations were performed in cerebral organoids at 39 days stages after the initial plating of the cells and fixed 7 days post electroporation. During the electroporation cerebral organoids were placed in an electroporation chamber (Harvard Apparatus, Holliston, MA, USA) under a stereoscope and using a glass microcapillary 1-2 μL of plasmid DNAs was injected together with Fast Green (0.1%, Sigma) into different ventricles of the organoids. The plasmid DNAs injected were a mix of 0.75 mg/ml GFP with or without 1mg/ml myr-Robo1, 1mg/ml myr-Robo2, 1mg/ml Dll1 gRNA (+Cas9). Cerebral organoids were subsequently electroporated with 5 pulses applied at 80V for 50ms each at intervals of 500ms (ECM830, Harvard Apparatus). Following electroporation, cerebral organoids were kept for additional 24hr in antibiotics-free media, and then changed into the normal media until fixation. Cerebral organoids were fixed using 4% PFA for 1hr at 4°C, cryopreserved with 30% sucrose and stored at −20°C. For immunofluorescence, 16 μm cryosections were prepared.
Retinal growth cones collapse assay
24hr after the electroporation, retinas were isolated and maintained in sterile DMEM/F12 culture medium. Electroporated retinas were selected and cut in small (200μm) pieces and explants plated on Corning BioCoat Poly-L-lisine coverslips after 1h of laminin (20μg/μl) treatment. Retinal explants were cultured during 24 hr in culture medium [DMEM/F12 supplemented with 0.4% Methylcellulose (Sigma), 1% BSA (Sigma), 1% Insulin-transferrin-sodium selenite media supplement (Sigma) and 0.2% penicillin/streptomycin] in a humidified incubator at 37°C and 5% CO2. After 24h of incubation, recombinant mouse Slit protein (R&D Systems) was added to the medium (250ng/μl) and the explants were fixed 1h later with PFA 2% during 15 min.
MyrRobo1/2 construct validation
To express EGFP and myrR1/2cyto, 4x10⁵ dissociated DRG neurons from E14 rat embryos were electroporated with 2-3 μg of plasmid DNA using the nucleofection reagent for rat DRG neurons (Lonza). Cells were then incubated in 400 mL of growth medium at 37°C for 10 min, spun down, plated at 5x10⁴/20 μl in collagen gels, and cultured in an F12 medium (Invitrogen) with the N3 supplement, 40 mM glucose, 0.5% fetal calf serum, plus NGF (25 ng/ml, 7 s, Sigma). After two-day in culture, neurons were fixed with 4% PFA, pH 7.4, for 1 h, and permeabilized, and blocked with PBS containing 0.1% Triton X-100 and 1% Goat Serum. The transfected cells were stained with a mouse anti-myc primary antibody (9E10, Santa Cruz) followed by a Cy3-conjugated secondary antibody (Jackson ImmunoResearch) to detect the myc tagged myrR1/2cyto. EGFP was imaged directly.
Neuron tracing experiments
Cholera toxin subunit B conjugated with Alexa 594 (CTB, Molecular probes) was prepared at 1μg/μl in PBS. CTB solution was injected in the pyramidal decussation of P15 juvenile ICR WT mice. Mice were deeply anesthetized with isoflurane, the pyramidal decussation was exposed and CTB solution (2μl) was stereotaxically injected into the tissue with pulled glass pipettes. Animals were fixed at P21 with 4% PFA and processed as previously described.
Quantification and Statistical Analysis
Data were statistically analyzed using SPSS software. Pairwise t test or independent samples t test were used to compare statistical differences between two experimental groups. χ2-test was used to determine the equality of proportion between different groups. To compare the statistical differences between at least three experimental groups, One way-ANOVA was used. Similarity of variance across experimental distributions was tested. Samples were obtained independently and observations were sampled randomly and independently. All values represent mean ± standard error of the mean (SEM). The experimental n, the statistical test used and the statistical significance are indicated in figure legends. For each experiment, embryos from at least two different females were used. Significance was set at p = 0.05. More information about experimental analysis and quantifications can be found below.
Histological analysis
For inmunohistological comparisons between OB and adjacent NCx, cells were counted in an equivalent ventricular surface separated by a transitional gap of 200μm. For each section, the total cell count was normalized per length of VZ apical surface. All quantifications were made in the same latero-medial level in at least 3 independent embryos. For co-localization studies, images from a single confocal plane were obtained and analyzed using a Leica TCS SL confocal microscope and Olympus FV10 confocal microscope.
For validation of crDll1 by ICC, and for ISH analyses, images were inverted, processed to 8 bits, and the mean signal intensity in the area of interest was measured using ImageJ sofware (n = 3-5 independent samples for each group). See Figures 5 and 6 and S6.
Bromodeoxyuridine labeling experiments
To determine cell cycle length, DAPI+ BrdU+ nuclei in the VZ and SVZ were quantified. Nuclei were considered as positive for BrdU only when at least 25% of the nucleus was labeled. To study G2+M length, we quantified phospho-histone3 and BrdU positive cells. n = 3 embryos per time point. See Figures 1 and 3 and S3. To analyze cell cycle exit, BrdU positive Ki67 negative nuclei were counted in the VZ and SVZ. n = 3 embryos per area and genotype. See Figures 1 and 3. For mitral cell birthdating analysis, Tbr1-BrdU positive cells were quantified differentiating between 25%, 50% and 100% of total nucleus label. n = 3 embryos per developmental stage. See Figure S1. For cortical neuron birthdating analysis, GFP+ 100% BrdU+ cells were quantified in each layer (n = 3 Gfp electroporated controls; n = 5 MyrRobo+crDll1 electroporated embryos). See Figures 5 and S7.
Electroporation analysis
In mouse, chicken, and snake embryo experiments, to minimize the variability between animals, counts in the electroporated hemisphere of each animal were normalized with the non-electroporated contralateral hemisphere of the same animal at the same rostro-caudal and latero-medial level. All quantifications were made in at least 3 independent embryos. Cerebral organoid electroporations were normalized using a non-electroporated adjacent region. Several independent ventricles per organoid and condition were analyzed from 4-6 different organoids.
Imaging experiments
Digital images were acquired, contrast-enhanced and analyzed with Imaris software (Bitplane). Each individual apical mitosis was followed until the end of the movie to determine cell types derived from it, to then define the cell lineage tree (n = 25 divisions from 25 clones in the OB of 5 embryos; n = 44 divisions from 39 clones in NCx of 3 embryos). See Figures 2 and S3.
Single progenitor clonal analysis
For the unequivocal assignment of GFP+ cells as belonging to a particular individual clone, the three-dimensional arrangement of labeled cells within the embryonic tissue was assessed by scanning the entire thickness of brain sections under confocal microscopy. In mouse clonal analysis, once all cells within a single clone were identified, they were counted and classified according to their expression of Tuj1, Tbr1, Tbr2 and morphology, namely being multipolar or containing an apical process extended to the ventricular surface. Quantifications were performed in 7 embryos per group (WT: n = 116 clones in NCx; 47 clones in OB - KO: n = 125 clones in NCx; 40 clones in OB). See Figures 2 and 3.
For chicken clonal analysis, 3-7 embryos were used per condition (n = 52 clones, 128 cells Gfp; 59 clones, 254 cells dnR1/2+Dll1+Gfp). Only cells labeled with GFP (derived from electroporated, dorsal pallial progenitors), RFP (derived from individual progenitors) and contained within the neuronal layer, as defined by Tuj1 stain, were considered. The majority of these cells were as either singles or forming small clusters, and very sparsely distributed along the cortex (1-2 cells or cell clusters per section of whole cerebral hemisphere, 5000μm long). The diameter of these cell clusters, defined as the maximum separation between their constituent cells, was 65-80 microns on average (63 ± 5μm in Gfp clones; 79 ± 3μm in dnR1/2+Dll1+Gfp clones). Cells were considered to be clonally related only if they were separated from the nearest neighbor cell less than the average cluster diameter, and from clones at least 150μm. In most cases, the separation between clusters or isolated cells was much greater. Pairs of cell clusters that, although distinctly separate, were found at a closer distance, were not included in the analysis.
Quantitative real-time PCR
Quantitative RT-PCR was performed using the Step One Plus sequence detection system and the SYBR Green method (Applied Biosystems) with each point examined in triplicate. Transcript levels were calculated using the comparative Ct method normalized using 18S. Each independent sample was processed in triplicate.
Robo construct validation
Growth cone collapse was measured as the degree of filopodia retraction in electroporated cells. Quantifications were performed in 3 embryos per group (n = 58 growth cones in Gfp; 52 growth cones in Gfp+Slit; 44 growth cones in dnRobo1/2; 48 growth cones in dnRobo1/2+Slit). Axon branching experiment was used to validate the MyrRobo constructs by measuring the branching degree in growing axons from single neurons of embryonic rat dorsal root ganglion (n = 5-10 neurons per group).
Acknowledgments
We thank E. Llorens, S. Amin, and G. Exposito for excellent technical and imaging assistance, J. Galcerán, E. Herrera, B. Rico, A. Fairén, O. Marín, and E. Stein for plasmids, O. Marín for GAD67-GFP mice, and M. Götz and E. Herrera for tips on videomicroscopy and collapse assays. We thank A. Nieto, M. Domínguez, D. Lyon, A. Bigas, I. Fariñas, and M. Milinkovitch for insightful discussions and critical reading of manuscript. A.C. was the recipient of an FPI fellowship from the Spanish Ministry of Economy, Industry, and Competitiveness (MINEICO) (BES-2010-030842), and C.d.J.R. was the recipient of an Eduardo Gallego Fellowship from Fundación Francisco Cobos. Work was supported by grants to A.C.T. from the Swiss National Science Foundation (FNSNF, grants 31003A_140785 and SINERGIA CRSII3_132430) and a SystemsX.ch initiative (project EpiPhysX); to L.M. from NIH (NIH-NS062047); and to V.B. from MINEICO (BFU2012-03763, SAF2015-69168-R) and the European Research Council (309633). V.B. acknowledges financial support from the Spanish State Research Agency through the “Severo Ochoa” Programme for Centers of Excellence in R&D (ref. SEV-2013-0317).
Author Contributions
Conceptualization, A.C. and V.B.; Methodology, A.C.; Investigation, A.C., A.V., C.d.J.R., E.P., C.K., A.C.T., L.M., and M.D.; Resources, M.T.-L., L.M., S.C., and V.B.; Writing – Original Draft, V.B.; Writing – Review & Editing, V.B.; Visualization, V.B.; Supervision, V.B.; Funding Acquisition, C.d.J.R., A.C.T., L.M., and V.B.
Declaration of Interests
The authors declare no competing interests.
Published: June 28, 2018
Footnotes
Supplemental Information includes seven figures, one table, and five videos and can be found with this article online at https://doi.org/10.1016/j.cell.2018.06.007.
Supplemental Information
References
- Arai Y., Pulvers J.N., Haffner C., Schilling B., Nüsslein I., Calegari F., Huttner W.B. Neural stem and progenitor cells shorten S-phase on commitment to neuron production. Nat. Commun. 2011;2:154. doi: 10.1038/ncomms1155. [DOI] [PMC free article] [PubMed] [Google Scholar]
- Attardo A., Calegari F., Haubensak W., Wilsch-Bräuninger M., Huttner W.B. Live imaging at the onset of cortical neurogenesis reveals differential appearance of the neuronal phenotype in apical versus basal progenitor progeny. PLoS ONE. 2008;3:e2388. doi: 10.1371/journal.pone.0002388. [DOI] [PMC free article] [PubMed] [Google Scholar]
- Bai G., Chivatakarn O., Bonanomi D., Lettieri K., Franco L., Xia C., Stein E., Ma L., Lewcock J.W., Pfaff S.L. Presenilin-dependent receptor processing is required for axon guidance. Cell. 2011;144:106–118. doi: 10.1016/j.cell.2010.11.053. [DOI] [PMC free article] [PubMed] [Google Scholar]
- Blanchart A., Martín-López E., De Carlos J.A., López-Mascaraque L. Peripheral contributions to olfactory bulb cell populations (migrations towards the olfactory bulb) Glia. 2011;59:278–292. doi: 10.1002/glia.21100. [DOI] [PubMed] [Google Scholar]
- Borrell V., Marín O. Meninges control tangential migration of hem-derived Cajal-Retzius cells via CXCL12/CXCR4 signaling. Nat. Neurosci. 2006;9:1284–1293. doi: 10.1038/nn1764. [DOI] [PubMed] [Google Scholar]
- Borrell V., Cárdenas A., Ciceri G., Galcerán J., Flames N., Pla R., Nóbrega-Pereira S., García-Frigola C., Peregrín S., Zhao Z. Slit/Robo signaling modulates the proliferation of central nervous system progenitors. Neuron. 2012;76:338–352. doi: 10.1016/j.neuron.2012.08.003. [DOI] [PMC free article] [PubMed] [Google Scholar]
- Brose K., Bland K.S., Wang K.H., Arnott D., Henzel W., Goodman C.S., Tessier-Lavigne M., Kidd T. Slit proteins bind Robo receptors and have an evolutionarily conserved role in repulsive axon guidance. Cell. 1999;96:795–806. doi: 10.1016/s0092-8674(00)80590-5. [DOI] [PubMed] [Google Scholar]
- Cheung A.F., Pollen A.A., Tavare A., DeProto J., Molnár Z. Comparative aspects of cortical neurogenesis in vertebrates. J. Anat. 2007;211:164–176. doi: 10.1111/j.1469-7580.2007.00769.x. [DOI] [PMC free article] [PubMed] [Google Scholar]
- Cheung A.F., Kondo S., Abdel-Mannan O., Chodroff R.A., Sirey T.M., Bluy L.E., Webber N., DeProto J., Karlen S.J., Krubitzer L. The subventricular zone is the developmental milestone of a 6-layered neocortex: comparisons in metatherian and eutherian mammals. Cereb. Cortex. 2010;20:1071–1081. doi: 10.1093/cercor/bhp168. [DOI] [PubMed] [Google Scholar]
- Das R.M., Storey K.G. Apical abscission alters cell polarity and dismantles the primary cilium during neurogenesis. Science. 2014;343:200–204. doi: 10.1126/science.1247521. [DOI] [PMC free article] [PubMed] [Google Scholar]
- De Juan Romero C., Borrell V. Coevolution of radial glial cells and the cerebral cortex. Glia. 2015;63:1303–1319. doi: 10.1002/glia.22827. [DOI] [PMC free article] [PubMed] [Google Scholar]
- Dugas-Ford J., Ragsdale C.W. Levels of homology and the problem of neocortex. Annu. Rev. Neurosci. 2015;38:351–368. doi: 10.1146/annurev-neuro-071714-033911. [DOI] [PubMed] [Google Scholar]
- Englund C., Fink A., Lau C., Pham D., Daza R.A., Bulfone A., Kowalczyk T., Hevner R.F. Pax6, Tbr2, and Tbr1 are expressed sequentially by radial glia, intermediate progenitor cells, and postmitotic neurons in developing neocortex. J. Neurosci. 2005;25:247–251. doi: 10.1523/JNEUROSCI.2899-04.2005. [DOI] [PMC free article] [PubMed] [Google Scholar]
- Escalante A., Murillo B., Morenilla-Palao C., Klar A., Herrera E. Zic2-dependent axon midline avoidance controls the formation of major ipsilateral tracts in the CNS. Neuron. 2013;80:1392–1406. doi: 10.1016/j.neuron.2013.10.007. [DOI] [PubMed] [Google Scholar]
- Finlay B.L., Darlington R.B. Linked regularities in the development and evolution of mammalian brains. Science. 1995;268:1578–1584. doi: 10.1126/science.7777856. [DOI] [PubMed] [Google Scholar]
- Fish J.L., Dehay C., Kennedy H., Huttner W.B. Making bigger brains-the evolution of neural-progenitor-cell division. J. Cell Sci. 2008;121:2783–2793. doi: 10.1242/jcs.023465. [DOI] [PubMed] [Google Scholar]
- Florio M., Albert M., Taverna E., Namba T., Brandl H., Lewitus E., Haffner C., Sykes A., Wong F.K., Peters J. Human-specific gene ARHGAP11B promotes basal progenitor amplification and neocortex expansion. Science. 2015;347:1465–1470. doi: 10.1126/science.aaa1975. [DOI] [PubMed] [Google Scholar]
- Florio M., Borrell V., Huttner W.B. Human-specific genomic signatures of neocortical expansion. Curr. Opin. Neurobiol. 2017;42:33–44. doi: 10.1016/j.conb.2016.11.004. [DOI] [PubMed] [Google Scholar]
- Gong Q., Shipley M.T. Evidence that pioneer olfactory axons regulate telencephalon cell cycle kinetics to induce the formation of the olfactory bulb. Neuron. 1995;14:91–101. doi: 10.1016/0896-6273(95)90243-0. [DOI] [PubMed] [Google Scholar]
- Hansen D.V., Lui J.H., Parker P.R., Kriegstein A.R. Neurogenic radial glia in the outer subventricular zone of human neocortex. Nature. 2010;464:554–561. doi: 10.1038/nature08845. [DOI] [PubMed] [Google Scholar]
- Haubensak W., Attardo A., Denk W., Huttner W.B. Neurons arise in the basal neuroepithelium of the early mammalian telencephalon: a major site of neurogenesis. Proc. Natl. Acad. Sci. USA. 2004;101:3196–3201. doi: 10.1073/pnas.0308600100. [DOI] [PMC free article] [PubMed] [Google Scholar]
- Ishibashi M., Ang S.L., Shiota K., Nakanishi S., Kageyama R., Guillemot F. Targeted disruption of mammalian hairy and Enhancer of split homolog-1 (HES-1) leads to up-regulation of neural helix-loop-helix factors, premature neurogenesis, and severe neural tube defects. Genes Dev. 1995;9:3136–3148. doi: 10.1101/gad.9.24.3136. [DOI] [PubMed] [Google Scholar]
- Kangsamaksin T., Murtomaki A., Kofler N.M., Cuervo H., Chaudhri R.A., Tattersall I.W., Rosenstiel P.E., Shawber C.J., Kitajewski J. NOTCH decoys that selectively block DLL/NOTCH or JAG/NOTCH disrupt angiogenesis by unique mechanisms to inhibit tumor growth. Cancer Discov. 2015;5:182–197. doi: 10.1158/2159-8290.CD-14-0650. [DOI] [PMC free article] [PubMed] [Google Scholar]
- Kawaguchi D., Yoshimatsu T., Hozumi K., Gotoh Y. Selection of differentiating cells by different levels of delta-like 1 among neural precursor cells in the developing mouse telencephalon. Development. 2008;135:3849–3858. doi: 10.1242/dev.024570. [DOI] [PubMed] [Google Scholar]
- Koutelou E., Sato S., Tomomori-Sato C., Florens L., Swanson S.K., Washburn M.P., Kokkinaki M., Conaway R.C., Conaway J.W., Moschonas N.K. Neuralized-like 1 (Neurl1) targeted to the plasma membrane by N-myristoylation regulates the Notch ligand Jagged1. J. Biol. Chem. 2008;283:3846–3853. doi: 10.1074/jbc.M706974200. [DOI] [PubMed] [Google Scholar]
- Kowalczyk T., Pontious A., Englund C., Daza R.A., Bedogni F., Hodge R., Attardo A., Bell C., Huttner W.B., Hevner R.F. Intermediate neuronal progenitors (basal progenitors) produce pyramidal-projection neurons for all layers of cerebral cortex. Cereb. Cortex. 2009;19:2439–2450. doi: 10.1093/cercor/bhn260. [DOI] [PMC free article] [PubMed] [Google Scholar]
- Kriegstein A., Noctor S., Martínez-Cerdeño V. Patterns of neural stem and progenitor cell division may underlie evolutionary cortical expansion. Nat. Rev. Neurosci. 2006;7:883–890. doi: 10.1038/nrn2008. [DOI] [PubMed] [Google Scholar]
- Lancaster M.A., Knoblich J.A. Generation of cerebral organoids from human pluripotent stem cells. Nat. Protoc. 2014;9:2329–2340. doi: 10.1038/nprot.2014.158. [DOI] [PMC free article] [PubMed] [Google Scholar]
- López-Bendito G., Sturgess K., Erdelyi F., Szabo G., Molnar Z., Paulsen O. Preferential origin and layer destination of GAD65-GFP cortical interneurons. Cereb. Cortex. 2004;14:1122–1133. doi: 10.1093/cercor/bhh072. [DOI] [PubMed] [Google Scholar]
- Malatesta P., Hartfuss E., Götz M. Isolation of radial glial cells by fluorescent-activated cell sorting reveals a neuronal lineage. Development. 2000;127:5253–5263. doi: 10.1242/dev.127.24.5253. [DOI] [PubMed] [Google Scholar]
- Marillat V., Cases O., Nguyen-Ba-Charvet K.T., Tessier-Lavigne M., Sotelo C., Chédotal A. Spatiotemporal expression patterns of slit and robo genes in the rat brain. J. Comp. Neurol. 2002;442:130–155. doi: 10.1002/cne.10068. [DOI] [PubMed] [Google Scholar]
- Martínez-Martínez M.A., De Juan Romero C., Fernández V., Cárdenas A., Götz M., Borrell V. A restricted period for formation of outer subventricular zone defined by Cdh1 and Trnp1 levels. Nat. Commun. 2016;7:11812. doi: 10.1038/ncomms11812. [DOI] [PMC free article] [PubMed] [Google Scholar]
- Miyata T., Kawaguchi A., Saito K., Kawano M., Muto T., Ogawa M. Asymmetric production of surface-dividing and non-surface-dividing cortical progenitor cells. Development. 2004;131:3133–3145. doi: 10.1242/dev.01173. [DOI] [PubMed] [Google Scholar]
- Nandagopal N., Santat L.A., LeBon L., Sprinzak D., Bronner M.E., Elowitz M.B. Dynamic Ligand Discrimination in the Notch Signaling Pathway. Cell. 2018;172:869–880 e819. doi: 10.1016/j.cell.2018.01.002. [DOI] [PMC free article] [PubMed] [Google Scholar]
- Nelson B.R., Hodge R.D., Bedogni F., Hevner R.F. Dynamic interactions between intermediate neurogenic progenitors and radial glia in embryonic mouse neocortex: potential role in Dll1-Notch signaling. J. Neurosci. 2013;33:9122–9139. doi: 10.1523/JNEUROSCI.0791-13.2013. [DOI] [PMC free article] [PubMed] [Google Scholar]
- Nguyen-Ba-Charvet K.T., Di Meglio T., Fouquet C., Chédotal A. Robos and slits control the pathfinding and targeting of mouse olfactory sensory axons. J. Neurosci. 2008;28:4244–4249. doi: 10.1523/JNEUROSCI.5671-07.2008. [DOI] [PMC free article] [PubMed] [Google Scholar]
- Noctor S.C., Flint A.C., Weissman T.A., Dammerman R.S., Kriegstein A.R. Neurons derived from radial glial cells establish radial units in neocortex. Nature. 2001;409:714–720. doi: 10.1038/35055553. [DOI] [PubMed] [Google Scholar]
- Noctor S.C., Martínez-Cerdeño V., Ivic L., Kriegstein A.R. Cortical neurons arise in symmetric and asymmetric division zones and migrate through specific phases. Nat. Neurosci. 2004;7:136–144. doi: 10.1038/nn1172. [DOI] [PubMed] [Google Scholar]
- Nomura T., Ohtaka-Maruyama C., Yamashita W., Wakamatsu Y., Murakami Y., Calegari F., Suzuki K., Gotoh H., Ono K. The evolution of basal progenitors in the developing non-mammalian brain. Development. 2016;143:66–74. doi: 10.1242/dev.127100. [DOI] [PMC free article] [PubMed] [Google Scholar]
- Northcutt R.G. Understanding vertebrate brain evolution. Integr. Comp. Biol. 2002;42:743–756. doi: 10.1093/icb/42.4.743. [DOI] [PubMed] [Google Scholar]
- Pilz G.A., Shitamukai A., Reillo I., Pacary E., Schwausch J., Stahl R., Ninkovic J., Snippert H.J., Clevers H., Godinho L. Amplification of progenitors in the mammalian telencephalon includes a new radial glial cell type. Nat. Commun. 2013;4:2125. doi: 10.1038/ncomms3125. [DOI] [PMC free article] [PubMed] [Google Scholar]
- Puelles L., Kuwana E., Puelles E., Bulfone A., Shimamura K., Keleher J., Smiga S., Rubenstein J.L. Pallial and subpallial derivatives in the embryonic chick and mouse telencephalon, traced by the expression of the genes Dlx-2, Emx-1, Nkx-2.1, Pax-6, and Tbr-1. J. Comp. Neurol. 2000;424:409–438. doi: 10.1002/1096-9861(20000828)424:3<409::aid-cne3>3.0.co;2-7. [DOI] [PubMed] [Google Scholar]
- Ran F.A., Hsu P.D., Wright J., Agarwala V., Scott D.A., Zhang F. Genome engineering using the CRISPR-Cas9 system. Nat. Protoc. 2013;8:2281–2308. doi: 10.1038/nprot.2013.143. [DOI] [PMC free article] [PubMed] [Google Scholar]
- Rowe T.B., Macrini T.E., Luo Z.X. Fossil evidence on origin of the mammalian brain. Science. 2011;332:955–957. doi: 10.1126/science.1203117. [DOI] [PubMed] [Google Scholar]
- Smart I.H., Dehay C., Giroud P., Berland M., Kennedy H. Unique morphological features of the proliferative zones and postmitotic compartments of the neural epithelium giving rise to striate and extrastriate cortex in the monkey. Cereb. Cortex. 2002;12:37–53. doi: 10.1093/cercor/12.1.37. [DOI] [PMC free article] [PubMed] [Google Scholar]
- Stein E., Tessier-Lavigne M. Hierarchical organization of guidance receptors: silencing of netrin attraction by slit through a Robo/DCC receptor complex. Science. 2001;291:1928–1938. doi: 10.1126/science.1058445. [DOI] [PubMed] [Google Scholar]
- Tashiro A., Zhao C., Gage F.H. Retrovirus-mediated single-cell gene knockout technique in adult newborn neurons in vivo. Nat. Protoc. 2006;1:3049–3055. doi: 10.1038/nprot.2006.473. [DOI] [PubMed] [Google Scholar]
- Taverna E., Götz M., Huttner W.B. The cell biology of neurogenesis: toward an understanding of the development and evolution of the neocortex. Annu. Rev. Cell Dev. Biol. 2014;30:465–502. doi: 10.1146/annurev-cellbio-101011-155801. [DOI] [PubMed] [Google Scholar]
- True J.R., Carroll S.B. Gene co-option in physiological and morphological evolution. Annu. Rev. Cell Dev. Biol. 2002;18:53–80. doi: 10.1146/annurev.cellbio.18.020402.140619. [DOI] [PubMed] [Google Scholar]
- Vasistha N.A., García-Moreno F., Arora S., Cheung A.F., Arnold S.J., Robertson E.J., Molnár Z. Cortical and Clonal Contribution of Tbr2 Expressing Progenitors in the Developing Mouse Brain. Cereb. Cortex. 2015;25:3290–3302. doi: 10.1093/cercor/bhu125. [DOI] [PMC free article] [PubMed] [Google Scholar]
Associated Data
This section collects any data citations, data availability statements, or supplementary materials included in this article.
Supplementary Materials
Videomicroscopy of the lineage of a single RGC in an organotypic slice culture from the rostral neocortex near the mouse OB. Apical surface is down. The slice was prepared 20hr after in utero electroporation, and imaging started 4hrs after slice preparation. Total imaging time is 26hrs. Colored arrowheads follow the same RGC and its progeny through the movie. The initial RGC undergoes interkinetic nuclear migration (INM) to divide at the apical surface and produce 2 RGCs; each of those grows a new basal process and undergoes INM again, to divide apically and produce 2 more RGCs, for a total of 4.
Videomicroscopy of the lineage of a single RGC in an organotypic slice culture from the rostral neocortex near the mouse OB. Apical surface is down. Total time elapsed is 26hrs. Colored arrowheads follow the same RGC and its progeny through the movie. The initial RGC undergoes interkinetic nuclear migration (INM) to divide at the apical surface and produce 2 RGCs; each of those grows a new basal process and undergoes INM again, to divide apically and produce 2 more RGCs, for a total of 4.
Videomicroscopy of the lineage of a single RGC in an organotypic slice culture from the rostral neocortex near the mouse OB. Apical surface is down. Total time elapsed is 26hrs. Colored arrowheads follow the same RGC and its progeny through the movie. The initial RGC undergoes interkinetic nuclear migration (INM) to divide apically and produce 1 IPC (green arrowhead) plus 1 RGC (red arrowhead); the RGC undergoes INM again to divide at the apical surface and produce 2 more RGCs (open red arrowheads), whereas the IPC divides terminally at a basal position, without INM, to produce 2 neurons (open green arrowheads).
Videomicroscopy of the lineage of a single RGC in an organotypic slice culture from the mouse OB. Apical surface is down. Total time elapsed is 13hrs. The initial RGC undergoes interkinetic nuclear migration to divide in the apical surface to produce 1 RGC (top cell) plus 1 neuron (bottom cell).
Videomicroscopy of the lineage of a single RGC in an organotypic slice culture from the mouse OB. Apical surface is down. Total time elapsed is 9hrs. Colored arrowheads follow the same RGC and its progeny through the movie. The initial RGC divides at the apical surface to produce 1 RGC (red arrowhead) plus 1 neuron (green arrowhead).