

Abstract
Background
The aim of this study was to investigate the diagnostic value of diffusion-weighted imaging (DWI) in combination with susceptibility-weighted imaging (SWI) for differentiating benign parotid gland lesions from malignant ones.
Material/Methods
This retrospective study was approved by the Ethics Committee of our hospital. A total of 36 patients (26 benign cases and 10 malignant cases) were confirmed by surgical pathology. The apparent diffusion coefficient (ADC), normalized ADC (ADCNormalized), intratumoral susceptibility signals (ITSS), and morphological characteristics were analyzed with SPSS 19.0 software.
Results
The mean ADC values of parotid gland lesions was not different between malignant and benign lesions (P=0.07), while the differences between ADCNormalized (P=0.026) and ITSS grading (P=0.014) were statistically significant. Logistic regression analysis identified use of ADCNormalized and ITSS as the only independent predictor of malignant lesions (odds ratio 0.038; 95% confidence interval 0.001~0.988; P=0.011) and (odds ratio 4.867; 95% confidence interval 1.442~16.423; P=0.049), respectively. The optimum threshold of the ADCNormalized values was –0.45%, ITSS grade was 2, the corresponding areas under the receiver operating characteristic curve (AUC) were 0.750 and 0.787 respectively, and the combination of the 2 was 0.846.
Conclusions
DWI integrated with SWI can significantly improve the diagnostic efficacy in distinguishing benign from malignant parotid lesions.
MeSH Keywords: Diagnosis, Computer-Assisted; Magnetic Resonance Imaging; Parotid Gland
Background
The parotid gland is the largest salivary gland and parotid cancer accounts for 5% of the incidence rate of all head and neck tumors and 80% the salivary gland tumors [1]. The benign tumors account for 80–85% and malignant tumors account for 15–20% [2]. About 25% of untreated parotid pleomorphic adenoma shows malignant degeneration after a long history of disease, especially in multiple pleomorphic adenoma [3], but Warthin’s tumors are rarely malignant, with a rate of less than 1% [3].
To avoid unnecessary surgery in case of benign lesions or considering an enlarged surgery for removal of the entire parotid gland and the surrounding lymph nodes in case of malignant lesions [4–6], it is critical to preoperatively distinguish benign from malignant parotid gland lesions to select the optimal treatment protocol. The features of malignancy of the parotid gland included irregular margin, infiltration into adjacent structures, and surrounding swollen lymph node on conventional MRI [5]. Lesion margins and swollen lymph nodes were not factors correctly differentiating malignant from benign parotid gland lesions, and infiltration into adjacent structures appeared not only in malignant parotid gland lesions, but also in certain benign lesions, such as inflammation and tuberculosis [5–7]. Therefore, the role of conventional MRI in the differentiation of benign and malignant parotid gland tumors appears to be controversial.
Our previous studies confirmed the utility of apparent diffusion coefficient (ADC) in combination with color Doppler flow imaging [8] and multi-phasic computer tomography (CT) [9] for classifying parotid gland lesions into benign and malignant tumors. However, the results were still not entirely satisfactory.
Susceptibility-weighted imaging (SWI) is a longTE, fully flow-compensated, high-resolution, 3D gradient-echo sequence that maximizes the sensitivity to susceptibility effects [10] with filtered-phase information to create the contrast in magnitude images and add the susceptibility difference between tissues. It provides additional diagnostic information that is usually complementary to conventional MRI sequences to evaluate various neoplasms [11,12]. Tumor vascular hyperplasia and hemorrhage are important in tumor grading [10–14]. However, the value of SWI on the diagnosis of parotid gland lesions has not been studied.
Eida et al. [15] showed that apparent diffusion coefficient (ADC) values appeared more frequent in areas with high ADC values (≥1.8×10⁻³ mm2/s) and were significantly greater in benign lesions than in malignant ones. Furthermore, Yabuuchi et al. [16] emphasized that TIC pattern in dynamic contrast-enhanced MRI integrated with ADC in DWI can improve diagnostic accuracy when differentiating benign from malignant parotid gland lesions. Nevertheless, the diagnostic value of the integration of DWI and SWI in the characterization of parotid gland lesions has not been reported in the literature.
Thus, this study retrospectively analyzed the characteristics of DWI, SWI, and conventional MR features of the parotid gland lesions, aiming to improve the differential diagnosis between benign and malignant parotid lesions.
Material and Methods
Patients
The research was approved by the Ethics Committee of our hospital. We enrolled a total of 36 patients (21 males and 15 females; age range 21–83 years, mean age 48.6 years) with parotid gland diseases in our hospital from March 1, 2017 to January 30, 2018. Inclusion criteria were: (a) MR imaging scan was performed within 2 weeks before surgery, and without any pathology results or medical treatment performed on parotid lesions; (b) DWI, SWI, and conventional MR sequences were performed in all cases before treatment; and (c) All cases were confirmed by postoperative pathology.
MR imaging
All MR examinations were performed on a 1.5T superconducting magnetic resonance device (Siemens Magnetom Avanto, Germany) by using an 8-channel phased array head and neck coil. The MR imaging examination included the whole parotid gland and the neck region. The imaging parameters of conventional sequence were: 6-mm section thickness, 1-mm intersection gap, 23-cm field of view; FS T1WI (TE 8.7 ms, TR 695 ms) and FS T2WI (TE 101 ms, TR 4260 ms). In the DWI sequence, a 6-mm section thickness, 2-mm intersection gap, TE 103 ms, 3400 ms, 23-cm field of view, and b-values of 0 and 1000 mm2/s, ADC maps were automatically generated by post processing workstation (Syngo MRB1, Siemens). For the SWI sequence, a 2-mm section thickness, 0.4-mm intersection gap, 23-cm field of view, TE 40 ms, TR 49 ms, minimum intensity projection (SWI-MinP) were also automatically generated by the same post-processing workstation.
MR image evaluation
All MR images were observed in consensus by 2 authors (Wei Zhang and Xiangyang Huang) with 10 and 22 years of experience in head and neck MR imaging, respectively, who were blinded to histopathologic results. The morphological features of parotid benign and malignant lesions were recorded on conventional MR images including: tumor diameter (mm), morphology (regular/irregular), margin (well-defined/ill-defined), deep lobe of parotid invasion (yes/no), retromandibular vein invasion (yes/no), swollen lymph nodes with a diameter of more than 1 cm (yes/no), and the cystic regions (central/peripheral). For the acquisition of ADC values and normalized ADC values, the regions of interest (ROIs) were manually drawn for signal intensity measurement of the lesions and the normal parotid gland to avoid the vessels and cystic parts. We matched 3 ROIs in ADC maps with the area of the ROI in conventional MR images, and then the averaged ADC values were obtained from 3 ROIs. The normalized ADC values formula was calculated by using the following equation:
ADClesion refers to the ADC value of the lesion; ADCnormal gland refers to the ADC value of the surrounding normal parotid gland.
SWI-MinP were observed for semiquantitative analysis and the degree of ITSS was divided into 4 grades on SWI-MinP according to previous report [17]: Grade 0, no ITSS; Grade1, 1~5 dot-like or fine linear ITSSs; grade 2, 6~10 dot-like or fine linear ITSSs; and grade 3, ≥11 dot-like or fine linear ITSSs. A wide range of hypo-intense signals within a lesion was also summarized as grade 3 because artifacts were caused by excessive iron deposition or excessive intralesional hemorrhage.
Statistical analysis
Statistical software (SPSS, version19.0 J for Windows; Chicago, IL) was used to analyze the raw data. The normal distribution of the measured data was analyzed by Kolmogorov-Smirnov test. The independent-samples t test was performed to assess tumor diameter, ADC values, and ADCNormalized values between benign and malignant lesions. The Mann-Whitney U test was used to analyze the significance of ordinal date of ITSS grading between the 2 groups. Fisher’s exact test was used for statistical analysis of morphology, margin, deep lobe of parotid invasion, retromandibular vein invasion, swollen lymph nodes, and the cystic regions between the benign and malignant lesions. Based on a descriptive analysis, we used the logistic regression model for regression statistical analysis. The receiver operating characteristic (ROC) curve was used for analyzing results and determining cut-off values. The sensitivity (SE), specificity (SP), and area under the curve were calculated from the ROC curve to identify benign and malignant lesions. P<0.05 was considered statistically significant.
Results
We found 26 cases of benign lesions by surgical pathology: 15 cases of pleomorphic adenoma, 10 cases of Warthin’s tumors, and 1 case of granulomatous inflammation. Malignant lesions were found in 10 cases: acinic cell carcinoma in 6 cases and adenoid cystic carcinoma in 4 cases.
Image evaluation of conventional MRI
In 36 lesions (26 benign and 10 malignant), Table 1, Figures 1–3 and statistical tests showed that the tumor diameter, morphology, margin, retromandibular vein invasion, swollen lymph nodes and the cystic regions found statistical differences between the benign and malignant lesions (P<0.05), imaging findings were as follows: the tumor diameter of benign lesions (2.56±0.59 cm) was significantly smaller than diameters of malignant lesions (4.24±1.99 cm). The regular morphology (23/26, 88.5%), well-define margin (22/26, 84.6%), and less retromandibular vein invasion (1/26, 3.8%) or swollen lymph nodes (5/26, 19.2%) of benign lesions were significantly different than those of malignant lesions (3/26, 11.5%), (4/26, 15.4%), (25/26, 96.2%), and (21/26, 80.8%), respectively. Deep-lobe parotid invasion was not significantly different between benign (10/26, 38.5%) and malignant (8/26, 30.8%) lesions.
Table 1.
Coventional MR imaging findings of benign and malignant parotid lesions.
| MRI findings | Benign (n=26) | Malignant (n=10) | P value |
|---|---|---|---|
| Maximum diameter (cm) | 2.56±0.59 | 4.24±1.99 | 0.027 |
| Morphology | |||
| Regular | 23 | 2 | 0.000 |
| Irregular | 3 | 8 | |
| Margin | |||
| Well-define | 22 | 2 | 0.001 |
| Ill-define | 4 | 8 | |
| Deep lobe of parotid invasion | |||
| Yes | 10 | 8 | 0.06 |
| No | 16 | 2 | |
| Retromandibular vein invasion | |||
| Yes | 1 | 7 | 0.000 |
| No | 25 | 3 | |
| Swollen lymph nodes | |||
| Yes | 5 | 8 | 0.001 |
| No | 21 | 2 | |
| The cystic regions | |||
| Central | 5 | 6 | 0.003 |
| Periphery | 20 | 1 | |
Figure 1.

Images in a 28-year-old man with pleomorphic adenoma. A parotid gland tumor is imaged with (A) Apparent diffusion coefficient (ADC) map, which illustrates the regions of interest placement for ADC measurements; ADC value is 1.559×10⁻³ mm2/S, ADC Normalized value is 79.8%. (B) Intratumoral susceptibility signals (ITSS) map; ITSS is grade 1.
Figure 2.

Images in a 47-year-old man with Warthin’s tumors. A parotid gland tumor is imaged with (A) apparent diffusion coefficient (ADC) map, which illustrates the regions of interest placement for ADC measurements, ADC value is 0.604×10⁻³ mm2/s, ADCNormalized value is −31%; (B) Intratumoral susceptibility signals (ITSS) map; ITSS is grade 1.
Figure 3.

Images in a 58-year-old man with achromatosis of the parotid gland. A parotid gland tumor is imaged with (A) apparent diffusion coefficient (ADC) map, which illustrates the regions of interest placement for ADC measurements. ADC value is 0.805×10⁻³ mm2/s, ADCNormalized value is −19.7%. (B) Intratumoral susceptibility signals (ITSS) map; ITSS is grade 3.
Image evaluation of DWI and SWI
The mean ADC values of parotid lesions were no significantly different between malignant and benign lesions (P=0.07), while the ADCNormalized values (P=0.026) were significantly different. The mean ADC values and ADCNormalized values were as follows: (1.15±0.42)×10−3 mm2/s and (20.8 ± 40.9)% for benign lesions, (0.86±0.38)×10−3mm2/s and (−13.2±34.8)% for malignant lesions (Figures 1–3). The Mann-Whitney U test showed that the differences in ITSS grading were statistically significant between benign and malignant lesions (P=0.003) (Figures 1–3; Table 2).
Table 2.
Intratumoral susceptibility signals (ITSS) and Normalized apparent diffusion coefficient (ADCNormalized) in benign and malignant parotid lesions.
| Benign (n=26) | Malignant (n=10) | P value | |
|---|---|---|---|
| ITSS | |||
| Grade 0 | 3 | 0 | 0.003 |
| Grade 1 | 19 | 3 | |
| Grade 2 | 2 | 4 | |
| Grade 3 | 2 | 3 | |
| ADCNormalized | (20.8±40.9)% | (−13.2±34.8)% | 0.026 |
Evaluation of diagnostic value
The optimum thresholds of ADCNormalized values and ITSS derived from the receiver operating characteristic curve were −0.45% and grade 2 between benign and malignant lesions. Logistic regression analysis indicated that ADCNormalized values and ITSS grading were the factors associated with the estimation of malignant lesions (Table 3). When we assigned a diagnosis on the basis of ADCNormalized patterns alone and regarded “ADCNormalized values <−0.45%” as benign lesions and “ADCNormalized values ≥–0.45%” as malignant lesions, the SE, SP, and AUC values were 65.4%, 70.0%, and 0.750, respectively. Moreover, when we assigned a diagnosis on the basis of ITSS patterns alone and regarded “ITSS grading 0 or 1” as benign lesions and “ITSS grading 2 or 3” as malignant lesions, the SE, SP, and AUC values were 70.00%, 84.60%, and 0.787%, respectively. When we integrated ADCNormalized with ITSS, the diagnostic efficiency was greater than with patterns alone, and the SE, SP, and AUC values were 70.00%, 96.15%, and 0.846, respectively (Table 4; Figure 4).
Table 3.
Results by logistic regression fitting.
| Regression coefficient | Standard error | Wald | P value | Odds ratio (95% CI) | |
|---|---|---|---|---|---|
| ADCNormalized | −3.277 | 1.666 | 3.869 | 0.011 | 0.038 (0.001–0.988) |
| ITSS | 1.582 | 0.621 | 6.504 | 0.049 | 4.867 (1.442–16.423) |
ADCNormalized – normalized apparent diffusion coefficient; ITSS – intratumoral susceptibility signals; CI – confidence interval.
Table 4.
The diagnostic performance of intratumoral susceptibility signals (ITSS) and normalized apparent diffusion coefficient (ADC) between benign and malignant parotid lesions.
| Diagnostic patterns | AUC | Sensitivity (%) | Specificity (%) |
|---|---|---|---|
| ITSS | 0.787 | 70.0 | 84.6 |
| ADCNormalized | 0.750 | 65.4 | 70.0 |
| ITSS+ ADCNormalized | 0.846 | 70.0 | 96.15 |
ADCNormalized – normalized apparent diffusion coefficient; AUC – areas under the receiver operating characteristic curve.
Figure 4.
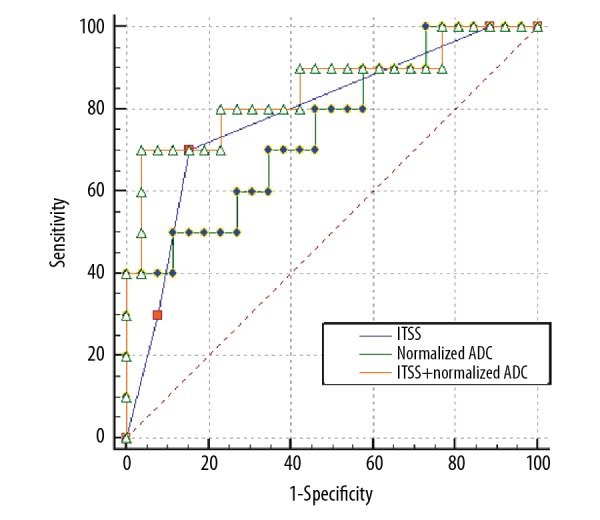
Receiver operating curve (ROC) in relation to compared diagnostic effectiveness of normalized apparent diffusion coefficient (ADC), intratumoral susceptibility signals (ITSS), and normalized ADC combined with ITSS.
Discussion
The most common benign lesions in the parotid gland are pleomorphic adenoma and Warthin’s tumor, but the pathologic origin in malignant lesions is diverse, including adenocystic carcinoma, squamous cell carcinoma, mucoepidermoid carcinoma, and other malignant tumors of epithelial or lymphatic origin [18]. The complexity of the pathological components presents difficulties for the characterization of parotid gland lesions. With the addition of conventional MRI and functional MRI, it may be possible to avoid unnecessary surgery or biopsy for lesions in the parotid gland. Therefore, the purpose of this study was to assess and compare conventional MRI, DWI, and SWI, and the combination DWI and SWI to determine their value in diagnosis of parotid gland lesions.
Our study showed that benign parotid lesions were relatively smaller with regular morphology, but malignant lesions were larger with more irregular morphology and infiltration into surrounding structures, which is similar to findings of previous studies [5–7]. In addition, the present study showed that the cystic regions of the benign parotid lesions are usually located around the tumor, while the cystic region of the malignant lesions is located in the center. We speculate that this imaging performance is related to the differences of pathological origin of the cystic region: the cystic region of the parotid benign lesions is caused by degeneration and it can randomly distribute around the lesion. Benign parotid lesions grow slowly, so the cystic regions caused by ischemic necrosis are often located around the lesion where there is less blood supply. When referring to malignant parotid lesions, its cystic regions are derived from liquefaction of ischemia necrosis, which is caused by insufficient blood supply. Angiogenesis in the focal center was inadequate for rapid growth of the malignant lesions, so the cystic regions distribute in the center [19–22].
The diagnostic value of DWI in the characterization of parotid gland lesions is well recognized. Previous studies [8,23] pointed out that there were significant differences in ADC values among pleomorphic adenoma, Warthin’s tumor, and malignant tumor, while Warthin’s tumor had the lowest ADC values among these three. Paradoxically, Matsushima et al. [24] found considerable limitations and no statistical difference in differentiation of benign from malignant parotid lesions by ADC values, possibly because Warthin’s tumor has a low ADC value due its mucus composition. To the best of our knowledge, the values are often influenced by many factors in the process of actual measurement in ADC values, such as individual differences among patients, basal metabolism level, and even fluctuations of respiratory rate. Therefore, our study introduced the concept of “ADCNormalized values” to improve the stability of ADC values. We found that there were no significant differences between benign and malignant parotid lesions on the basis of ADC values, agrees with Matsushima et al. [20]. Furthermore, ADCNormalized values showed statistically significant differences in the differentiation of benign and malignant lesions, with the optimal diagnostic threshold of -0.45% (which is close to zero), thus, we presented the new idea that “when ADC values of parotid gland lesions are lower than the surrounding glands, it tends to be malignant, and vice versa”. Obviously, the ADCNormalized is more advantageous than other examination methods, as it allows easy and quantitative evaluations.
ITSS was defined as hypo-intense signal fine dot-like or linear area, which is observed in SWI-MinP. ITSS enables semi-quantitative differentiation of benign from malignant lesions [17]. Our study indicated that benign lesions have a significantly lower ITSS grade than malignant ones, with a high degree of ITSS (grades 2–3), allowing differentiation of malignant from benign lesions. The pathophysiology that produces these differences between benign and malignant lesions is possible as follows: benign lesions has less hemorrhage because of its rich microvasculature and slow growth, such as inflammatory granulomas and pleomorphic adenoma. Vascular architecture abnormalities (e.g., tortuous, hemorrhage, and embolism) of malignant lesions all result in an increase in deoxyhemoglobin or ferritin.
Although DWI and SWI each have their own advantages for the diagnosis of parotid gland lesions, their utility is limited in practical work if not used in combination. Our study was based on the signs of the conventional MRI and combined DWI and SWI. When we combined normalized ADC with ITSS, the diagnostic efficiency was greater than when used alone.
There are some limitations to our study. First, there were relatively few malignant lesions. However, the results of conventional MRI were similar to those of previous studies. Thus, other results might reflect the MR results. Future research should have larger sample sizes. Second, our study only included benign and malignant lesions in the parotid gland and did not further analyze the subgroup of pleomorphic adenoma and Warthin’s tumor in benign lesions, so further experiments are needed to obtain more multidimensional results.
Conclusions
The differential diagnostic value of integrating DWI and SWI is higher than when these are used alone. In addition to paying attention to functional MRI in clinical application, we need to combine conventional MRI to maximally enrich diagnostic thinking.
Footnotes
Conflict of interests
None.
Source of support: This work was supported by Guangxi Zhuang Autonomous Region Health and Family Planning Commission research program (No. S201628), Guangxi Natural Science Foundation Youth Project (No. 2011GXNSFB018089), and International Communication of Guangxi Medical University Graduate Education (2017)
References
- 1.Pinkston JA, Cole P. Incidence rates of salivary gland tumors: Results from a population-based study. Otolaryngol Head Neck Surg. 1999;120:834–40. doi: 10.1016/S0194-5998(99)70323-2. [DOI] [PubMed] [Google Scholar]
- 2.Freling NJ, Molenaar WM, Vermey A, et al. Malignant parotid tumors: Clinical use of MR imaging and histologic correlation. Radiology. 1992;185:691–96. doi: 10.1148/radiology.185.3.1438746. [DOI] [PubMed] [Google Scholar]
- 3.Witt RL. The significance of the margin in parotid surgery for pleomorphic adenoma. Laryngoscope. 2002;112:2141–54. doi: 10.1097/00005537-200212000-00004. [DOI] [PubMed] [Google Scholar]
- 4.Papadogeorgakis N, Skouteris CA, Mylonas AI, Angelopoulos AP. Superficial parotidectomy: Technical modifications based on tumour characteristics. J Craniomaxillofac Surg. 2004;32:350–53. doi: 10.1016/j.jcms.2004.05.004. [DOI] [PubMed] [Google Scholar]
- 5.Sakamoto M, Iikubo M, Kojima I, et al. Diagnostic value of capsule-like rim enhancement on magnetic resonance imaging for distinguishing malignant from benign parotid tumours. Int J Oral Maxillofac Surg. 2014;43:1035–41. doi: 10.1016/j.ijom.2014.03.008. [DOI] [PubMed] [Google Scholar]
- 6.Lim LH, Chao SS, Goh CH, et al. Parotid gland surgery: 4-year review of 118 cases in an Asian population. Head Neck. 2003;25:543–48. doi: 10.1002/hed.10267. [DOI] [PubMed] [Google Scholar]
- 7.Som PM, Biller HF. High-grade malignancies of the parotid gland: Identification with MR imaging. Radiology. 1989;173:823–26. doi: 10.1148/radiology.173.3.2813793. [DOI] [PubMed] [Google Scholar]
- 8.Zhang W, Zuo Z, Luo N, et al. Non-enhanced MRI in combination with color Doppler flow imaging for improving diagnostic accuracy of parotid gland lesions. Eur Arch Otorhinolaryngol. 2018;275:987–95. doi: 10.1007/s00405-018-4895-6. [DOI] [PubMed] [Google Scholar]
- 9.Jin GQ, Su DK, Xie D, et al. Distinguishing benign from malignant parotid gland tumours: low-dose multi-phasic CT protocol with 5-minute delay. Eur Radiol. 2011;21:1692–98. doi: 10.1007/s00330-011-2101-y. [DOI] [PMC free article] [PubMed] [Google Scholar]
- 10.Li C, Ai B, Li Y, et al. Susceptibility-weighted imaging in grading brain astrocytomas. Eur J Radiol. 2010;75:e81–85. doi: 10.1016/j.ejrad.2009.08.003. [DOI] [PubMed] [Google Scholar]
- 11.Sehgal V, Delproposto Z, Haacke EM, et al. Clinical applications of neuroimaging with susceptibility-weighted imaging. J Magn Reson Imaging. 2005;22:439–50. doi: 10.1002/jmri.20404. [DOI] [PubMed] [Google Scholar]
- 12.Sehgal V, Delproposto Z, Haddar D, et al. Susceptibility-weighted imaging to visualize blood products and improve tumor contrast in the study of brain masses. J Magn Reson Imaging. 2006;24:41–51. doi: 10.1002/jmri.20598. [DOI] [PubMed] [Google Scholar]
- 13.Mittal S, Wu Z, Neelavalli J, Haacke EM. Susceptibility-weighted imaging: technical aspects and clinical applications, part 2. Am J Neuroradiol. 2009;30:232–52. doi: 10.3174/ajnr.A1461. [DOI] [PMC free article] [PubMed] [Google Scholar]
- 14.Thomas B, Somasundaram S, Thamburaj K, et al. Clinical applications of susceptibility weighted MR imaging of the brain – a pictorial review. Neuroradiology. 2008;50:105–16. doi: 10.1007/s00234-007-0316-z. [DOI] [PubMed] [Google Scholar]
- 15.Eida S, Sumi M, Sakihama N, et al. Apparent diffusion coefficient mapping of salivary gland tumors: Prediction of the benignancy and malignancy. Am J Neuroradiol. 2007;28:116–21. [PMC free article] [PubMed] [Google Scholar]
- 16.Yabuuchi H, Matsuo Y, Kamitani T, et al. Parotid gland tumors: Can addition of diffusion-weighted MR imaging to dynamic contrast-enhanced MR imaging improve diagnostic accuracy in characterization? Radiology. 2008;249:909–16. doi: 10.1148/radiol.2493072045. [DOI] [PubMed] [Google Scholar]
- 17.Kim HS, Jahng GH, Ryu CW, Kim SY. Added value and diagnostic performance of intratumoral susceptibility signals in the differential diagnosis of solitary enhancing brain lesions: preliminary study. Am J Neuroradiol. 2009;30:1574–79. doi: 10.3174/ajnr.A1635. [DOI] [PMC free article] [PubMed] [Google Scholar]
- 18.de Morais ML, Azevedo PR, et al. Clinicopathological study of salivary gland tumors: an assessment of 303 patients. Cad Saude Publica. 2011;27:1035–40. doi: 10.1590/s0102-311x2011000500020. [DOI] [PubMed] [Google Scholar]
- 19.Tsushima Y, Matsumoto M, Endo K, et al. Characteristic bright signal of parotid pleomorphic adenomas on T2-weighted MR images with pathological correlation. Clin Radiol. 1994;49:485–89. doi: 10.1016/s0009-9260(05)81748-9. [DOI] [PubMed] [Google Scholar]
- 20.Ikeda M, Motoori K, Hanazawa T, et al. Warthin tumor of the parotid gland: Diagnostic value of MR imaging with histopathologic correlation. Am J Neuroradiol. 2004;25:1256–62. [PMC free article] [PubMed] [Google Scholar]
- 21.de Ru JA, van Benthem PP, Hordijk GJ. The location of parotid gland tumors in relation to the facial nerve on magnetic resonance images and computed tomography scans. J Oral Maxillofac Surg. 2002;60:992–94. doi: 10.1053/joms.2002.34402. discussion 995. [DOI] [PubMed] [Google Scholar]
- 22.Kato H, Kanematsu M, Watanabe H, et al. Salivary gland tumors of the parotid gland: CT and MR imaging findings with emphasis on intratumoral cystic components. Neuroradiology. 2014;56:789–95. doi: 10.1007/s00234-014-1386-3. [DOI] [PubMed] [Google Scholar]
- 23.Habermann CR, Arndt C, Graessner J, et al. Diffusion-weighted echo-planar MR imaging of primary parotid gland tumors: Is a prediction of different histologic subtypes possible? Am J Neuroradiol. 2009;30:591–96. doi: 10.3174/ajnr.A1412. [DOI] [PMC free article] [PubMed] [Google Scholar]
- 24.Matsushima N, Maeda M, Takamura M, Takeda K. Apparent diffusion coefficients of benign and malignant salivary gland tumors. Comparison to histopathological findings. J Neuroradiol. 2007;34:183–89. doi: 10.1016/j.neurad.2007.04.002. [DOI] [PubMed] [Google Scholar]