

Abstract
Introduction:
Income is hypothesized to affect health not just through material pathways (i.e. the ability to purchase health-enhancing goods) but also through psychosocial pathways (e.g. social comparisons with others). Two concepts relevant to the psychosocial effects of income are: relative deprivation (for example expressed by the Yitzhaki Index, measuring the magnitude of difference in income among individuals) and Income Rank. This study examined whether higher relative deprivation and lower Income Rank are associated with depressive symptoms in an older population independently of absolute income.
Method:
Using cross-sectional data of 83,100 participants (40,038 men and 43,062 women) in the Japan Gerontological Evaluation Study (JAGES), this study applied multiple logistic regression models to calculate the odds ratios (OR) of depression associated with relative deprivation/Income Rank. The Japanese Geriatric Depression Scale (GDS-15) was used to assess depressive symptoms, and subjects with a score of ≥5 were categorized as depressed. Reference groups for calculating Yitzhaki Index and Income Rank were constructed based on same gender, age-group, and municipality of residence.
Results:
The findings indicated that after controlling for demographic factors, each 100,000 yen increase in relative deprivation and 0.1 unit decrease in relative rank was associated with a 1.07 (95% CI: 1.07, 1.08) and a 1.15 (95% CI: 1.14, 1.16) times higher odds of depression, respectively, in men. The corresponding ORs in women were 1.05 (95% CI: 1.05, 1.06) and 1.12 (95% CI: 1.11, 1.13), respectively. After adjustment for other covariates and stratification by income quartiles, the results remained statistically significant. Women in the highest income quartile appeared to be more susceptible to the adverse mental health effects of low Income Rank, while among men the associations were reversed, low Income Rank appeared more toxic for the poor.
Conclusion:
Concepts of relative income appear to be relevant for mental health over and above the effects of absolute income.
INTRODUCTION
Income and health are robustly correlated; the more money people earn, the better their health, up to a certain point. That is, there is a ceiling on the level of health we can achieve, but there is no theoretical limit on how much money we can amass. Two hypotheses have been proposed to account for the association between income and health. The materialist tradition emphasizes the goods and services that money can purchase. By contrast, the psychosocial explanation focuses on the salience of social comparisons triggered by inequalities in income, which can result in feelings of unfairness, frustration, shame, stress, anxiety, and resentment (Kawachi et al., 2002; Marmot and Wilkinson, 2001; Wilkinson, 1996). In turn, these negative emotions are hypothesized to deleteriously affect mental health, and to increase negative coping responses including heavy alcohol consumption, smoking, and drug abuse (McEwen and Seeman, 1999). The psychosocial hypothesis thus implies that health is affected not only by an individual’s absolute level of income, but also by the relative position conferred by one’s level of income in the social hierarchy (Boyce et al., 2010; Daly et al., 2015; Wilkinson, 1997; Wood et al., 2012). Studies on subordinate social rank support this theory, both in primate and human experiments (Mendelson et al., 2008; Sapolsky, 2005).
Relative deprivation has been defined as “the extent of the difference between the desired situation and that of the person desiring it” (Runciman, 1966). Several measures have been proposed to evaluate relative deprivation. One such measure is the Yitzhaki Index, which calculates the aggregate differences between an individual’s income and all other individuals earning higher incomes who belong to the same reference group (Adjaye-Gbewonyo and Kawachi, 2012; Yitzhaki, 1979). In past studies, the Yitzhaki Index has been demonstrated to be correlated with mortality, poor self-rated health, mental-health services utilization, functional disability, as well as smoking and obesity (Kawachi and Kennedy, 1999a; Kondo et al., 2008, 2009, 2015; Subramanyam et al., 2009). In contrast to the Yitzhaki Index, Income Rank refers to an individual’s position in the income hierarchy. The difference between the Yitzhaki Index and Income Rank can be illustrated as follows: If employee X receives an annual bonus whilst everyone else in the same workplace fails to receive a bonus, then the Yitzhaki Index for X will decline, even though his Income Rank will remain the same (i.e., assuming that the size of the bonus is not so large as to vault his earnings above his higher-paid co-workers). Therefore, if the effects of Income Rank on health are independent of the magnitude of difference in income between individuals (Yitzhaki Index), then current health policies targeted to reduce income inequality (e.g., money transfers) are insufficient to address the problem of relative rank (Eckersley, 2015). In the literature on the relative effects of income, few attempts have been made to distinguish between these two effects.
The concept of Income Rank is based on the notion that people usually do not know exactly how much others earn, and judgement is instead influenced by the rank conferred by income (Boyce et al., 2010). Income Rank is thus analogous to the concept of positional rank in dominance hierarchies, which have been extensively studied in non-human primates such as macaque monkeys and baboons. In non-human primate societies there is no such thing as “income”; nonetheless, positional rank determines access to food, reproductive mates, and longevity. In human populations, lower Income Rank has been shown to correlate with worse self-rated health, allostatic load, obesity, mental distress, and suicidal ideation and attempts (Daly et al., 2015; Hounkpatin et al., 2016; Wetherall et al., 2015; Wood et al., 2012). It was also suggested that Income Rank might be a stronger and more consistent predictor of health when compared with other measures, such as the Yitzhaki Index (Hounkpatin et al, 2016).
The current study investigated the association between concepts of relative deprivation/Income Rank and mental health. In contrast to the majority of the existing literature which has been conducted in western society settings, the focus of this study is on a sample of older adults in Japan. It was hypothesized that social comparisons based on income would be less salient in this population for two reasons: First, the age-group in our sample (65 years or older) consists of mostly retired individuals, thereby removing a major source of social comparison in people’s daily lives – that is, income comparisons between co-workers in the same workplace. Secondly, traditional Japanese values have emphasized social cohesion, eschewing conspicuous displays of consumption even when income differences do exist. The origin of this concept dates back to the post-War period of rapid economic expansion (1950–1975) during which time the Japanese government espoused the “middle class consciousness of 100 million people” (一億総中流 – ichioku so chyuryu). Although income inequality has dramatically increased in the past twenty years, this consciousness is still embraced by Japanese people of this generation (i.e., those who were working during this period) (Kelly, 2002).
METHOD
Study population
The data come from the baseline survey of the Japan Gerontological Evaluation Study (JAGES), a nationwide cohort study established in 2010 to examine the predictors of healthy aging and functional disability (Figure 1). Eligible participants aged 65 years or older were identified from the resident registry and long term care insurance databases of 31 municipalities in 12 prefectures throughout Japan. Between August 2010 and January 2012, the surveys were mailed to a random sample of 169,215 community-dwelling seniors who were free of documented disability. Out of the 112,123 respondents (national response rate: 66.3%), 102,869 individuals provided valid information on age, sex, and municipality of residence, and thus constituted the cohort baseline of the JAGES study (JAGES2010v3). This analysis was conducted among 83,100 subjects (40,038 men and 43,062 women) who provided valid information on depressive symptoms. The protocol for the study was approved by the ethics committee of Nihon Fukushi University.
Figure 1.
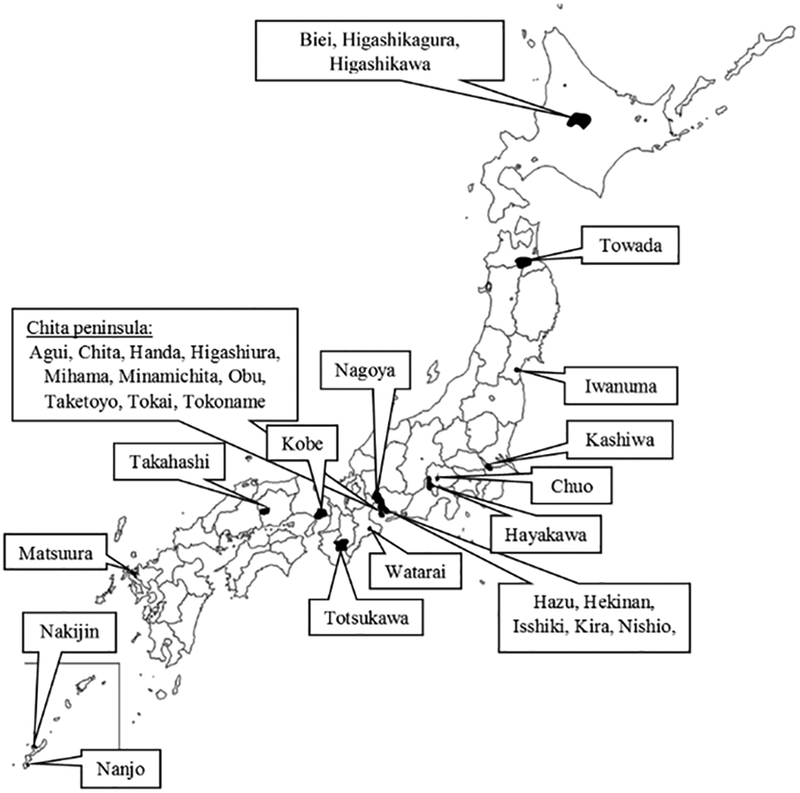
Map of Japan – Japan Gerontological Evaluation Study (JAGES 2010)*
*A simple random sampling method was used in case the number of eligible participants was at least 5,000 or more. The study was conducted using a random sample in 15 municipalities (Tokai, Obu, Chita, Higashiura, Handa, Hekinan, Nishio, Isshiki, Kira, Hazu, Nagoya, Matsuura, Towada, Kashiwa, and Kobe), and all eligible residents in 16 smaller municipalities (Tokoname, Agui, Taketoyo, Mihama, Minamichita, Totsukawa, Watarai, Takahashi, Iwanuma, Nakijin, Nanjo, Chuo, Hayakawa, Higashikawa, Higashikagura, and Biei).
Depressive symptoms
Depressive symptoms were assessed through the short version of the Japanese Geriatric Depression Scale (GDS-15); a self-administered survey consisting of 15 questions with a simple yes/no format (Appendix Table 1), where higher scores indicate higher depressive symptomatology (Burke et al., 1991; Wada et al., 2003). Using a predefined cut-off point, subjects with a GDS-15 score of 5 or more were categorized as depressed, and those with a GDS-15 score less than 5 as non-depressed (Lyness et al., 1997; Schreiner et al., 2003). Using the cut-off point of 5, GDS-15 has a sensitivity of 92% and a specificity of 81% for detecting major depression validated by using the Structured Clinical Interview for DSM-III-R (SCID) (Lyness et al., 1997). In this sample, the standardized Cronbach’s α of the GDS-15 was 0.84.
Relative income measures
Two measures were examined to assess relative income. The first was the Yitzhaki Index, estimated with the following formula (Yitzhaki, 1979):
where is the income of individual i, is the incomes of all individuals j whose incomes are higher than individual i’s, and N is the number of people in i’s reference group. The Yitzhaki Index therefore calculates the average difference between an individual’s income and the incomes of all individuals with higher income belonging to the same reference group. The survey did not inquire about people’s reference groups (i.e., the basis of social comparisons in the space of income). Following previous studies, it was assumed that individuals compare their incomes to others based on similarity of sex, age-group, and municipality of residence (Ishida, 2011; Kondo et al., 2015). For example, it was assumed that an 80-year-old woman living in rural Okinawa would compare her income to other women with the same characteristics, and not be drawing comparisons to a 65-year-old male living in metropolitan Tokyo.
The second measure was Income Rank, derived by:
where is the number of individuals with lower income than individual i’s, and n is the total number of individuals within i’s reference group. Possible values range between 0, representing the lowest rank, and 1, representing the highest rank within the reference group.
In the JAGES 2010 questionnaire 15 income categories were defined, and in each category the midpoint was set as the household income of the study participants. A median-based Pareto curve estimate was used to derive a midpoint for the open-ended top category (Parker and Fenwick, 1983). For calculating both Yitzhaki Index and Income Rank, an equivalized income variable was created by dividing gross household income by the square root of the number of household members.
Covariates
As for potential confounding variables, age (continuous variable in years), gender (man or woman), years of education (<6, 6–9, 10–12, ≥13 years, or ‘other’), marital status (married or ‘other’), number of diagnosed illnesses (a score from 0 to 21), self-rated health (poor/fair or excellent/good), and activities of daily living (ADL [a score ranging from 0 to 13]) were included in the multivariate models. Self-rated health was evaluated in the JAGES 2010 survey by the following question: “How is your current health status?” The possible answers – “excellent”, “good”, “fair”, or “poor” – were later dichotomized into excellent/good versus fair/poor. Diagnosed illnesses were also self-reported, assessed by asking whether the participant was currently receiving treatment for any of the following conditions: cancer, heart disease, stroke, hypertension, diabetes, obesity, hyperlipidemia, osteoporosis, arthritis, trauma, respiratory illnesses, gastrointestinal illnesses, liver disease, mental illness, visual-, hearing-impairment, dysphagia, incontinence, sleeping disorders, undiagnosed and other. For measuring higher level ADLs, the Tokyo Metropolitan Institute of Gerontology Index of Competence (TMIG-IC) was used (Koyano et al., 1991). The TMIG-IC consists of 13 yes/no format questions for evaluating self-maintenance, intellectual activities, and social roles among the elderly with a possible maximum score of 13, where lower scores indicate lower level of competence.
Statistical Analysis
Missing values for the income measures and the covariates were replaced using sequential regression multiple imputation (SRMI, also called “imputation by full conditional specification” or “imputation using chained equations”). Ten imputed datasets were created, then multiple logistic regression models were used on each dataset to estimate odds ratios (OR) with 95% confidence intervals (CIs) for depression. To confirm a linear association between GDS-15 scores and relative deprivation/Income Rank, all analyses were repeated using linear regression models. After confirming that the interaction terms between the explanatory variables and sex were statistically significant, all analyses were stratified by gender. Combined estimates were calculated based on the ten imputed datasets.
Four sets of models were constructed for each income based measure to conduct both the logistic and the linear regression analyses.: The first model was adjusted for demographic factors including age, education, and marital status (Model 1), the second model (Model 2) controlled for additional confounding factors including self-rated health, number of diagnosed illnesses, and ADL score, and the third model (Model 3) was further adjusted for equivalized household income as a continuous variable. Model 4 was stratified by equivalized household income quartiles in order to check for effect modification, that is, to see whether the association between relative income and depressive symptoms differed according to household income level (Kondo et al., 2015). In order to assess the adverse effects of lower status, Income Rank was reverse coded in our analyses.
Finally, to test whether the effects of equivalized household income, Yitzhaki Index, and Income Rank are mutually independent from each other, Model 3 was extended to include all income-based measures. All analyses were conducted using SAS version 9.4 (SAS Institute Inc., Cary, NC) and SAS-callable IVEware (Imputation and Variance Estimation Software) version 0.2.
RESULTS
Table 1 provides descriptive characteristics of the study participants stratified by sex and equivalized household income. In both men and women, level of household income was inversely associated with the percentage of subjects reporting a GDS-15 score of 5 or more, the proportion of individuals with low educational attainment, as well as the prevalence of fair/poor self-rated health. Compared to men, women were more likely to report low educational attainment and less likely to be married, regardless of income.
Table 1.
Characteristics of participants according to equivalized household income quartiles, stratified by sex.
| Men (n=40,038) | Women (n=43,062) | ||||||||
|---|---|---|---|---|---|---|---|---|---|
| Equivalized Household Income Quartiles (10,000 yen) | |||||||||
| 1 (≤132.9) | 2 (133.0–201.9) | 3 (202.0–317.9) | 4 (318.0≤) | 1 (≤112.4) | 2 (112.5–187.9) | 3 (188.0–275.9) | 4 (276.0≤) | ||
| Population at riska, No. | 10,028.5 | 9707.0 | 10,577.6 | 9724.9 | 10,769.2 | 10,311.2 | 11,516.0 | 10,465.6 | |
| Population at risk, % | 25.1 | 24.2 | 26.4 | 24.3 | 25.0 | 24.0 | 26.7 | 24.3 | |
| Mean GDS, score | 4.6 | 3.6 | 3.1 | 2.5 | 4.3 | 3.8 | 3.1 | 2.7 | |
| GDS score ≥ 5, No. | 4192.4 | 2987.1 | 2669.6 | 1715.9 | 4169.2 | 3391.5 | 2792.6 | 2023.7 | |
| GDS score ≥ 5, % | 41.8 | 30.8 | 25.2 | 17.6 | 38.7 | 32.9 | 24.2 | 19.3 | |
| Age, years | 74.7 | 73.4 | 73.4 | 73.1 | 75.4 | 73.9 | 73.3 | 73.6 | |
| Low educational attainment (<10 years), % | 63.6 | 45.7 | 36.1 | 28.1 | 66.9 | 54.9 | 41.7 | 38.1 | |
| Married, % | 81.3 | 90.2 | 87.6 | 88.9 | 51.0 | 53.9 | 69.2 | 64.2 | |
| Fair/poor self-rated health, % | 27.4 | 21.5 | 19.1 | 15.6 | 25.8 | 21.3 | 16.6 | 15.1 | |
| Number of illnesses | 1.7 | 1.6 | 1.6 | 1.5 | 1.8 | 1.7 | 1.6 | 1.6 | |
| TMIG-IC, score | 10.6 | 11.1 | 11.4 | 11.6 | 11.1 | 11.5 | 11.8 | 11.9 | |
Abbreviations: GDS, Geriatric Depression Scale
Average of 10 imputed datasets.
Table 2 provides odds ratios for depression in relation to the Yitzhaki Index/relative rank for different reference groups. The results of the demographic factor-adjusted Model 1 show a positive association between depression and higher relative deprivation/lower rank, regardless of how the reference group was defined. For example, each 100,000 yen (USD $1,000) increment in the Yitzhaki Index was associated with an increase in odds ratios for depression by 1.05–1.06 (95% CI = 1.05, 1.06) for women, and 1.07 (95% CI = 1.07, 1.08) for men. For Income Rank, each 0.1 unit decrease in rank was associated with odds ratios for depression of 1.12 (95% CI = 1.11, 1.13) in women, and 1.15 (95% CI = 1.14, 1.16) for men.
Table 2.
Multivariate adjusted odds ratios (95% confidence intervals) of depression associated with relative deprivation for three reference groups.
| Models/Reference groups | Income Rank (0 vs 1) | Income Rank (0.1 unit) | Yitzhaki Index (100,000 yen) | |||
| Men OR (95% CI) | Women OR (95% CI) | Men OR (95% CI) | Women OR (95% CI) | Men OR (95% CI) | Women OR (95% CI) | |
| Model 1 | ||||||
| Gender and age group | 3.96 (3.64, 4.31) | 3.20 (2.94, 3.49) | 1.15 (1.14, 1.16) | 1.12 (1.11, 1.13) | 1.07 (1.07, 1.08) | 1.06 (1.05, 1.06) |
| Gender and municipality of residence | 4.04 (3.71, 4.39) | 3.19 (2.92, 3.48) | 1.15 (1.14, 1.16) | 1.12 (1.11, 1.13) | 1.07 (1.07, 1.08) | 1.05 (1.05, 1.06) |
| Gender, age group, and municipality of residence | 4.02 (3.69, 4.38) | 3.20 (2.93, 3.49) | 1.15 (1.14, 1.16) | 1.12 (1.11, 1.13) | 1.07 (1.07, 1.08) | 1.05 (1.05, 1.06) |
| Model 2 | ||||||
| Gender and age group | 3.25 (2.97, 3.56) | 2.83 (2.58, 3.10) | 1.12 (1.11, 1.14) | 1.11 (1.10, 1.12) | 1.06 (1.06, 1.07) | 1.05 (1.05, 1.06) |
| Gender and municipality of residence | 3.31 (3.02, 3.62) | 2.87 (2.61, 3.15) | 1.13 (1.12, 1.14) | 1.11 (1.10, 1.12) | 1.06 (1.06, 1.07) | 1.05 (1.04, 1.05) |
| Gender, age group, and municipality of residence | 3.29 (3.01, 3.60) | 2.86 (2.61, 3.13) | 1.13 (1.12, 1.14) | 1.11 (1.10, 1.12) | 1.06 (1.06, 1.07) | 1.05 (1.04, 1.05) |
| Model 3 | ||||||
| Gender and age group | 2.39 (1.97, 2.88) | 2.24 (1.84, 2.73) | 1.09 (1.07, 1.11) | 1.08 (1.06, 1.11) | 1.03 (1.03, 1.04) | 1.03 (1.02, 1.04) |
| Gender and municipality of residence | 2.47 (2.08, 2.94) | 2.30 (1.92, 2.75) | 1.09 (1.08, 1.11) | 1.09 (1.07, 1.11) | 1.03 (1.03, 1.04) | 1.03 (1.02, 1.03) |
| Gender, age group, and municipality of residence | 2.46 (2.07, 2.93) | 2.28 (1.91, 2.72) | 1.09 (1.08, 1.11) | 1.09 (1.07, 1.11) | 1.03 (1.03, 1.04) | 1.03 (1.02, 1.03) |
| Models/Reference groups | Income Rank (0 vs 1) | Income Rank (0.1 unit) | Yitzhaki Index (100,000 yen) | |||
| Men OR (95% CI) | Women OR (95% CI) | Men OR (95% CI) | Women OR (95% CI) | Men OR (95% CI) | Women OR (95% CI) | |
| Model 4 | ||||||
| Gender and age group | ||||||
| Q1 | 1.76 (0.94, 3.30) | 1.44 (0.75, 2.77) | 1.06 (0.99, 1.13) | 1.04 (0.97, 1.11) | 1.01 (1.00, 1.03)ns | 1.01 (0.99, 1.03) |
| Q2 | 2.97 (1.47, 6.02) | 2.06 (1.00, 4.24) | 1.12 (1.04, 1.20) | 1.08 (1.00, 1.16) | 1.08 (1.03, 1.12) | 1.05 (1.01, 1.09) |
| Q3 | 2.36 (1.21, 4.58) | 2.47 (1.26, 4.86) | 1.09 (1.02, 1.16) | 1.09 (1.02, 1.17) | 1.08 (1.03, 1.13) | 1.08 (1.02, 1.13) |
| Q4 | 6.63 (2.85, 15.46) | 6.37 (2.73, 14.85) | 1.21 (1.11, 1.31) | 1.20 (1.11, 1.31) | 1.13 (1.07, 1.19) | 1.13 (1.07, 1.19) |
| Gender and municipality of residence | ||||||
| Q1 | 3.38 (2.17, 5.27) | 2.29 (1.40, 3.76) | 1.13 (1.08, 1.18) | 1.09 (1.03, 1.14) | 1.03 (1.02, 1.04) | 1.02 (1.01, 1.03) |
| Q2 | 2.31 (1.45, 3.66) | 1.82 (1.20, 2.75) | 1.09 (1.04, 1.14) | 1.06 (1.02, 1.11) | 1.04 (1.02, 1.06) | 1.02 (1.00, 1.04) |
| Q3 | 1.90 (1.17, 3.07) | 2.24 (1.37, 3.64) | 1.07 (1.02, 1.12) | 1.08 (1.03, 1.14) | 1.03 (1.01, 1.06) | 1.04 (1.01, 1.07) |
| Q4 | 2.88 (1.39, 5.97) | 4.29 (2.13, 8.65) | 1.11 (1.03, 1.20) | 1.16 (1.08, 1.24) | 1.04 (1.00, 1.09) | 1.08 (1.04, 1.13) |
| Gender, age group, and municipality of residence | ||||||
| Q1 | 2.99 (1.94, 4.61) | 2.17 (1.34, 3.54) | 1.12 (1.07, 1.17) | 1.08 (1.03, 1.13) | 1.03 (1.01, 1.04) | 1.02 (1.01, 1.03) |
| Q2 | 2.34 (1.48, 3.69) | 1.76 (1.16, 2.68) | 1.09 (1.04, 1.14) | 1.06 (1.01, 1.10) | 1.04 (1.02, 1.06) | 1.02 (1.00, 1.04) |
| Q3 | 1.91 (1.19, 3.08) | 2.23 (1.38, 3.62) | 1.07 (1.02, 1.12) | 1.08 (1.03, 1.14) | 1.03 (1.00, 1.06) | 1.04 (1.01, 1.07) |
| Q4 | 2.88 (1.39, 5.95) | 4.03 (2.00, 8.12) | 1.11 (1.03, 1.20) | 1.15 (1.07, 1.23) | 1.04 (1.00, 1.08)ns | 1.07 (1.03, 1.12) |
Model 1 is adjusted for age, education, and marital status.
Model 2 is adjusted for age, education, marital status, self-rated health, number of diagnosed illnesses, and TMIG-IC.
Model 3 is adjusted for age, education, marital status, self-rated health, number of diagnosed illnesses, TMIG-IC, and equivalized household income.
Model 4 is adjusted for age, education, marital status, self-rated health, number of diagnosed illnesses, and TMIG-IC, and stratified by equivalized household income quartiles.
p>0.05
After adjusting for other covariates then also for equivalized household income, the odds ratios were first attenuated by 0–1% (Model 2) then by another 2–3% (Model 3) for each 100,000 yen increase in the Yitzhaki Index, and between 1 and 3% (Model 2) and an additional 2–4% (Model 3) for a 0.1 unit decrease in Income Rank; all estimates remained statistically significant.
When stratifying by equivalized household income (Model 4), the odds ratios for depression in the lowest income quartile – after including both age and municipality of residence to the definition of reference group (Table 2 and Figure 2) – were: 1.02 (95% CI = 1.01, 1.03) among women and 1.03 (95% CI = 1.01, 1.04) among men for each 100,000 yen increase in the Yitzhaki Index; and 1.08 (95% CI = 1.03, 1.13) among women and 1.12 (95% CI = 1.07, 1.17) among men for each 0.1 unit decrease in Income Rank. In the highest income quartile, the associations between relative rank and depression were stronger for women, but weaker for men. Using the same reference group, after including simultaneously all three income-based measures to the extended third model, only Income Rank and equivalized household income remained statistically significant: p < 0.0001 among both sexes for Income Rank, and p < 0.0001 among men and p = 0.0111 among women for equivalized household income (Appendix Table 3). However, although the estimates were in line with the results of Model 3, the variance inflation factors (VIF) increased >4.0 for equivalized household income, the Yitzhaki Index, and Income Rank, suggesting substantial collinearity between these variables when they were entered simultaneously into the same model.
Figure 2.
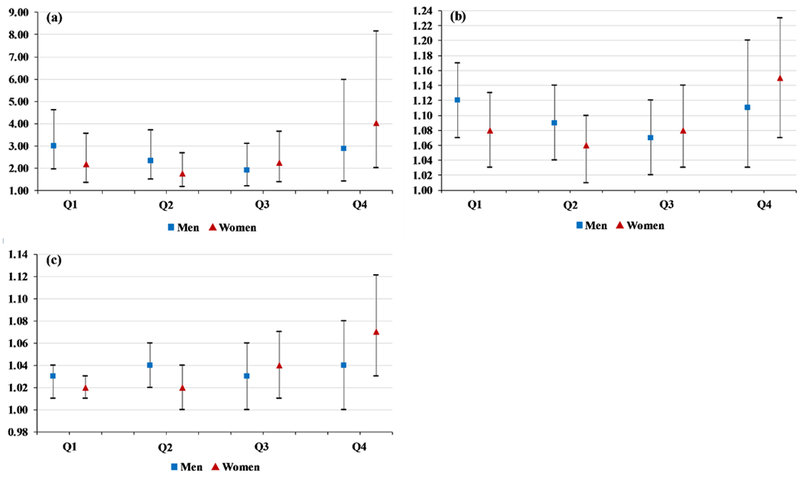
Fully adjusted odds ratios with 95% confidence intervals for depression associated with relative income deprivation*, stratified by equivalized household income. (a) Odds ratios for depression associated with Income Rank comparing individuals of the lowest [1] to individuals of the highest rank [0]. (b) Odds ratios for depression associated with a 0.1 unit decrease in Income Rank. (c) Odds ratios for depression associated with a 100,000 yen increase in Yitzhaki Index.
* The reference group was based on sex, age-group, and municipality of residence.
In multiple linear regression analyses, the linear association between GDS-15 scores and Yitzhaki Index/Income Rank (data shown in Appendix Table 2) was confirmed. Both higher relative deprivation and lower Income Rank showed a statistically significant correlation with increasing GDS-15 scores, even after adjustment for demographic factors and other covariates, as well as stratification by income quartiles.
DISCUSSION
Utilizing two different measures, the well-established Yitzhaki Index and the novel Income Rank measure, this study found that increased relative deprivation and lower relative rank was associated with higher GDS-15 scores and higher odds of depression in a population of community-dwelling Japanese seniors, independently of household income. This finding was contrary to the initial hypothesis that relative income effects on depressive symptoms would not be detected among older (mainly retired) adults, especially in a society that has long embraced a “mass middle class” ideology. There might be two different explanations for these findings. It is possible that even among older adults in a more egalitarian society with high social cohesion, differences in income and relative rank do produce adverse mental health effects. However, it is very important to note that in the past two decades income inequality increased significantly in the Japanese population, which might contribute to stronger associations between relative income and depressive symptoms.
The findings are in line with previous studies reporting a positive association between relative deprivation (measured by Yitzhaki Index) or Income Rank, and depression or depressive symptoms in Taiwan (Kuo and Chiang, 2013), the UK (Hounkpatin et al., 2015), and the US (Eibner et al., 2004; Hounkpatin et al., 2015). Based on data from the English Longitudinal Study of Ageing (ELSA) and the Longitudinal Internet Studies for the Social Sciences (LISS), Hounkpatin et al. (2016) found that Income Rank was a stronger and more consistent predictor of self-rated and objective health (allostatic load) when compared with other measures, such as the Yitzhaki Index, using model fit statistics (BIC and AIC). In this study population, Income Rank was more strongly correlated with depressive symptoms in Models 1 to 3 than the Yitzhaki Index when judged by −2LogL and Akaike Information Criterion (AIC). However, no clear difference in model fit was apparent in the models stratified by equivalized household income quartiles (Model 4). Also, when both Yitzhaki Index and Income Rank were included in the same model (extended Model 3), only Income Rank remained statistically significant (although the results need to be interpreted with caution because of multi-collinearity).
In Japan, relative deprivation measured by the Yitzhaki Index was previously found to be associated with worse self-rated health in both men and women (Kondo et al., 2008), as well as with incident functional disability (Kondo et al., 2009) and cardiovascular disease mortality in men (Kondo et al., 2015). Reference groups based on the same prefecture of residence showed the strongest association with poor self-rated health (Kondo et al., 2008). In this study there were no significant differences in the magnitude of odds ratios based on different reference groups. In contrast, this study found that when area of residence was included in the reference group, women in the highest income quartile appeared to be most susceptible to the negative mental health effects of Income Rank. Among men the opposite was true, i.e., lower income men were more likely to be depressed as a result of lower rank.
In the lowest income quartile, it is difficult to separate the effects of psychosocial and material factors. In different regions of Japan, the same amount of money can “buy different rank” for individuals based on differences in the cost of living expenses as well as local variations in the normative standard of living. Therefore, higher rank might not only lead to a higher social standing, but also provides purchasing power to buy more and better goods. The equivalized household income range in the bottom quartile falls below the national poverty threshold (1.49 million Japanese yen), defined as less than half of the median annual equivalent income in the National Survey of Family Income and Expenditure (Saito et al., 2014). However, in Japan among relatively poor households not many live in absolute poverty. According to the Pew Research Center (2002), based on interviews conducted in 44 countries, 7.26% of the Japanese participants reported having had difficulties paying for food, medical and health care, or clothing during the previous year. In other developed countries such as Canada, France, Germany, Italy, the United Kingdom, and the United States this number was 20.80%, 15.58%, 12.30%, 18.70%, 22.75%, and 28.92%, respectively. Among the poorest, even a small increase in income could potentially lead to better access to material resources conductive to good health. However, apart from material factors, psychosocial factors might also play an important role in the effects of Income Rank in this quartile. As the community standard of living rises, even goods that were initially viewed as “luxuries” (e.g., air conditioning during summer; owning a smartphone) can eventually become “necessities”. Failing to obtain these “necessities” can in turn result in adverse (mental) health effects through feelings of frustration, failure, and exclusion, which might also be a possible explanation for the increased odds ratios for a change in Income Rank for depression among men (Kawachi and Kennedy, 1999b).
While men appear to be strongly affected by both material and psychosocial factors, women seem to be more sensitive to the effects of psychosocial factors. The reasons for this gender difference are not clear. The sensitivity of more affluent women to the effects of relative rank may reflect higher status consciousness in this group. During the past few decades Japanese women, particularly in the highest income quartile, have gained more purchasing power with an increasing monthly disposable income, becoming important targets for advertising, particularly for luxury goods (Morimoto and Chang, 2009; Taylor and Okazaki, 2015). Products and brands are often treated as status symbols or emblems of membership, which in Japanese society is strongly related to individual worth (Johansson, 1994). Constant striving to meet the culturally accepted symbols of the “good life” could result in negative emotions and lowered psychosocial wellbeing (Kawachi and Kennedy, 1999b).
Limitations
Some limitations need to be considered when interpreting these study findings. First, this study did not actually collect information on the comparison group of the study subjects. However, to address this lack of information, multiple reference groups were constructed following previous studies. Second, it is not known whether those who had a higher Yitzhaki Index or a lower Income Rank in fact perceived themselves as deprived compared to others. Recent research relating subjective relative deprivation (SRD) to poorer self-reported physical and mental health also showed low correlation between objective measures of deprivation and SRD (Mishra and Carleton, 2015). However, the health effects of a more objective relative deprivation measure such as the Yitzhaki Index have not been compared to the health effects of subjective deprivation in the same study. In the absence of data on SRD, Yitzhaki Index is a useful and widely accepted objective measure of relative deprivation. Also, with measuring relative deprivation objectively, the issue of common method bias resulting from the use of subjective predictor and self-reported outcome measures at the same time can be avoided. Third, the analysis was based on cross-sectional data, therefore the possibility of reverse causation cannot be excluded – i.e., depressive symptoms resulted in lower earnings, which in turn resulted in lower Income Rank and higher Yitzhaki Index value for relative deprivation.
Conclusions
In conclusion, the results indicate that both Yitzhaki Index and Income Rank were associated with depressive symptoms in older Japanese subjects. The problem of relative deprivation (as measured by the Yitzhaki Index) could be addressed by policies to reduce income inequality, such as via income transfers to reduce the gap between rich and poor. On the other hand, most income transfers will leave the Income Rank of individuals unaffected (since that would seem to violate norms of fairness). Thus, addressing the toxic health effects of Income Rank will require policies to reduce positional competition – perhaps by de-emphasizing the salience of consumer culture, redefining the basis of self-worth and social respect, or focusing on the value of social connections.
Supplementary Material
Acknowledgement
This study used data from the Japan Gerontological Evaluation Study (JAGES), which was supported by JSPS (Japan Society for the Promotion of Science) KAKENHI Grant Numbers (JP15H01972, JP25253052), Health Labour Sciences Research Grants (H28-Choju-Ippan-002, H29-Chikyukibo-Ippan-001), the Research and Development Grants for Longevity Science from Japan Agency for Medical Research and Development (AMED), Personal Health Record (PHR) Utilization Project from AMED, the Research Funding for Longevity Sciences from National Center for Geriatrics and Gerontology (29–42), and World Health Organization Centre for Health Development (WHO Kobe Centre) (WHO APW 2017/713981). We also received support from Harvard Catalyst | The Harvard Clinical and Translational Science Center (National Center for Research Resources and the National Center for Advancing Translational Sciences, National Institutes of Health Award UL1 TR001102) and financial contributions from Harvard University and its affiliated academic healthcare centers. The content is solely the responsibility of the authors and does not necessarily represent the official views of Harvard Catalyst, Harvard University and its affiliated academic healthcare centers, or the National Institutes of Health.
REFERENCES
- Adjaye-Gbewonyo K, Kawachi I, 2012. Use of the Yitzhaki Index as a test of relative deprivation for health outcomes: a review of recent literature. Soc Sci Med. 75, 129–137. doi: 10.1016/j.socscimed.2012.03.004. [DOI] [PubMed] [Google Scholar]
- Boyce CJ, Brown GDA, Moore S, 2010. Money and happiness: Rank of income, not income, affects life satisfaction. Psychol Sci. 21, 471–475. doi: 10.1177/0956797610362671. [DOI] [PubMed] [Google Scholar]
- Burke WJ, Roccaforte WH, Wengel SP, 1991. The Short Form of the Geriatric Depression Scale: A Comparison With the 30-Item Form. J Geriatr Psychiatry Neurol. 4, 173–178. doi: 10.1177/089198879100400310. [DOI] [PubMed] [Google Scholar]
- Daly M, Boyce C, Wood A, 2015. A social rank explanation of how money influences health. Health Psychol. 34, 222–230. doi: 10.1037/hea0000098. [DOI] [PMC free article] [PubMed] [Google Scholar]
- Eckersley R, 2015. Beyond inequality: acknowledging the complexity of social determinants of health. Soc. Sci. Med. 147, 121e125 10.1016/j.socscimed.2015.10.052. [DOI] [PubMed] [Google Scholar]
- Eibner C, Sturn R, Gresenz CR, 2004. Does relative deprivation predict the need for mental health services? J Ment Health Policy Econ. 7, 167–175. [PubMed] [Google Scholar]
- Hounkpatin HO, Wood AM, Brown GD, Dunn G, 2015. Why does Income Relate to Depressive Symptoms? Testing the Income Rank Hypothesis Longitudinally. Soc Indic Res. 124, 637–655. doi: 10.1007/s11205-014-0795-3. [DOI] [PMC free article] [PubMed] [Google Scholar]
- Hounkpatin HO, Wood AM, Dunn G, 2016. Does income relate to health due to psychosocial or material factors? Consistent support for the psychosocial hypothesis requires operationalization with income rank not the Yitzhaki Index. Soc Sci Med. 150, 76–84. doi: 10.1016/j.socscimed.2015.12.008. [DOI] [PubMed] [Google Scholar]
- Ishida A, 2011. A Quantitative Model of Relative Deprivation and Reference Group: An Application of Yitzhaki’s Individual Relative Deprivation Index. Sociological Theory Methods 26, 371–388. doi: 10.11218/ojjams.26.371. [DOI] [Google Scholar]
- Johansson JK, 1994. The Sense of “Nonsense”: Japanese TV Advertising. Journal of Advertising 23, 17–26. doi: 10.1080/00913367.1994.10673428. [DOI] [Google Scholar]
- Kawachi I, Kennedy BP, Wilkinson RG, 1999a. Crime: social disorganization and relative deprivation. Soc Sci Med. 48, 719–731. [DOI] [PubMed] [Google Scholar]
- Kawachi I, Kennedy BP, 1999b. Income inequality and health: pathways and mechanisms. Health Serv Res. 34, 215–227. [PMC free article] [PubMed] [Google Scholar]
- Kawachi I, Subramanian SV, Almeida-Filho N, 2002. A glossary for health inequalities. J Epidemiol Community Health 56, 647–652. doi: 10.1136/jech.56.9.647. [DOI] [PMC free article] [PubMed] [Google Scholar]
- Kelly WW, 2002. At the limits of New Middle Class Japan: Beyond “mainstream consciousness”, in: Zunz O, Schoppa L, Hiwatari N (Eds.), Social Contracts Under Stress: The Middle Classes of America, Europe, and Japan at the Turn of the Century. Russell Sage Foundation, New York, pp. 232–254. [Google Scholar]
- Kondo N, Kawachi I, Subramanian SV, Takeda Y, Yamagata Z, 2008. Do social comparisons explain the association between income inequality and health?: Relative deprivation and perceived health among male and female Japanese individuals. Soc Sci Med. 67, 982–987. doi: 10.1016/j.socscimed.2008.06.002. [DOI] [PMC free article] [PubMed] [Google Scholar]
- Kondo N, Kawachi I, Hirai H, Kondo K, Subramanian SV, Hanibuchi T, Yamagata Z, 2009. Relative deprivation and incident functional disability among older Japanese women and men: prospective cohort study. J Epidemiol Community Health 63, 461–467. doi: 10.1136/jech.2008.078642. [DOI] [PMC free article] [PubMed] [Google Scholar]
- Kondo N, Saito M, Hikichi H, Aida J, Ojima T, Kondo K, Kawachi I, 2015. Relative deprivation in income and mortality by leading causes among older Japanese men and women: AGES cohort study. J Epidemiol Community Health 69, 680–685. doi: 10.1136/jech-2014-205103. [DOI] [PMC free article] [PubMed] [Google Scholar]
- Koyano W, Shibata H, Nakazato K, Haga H, Suyama Y, 1991. Measurement of competence: reliability and validity of the TMIG Index of Competence. Arch Gerontol Geriatr. 13, 103–116. [DOI] [PubMed] [Google Scholar]
- Kuo CT, Chiang TL, 2013. The association between relative deprivation and self-rated health, depressive symptoms, and smoking behavior in Taiwan. Soc Sci Med. 89, 39–44. doi: 10.1016/j.socscimed.2013.04.015. [DOI] [PubMed] [Google Scholar]
- Lyness JM, Noel TK, Cox C, King DA, Conwell Y, Caine ED, 1997. Screening for depression in elderly primary care patients. A comparison of the center for epidemiologic studies-depression scale and the geriatric depression scale. Arch. Intern Med. 157, 449–454. [PubMed] [Google Scholar]
- Marmot M, Wilkinson RG, 2001. Psychosocial and material pathways in the relation between income and health: a response to Lynch et al. BMJ 322, 1233–1236. [DOI] [PMC free article] [PubMed] [Google Scholar]
- McEwen BS, Seeman T, 1999. Protective and damaging effects of mediators of stress. Elaborating and testing the concepts of allostasis and allostatic load. Ann N Y Acad Sci. 896, 30–47. doi: 10.1111/j.1749-6632.1999.tb08103.x. [DOI] [PubMed] [Google Scholar]
- Mendelson T, Thurston RC, Kubzansky LD, 2008. Affective and cardiovascular effects of experimentally-induced social status. Health Psychol. 27, 482–489. doi: 10.1037/0278-6133.27.4.482. [DOI] [PubMed] [Google Scholar]
- Mishra S, Carleton RN, (2015). Subjective relative deprivation is associated with poorer physical and mental health. Soc. Sci. & Med. 147, 144–149. doi: 10.1016/j.socscimed.2015.10.030. [DOI] [PubMed] [Google Scholar]
- Morimoto M, Chang S, 2009. Western and Asian Models in Japanese Fashion Magazine Ads: The Relationship With Brand Origins and International Versus Domestic Magazines. Journal of International Consumer Marketing 21, 173–187. doi: 10.1080/08961530802202701. [DOI] [Google Scholar]
- Parker RN, Fenwick R, 1983. The Pareto Curve and Its Utility for Open-Ended Income Distributions in Survey Research. Social Forces 61, 872–885. doi: 10.2307/2578140. [DOI] [Google Scholar]
- Pew Research Center USA, 2004. Summer 2002 Survey Data. http://www.pewglobal.org/2002/10/31/summer-2002-survey-data/ (accessed November 4, 2016)
- Runciman WG, 1966. Relative deprivation and social justice. Routledge, London. [Google Scholar]
- Saito M, Kondo K, Kondo N, Abe A, Ojima T, Suzuki K, JAGES group, 2014. Relative deprivation, poverty, and subjective health: JAGES cross-sectional study. PLoS One 9, e111169. doi: 10.1371/journal.pone.0111169. [DOI] [PMC free article] [PubMed] [Google Scholar]
- Sapolsky RM, 2005. The influence of social hierarchy on primate health. Science 308, 648–652. doi: 10.1126/science.1106477. [DOI] [PubMed] [Google Scholar]
- Schreiner AS, Hayakawa H, Morimoto T, Kakuma T, 2003. Screening for late life depression: cut-off scores for the Geriatric Depression Scale and the Cornell Scale for Depression in Dementia among Japanese subjects. Int J Geriatr Psychiatry 18, 498–505. doi: 10.1002/gps.880. [DOI] [PubMed] [Google Scholar]
- Subramanyam M, Kawachi I, Berkman L, Subramanian SV, 2009. Relative deprivation in income and self-rated health in the United States. Soc Sci Med. 69, 327–334. doi: 10.1016/j.socscimed.2009.06.008. [DOI] [PubMed] [Google Scholar]
- Taylor CR, Okazaki S, 2015. Do Global Brands Use Similar Executional Styles Across Cultures? A Comparison of U.S. and Japanese Television Advertising. Journal of Advertising 44, 276–288. doi: 10.1080/00913367.2014.996306. [DOI] [Google Scholar]
- Wada T, Ishine M, Kita T, Fujisawa M, Matsubayashi K, 2003. Depression screening of elderly community-dwelling Japanese. J Am Geriatr Soc. 51, 1328–1329. [DOI] [PubMed] [Google Scholar]
- Wetherall K, Daly M, Robb KA, Wood AM, O’Connor RC, 2015. Explaining the income and suicidality relationship: income rank is more strongly associated with suicidal thoughts and attempts than income. Soc Psychiatry Psychiatr Epidemiol. 50, 929–937. doi: 10.1007/s00127-015-1050-1. [DOI] [PubMed] [Google Scholar]
- Wilkinson RG, 1996. Unhealthy societies – The afflictions of inequality. Routledge, London. [Google Scholar]
- Wilkinson RG, 1997. Socioeconomic determinants of health. Health inequalities: relative or absolute material standards? BMJ 314, 591–595. [DOI] [PMC free article] [PubMed] [Google Scholar]
- Wood AM, Boyce CJ, Moore SC, Brown GD, 2012. An evolutionary based social rank explanation of why low income predicts mental distress: A 17 year cohort study of 30,000 people. J Affect Disord. 136, 882–888. doi: 10.1016/j.jad.2011.09.014. [DOI] [PubMed] [Google Scholar]
- Yitzhaki S, 1979. Relative deprivation and the Gini coefficient. QJE. 93, 321–24. [Google Scholar]
Associated Data
This section collects any data citations, data availability statements, or supplementary materials included in this article.