Abstract
Purpose
The increasing prevalence of obesity/metabolic syndrome (O/MS) and diabetes mellitus (DM) remains a global health concern. Clinically relevant and practical translational models mimicking human characteristics of these conditions are lacking. This study aimed to demonstrate proof of concept of the induction of stable obesity/metabolic syndrome (O/MS) and type-2 diabetes mellitus (DM) in a Göttingen minipig model and validate both of these disease-adjusted Göttingen mini-pig models as impaired healing models for the testing of dental implants.
Materials and Methods
9 minipigs were split into 3 groups: control (normal diet), obese (cafeteria diet) and diabetic (cafeteria diet + Streptozotocin), and followed by placement of dental implants. Inflammatory markers including TNF-α, C-reactive protein, and cortisol were recorded for each study group. Removal torque and histomorphometric analysis (bone to implant contact (BIC) and bone area fraction occupancy (BAFO)) were performed.
Results
O/MS pigs showed, on average, a 2-fold increase in plasma C-reactive protein (p<0.05) and cortisol (p<0.09) concentrations compared to controls; DM pigs showed, on average, a 40-fold increase in plasma TNF-α (p<0.05) and a 2-fold increase in cortisol (p<0.05) concentrations compared to controls. The impact of O/MS and DM on implants was determined. Torque to interface failure was highest in control (200 Ncm), and significantly lower in O/MS (90 Ncm) and DM (60 Ncm) groups (p<0.01). Bone formation around implants was significantly greater in control than O/MS and DM (p<0.02).
Conclusions
Both O/MS and DM minipigs express human-like disease phenotype and both presented bone healing impairment around dental implants. No significant difference between type-2 diabetes and obesity/metabolic syndrome on bone formation around implants provides evidence that further investigation of the impact of obesity/metabolic syndrome is warranted.
1. Introduction
Nearly 40 and 10% of the global population suffers from obesity and diabetes, respectively, with a projected 20–30% increase in diabetes prevalence by 2050 1–3. Among the many consequences of these diseases, poor wound healing remains a primary concern to oral health practitioners. These patients carry an increased risk of alveolar bone loss 4 and periodontal diseases 5. While it is recognized that diabetes negatively impacts implant treatment, less is known about the impact of obesity and metabolic syndrome 6. Current understanding of bone pathology in obesity/metabolic syndrome (O/MS) and its progression to type 2 diabetes mellitus (DM) is limited to studies suggesting that adipose-derived pro-inflammatory cytokines may be responsible for the degeneration of oral health in these populations 7. Thus, studies investigating the metabolic effects on dentition are warranted, given the paucity of clinically relevant and translational O/MS and DM animal models for studying disease effect on dental implants.
Swine are increasingly the preferred alternative to dogs or non-human primates for nonrodent biomedical and food research 8, 9. Similarities to humans permit a close replication of complex pathophysiology, with recent developments in obese and diabetic swine models demonstrating similar complications to their human counterparts, including hyperglycemia, hyperlipidemia, hypertension, insulin resistance, a pro-inflammatory state 10–12, delayed wound healing 13, and reduced bone mineralization 14. The reproducibility of these complications, which are known to challenge the long-term success of dental implants in humans, makes the obese/diabetic pig particularly useful for preclinical studies on dental surgery and periodontitis 15. Swine models also allow for the assessment of implants used in humans, and thereby yield relevant translational data. However, adult obese swine are difficult to handle due to their size (reaching 300 – 400 kg body weight) and do not express an extreme obese phenotype, thereby citing a need for a more manageable model.
Göttingen minipig models have been successfully used in oral surgery translational research. Metabolic syndrome Göttingen minipig models have already been developed through a high energy feeding diet for short periods of up to 3 months 16, 17. Minipigs can achieve body mass index levels characteristic of O/MS while maintaining a far more manageable adult body weight that rarely exceeds 80–90 kg. A type 2 diabetes-like state has also been induced in obese Göttingen minipigs by low dosage administration of streptozotocin 17, 18, demonstrating the potential to study the progression of obesity to diabetes, closely resembling human metabolic compromise. To date, studies have not reported stable pathological changes to the Göttingen minipig in long-term models 16–18. In this pilot study we aimed to: 1) demonstrate proof of concept of the induction of stable, obesity/metabolic syndrome (O/MS) and type-2 diabetes mellitus (DM) in a Göttingen minipig model and 2) validate both of these disease-adjusted Göttingen mini-pig models as impaired healing models for the testing of dental implant osseointegration.
2. Materials and Methods
2.1 Establishment/Maintenance of obese/metabolic syndrome and diabetic minipig models
Animal selection, surgery protocol and study management were approved by the Animal Care and Use Committee and followed ARRIVE guidelines 19. A total of 9 female Göttingen minipigs (Ellegaard, Dalmose, Denmark) 18 months of age were used for this study. Minipigs were split into 3 groups: (1) control (normal diet) (n=3), (2) obese (cafeteria diet) (n=3) and (3) diabetic (cafeteria diet + Streptozotocin) (n=3). Normal diet was characterized as being low in fat Standard Diet (SDS Standard Diet Service, UK# 801586), while a diet high in saturated and hydrogenated fats/cholesterol/sugar was defined as “cafeteria” diet by RDS Cafeteria Diet (Research Diet Services NL) (obese/metabolic syndrome and diabetic groups). The total weight of raw material between the two diets were equivalent20 (Table 1). Animals were fed twice a day. Diet progression was split into 3 phases: conversion, growth, and maintenance phases. To induce O/MS, minipigs (n = 6; O/MS and DM groups) were gradually introduced to the cafeteria diet over a period of 4 weeks (conversion phase, 25% decrease in normal diet on a weekly basis and restricted feeding to two 500g meals per day), after which time they remained at 100% cafeteria diet for 8 months and were allowed to feed ad libitum (growth phase). Once O/MS and DM animals approximately doubled their original weight, the cafeteria diet was then halved and combined with control diet (maintenance phase). Control animals were fed the control diet. Minipigs assigned to the DM group (n = 3) were induced by slow injection of filter-sterilized streptozotocin solution (STZ, Enzo Life Sciences, Raamsdonksveer, the Netherlands) (20 mg/kg in 0.1 mol/L Na-citrate, pH 4.5) on two consecutive days after overnight fasting18. STZ-injected swine were given 25g glucose to offset insulin release from dying β-cells, thereby preventing hypoglycemia.
Table 1.
Basic formulation of the control and cafeteria diets
| Raw Material | Control diet | Cafeteria diet |
|---|---|---|
| Soya beans, extracted (cf<50g/kg) | 164.5 | |
| Potato protein (ash<10g/kg) | 50 | 50 |
| Wheat gluten meal | 8.7 | 106 |
| Barley | 396.2 | |
| Wheat | 500 | |
| Porcine fat (lard) | 100 | |
| Hydrogenated soya bean oil | 100 | |
| Hydrogenated coconut oil | 50 | |
| Soy bean oil | 17.3 | |
| Fructose | 200 | |
| Sucrose | 200 | |
| Limestone | 13 | 9.6 |
| Mono calcium phosphate | 6.9 | 10.8 |
| NaCl | 4 | 4.7 |
| Mineral/vitamin.Premix | 2 | 2 |
| L-lysine HCl | 1.9 | 2.4 |
| Cholesterol (extra) | 10 | |
| Total (g/kg) | 1000 | 1010 |
| Gross energy (GE; MJ/kg) | 17.3 | 23.5 |
The following criteria were used to characterize and validate the induction of O/MS and DM in this study: animal weight, blood analysis including glucose, ketones, tumor necrosis factor-alpha (TNF-α), C-reactive protein (CRP), plasma cortisol, plasma insulin levels, and pancreatic histology. Animal weight was measured at animal reception, 8 weeks, 14 weeks and subsequently every 2 weeks for the remainder of the study. Additionally, at time of euthanasia, internal organs were independently weighed (wet weight) including the heart (right and left ventricles independently), liver, spleen, and kidneys. The pathophysiology associated with metabolic syndrome in humans and swine models are presented in Table 2. 21–36
Table 2.
Pathophysiology related to Metabolic Syndrome.
| Weight/ Abdominal circunference |
Glucose | Ketones | TNF- α |
CRP | Plasma cortisol |
Plasma insulin levels |
Pancreatic histology |
Wet weight organs |
||
|---|---|---|---|---|---|---|---|---|---|---|
| Göttingen Minipig | Current study | + | + | + | + | + | + | + | + | + |
| Humans | Mantizoros, 200621 | + | + | N/A | + | + | N/A | + | N/A | N/A |
| Ervin, 2009 22 | + | + | N/A | N/A | N/A | N/A | N/A | N/A | N/A | |
| Yang et al., 2014 23 | + | + | N/A | N/A | N/A | N/A | N/A | N/A | N/A | |
| Aguilar et al., 2015 24 | + | + | N/A | N/A | N/A | N/A | N/A | N/A | N/A | |
| Aronson et al., 2005 25 | + | + | N/A | N/A | + | N/A | N/A | N/A | N/A | |
| Raffaitin et al., 2009 26 | + | + | N/A | N/A | N/A | N/A | N/A | N/A | N/A | |
| Birdsill et al., 2013 27 | + | + | N/A | N/A | N/A | N/A | N/A | N/A | N/A | |
| Hanson et al., 2002 28 | + | + | N/A | N/A | N/A | N/A | + | N/A | N/A | |
| Lind, 2008 29 | + | + | N/A | N/A | N/A | N/A | N/A | N/A | N/A | |
| Göttingen Minipig | Pedersen et al., 2013 30 | + | + | N/A | N/A | N/A | N/A | + | N/A | N/A |
| Johansen et al., 2001 16 | + | + | N/A | N/A | N/A | N/A | + | N/A | + | |
| Christoffersen et al., 2007 31 | + | + | N/A | N/A | N/A | N/A | + | N/A | N/A | |
| Christoffersen et al., 2013 32 | + | + | N/A | N/A | N/A | N/A | N/A | N/A | N/A | |
| Swines | Huang et al., 2013 33 | + | + | N/A | N/A | N/A | N/A | + | N/A | + |
| Phillips-Eakley et al., 2015 34 | + | + | N/A | N/A | N/A | N/A | N/A | N/A | N/A | |
| Westover et al., 2016 35 | + | + | N/A | N/A | N/A | N/A | N/A | N/A | N/A | |
| Bratz et al., 2008 36 | + | + | N/A | N/A | N/A | N/A | + | N/A | + |
+ - Available
N/A – Not available
Fasting plasma glucose and ketone levels were monitored weekly using Glucomen LX (A. Menarini Diagnostics, Germany). Plasma TNF-α, c-reactive protein (CRP), insulin and cortisol levels were tested at the time of implantation and termination (late maintenance phase weeks 43 and 47, respectively) through commercially available kits: TNF-α (Invitrogen Elisa Kit for Swine TNF-α Assay, Invitrogen Corporation, USA), CRP (Porcine C-reactive Protein Assay, Tridelta Development Ltd, Ireland), cortisol (Radioimmunoassay Coat-a-count cortisol, Siemens Healthcare Diagnostics Inc., CA, USA), and insulin (Porcine Insulin ELISA kit, Mercodia AB, Uppsala, Sweden).
To determine the amount of insulin-producing cells, tissues were immersion-fixed in 4% buffered formaldehyde processed for paraffin embedding. Immunohistochemistry was performed using a polyclonal guinea-pig anti-swine insulin antibody (DAKO, Glostrup, Denmark), with diaminobenzidine/H2O2 as a chromogen to visualize the horseradish peroxidase-labeled secondary (rabbit anti-guinea-pig) antibody. The insulin stain was quantified by determining the total surface of insulin-producing cells as a percentage of the total area in that section.
2.2 Dental Implant Surgical Placement and Implant Analyses
Surgeries were performed following previously described methodology37. At the initiation of the study, and prior to O/MS and DM induction, mandibular premolars and first molars (P1, P2, P3 and M1) were extracted. Healing was allowed for 3 months prior to metabolic disease induction. After induction and stabilization of O/MS and DM conditions, custom designed 4.2 × 6 mm implants were placed bilaterally (2 per side) and allowed a 4-week implant healing period prior to euthanasia.
After euthanasia, the right mandibular implants were subjected to removal torque in counterclockwise rotation to the implant axis at a rate of 0.1 degree/second and maximum torque was recorded as previously described 38. The left mandibular implants underwent non-decalcified histologic processing as previously described 39. Photographs were taken from all samples at 200X. Each histologic section was assessed for bone-to-implant contact (BIC) and bone area fraction occupancy (BAFO) within the implant healing chambers as previously described 40.
2.3 Statistical Analysis
Results are expressed as means ± SD and the criterion of statistical significance was set at p < 0.05. All of the data (except biomechanical and histomorphometric) were subjected to the analysis of variance procedure (ANOVA) followed by the student’s t-test of Genstat 5 (Payne RW, Lane PW, Ainsley AE: Genstat 5 Reference Manual Oxford, UK: Oxford University Press; 1987) for determination of differences between the three pig groups. A linear mixed model was utilized to evaluate biomechanical and histomorphometric data.
3. Results
Animal and Organ Weights
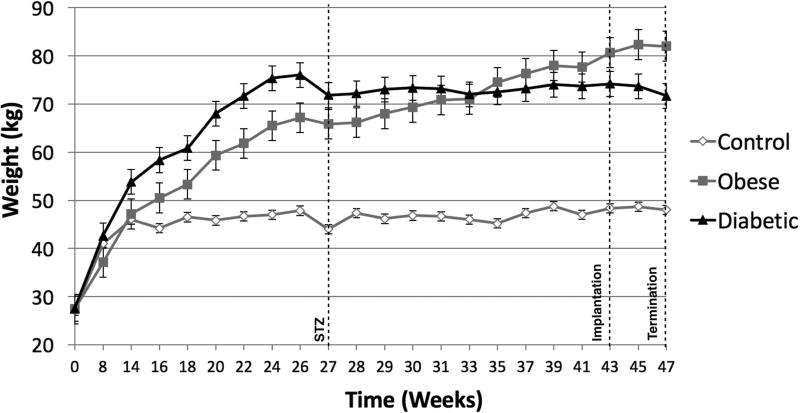
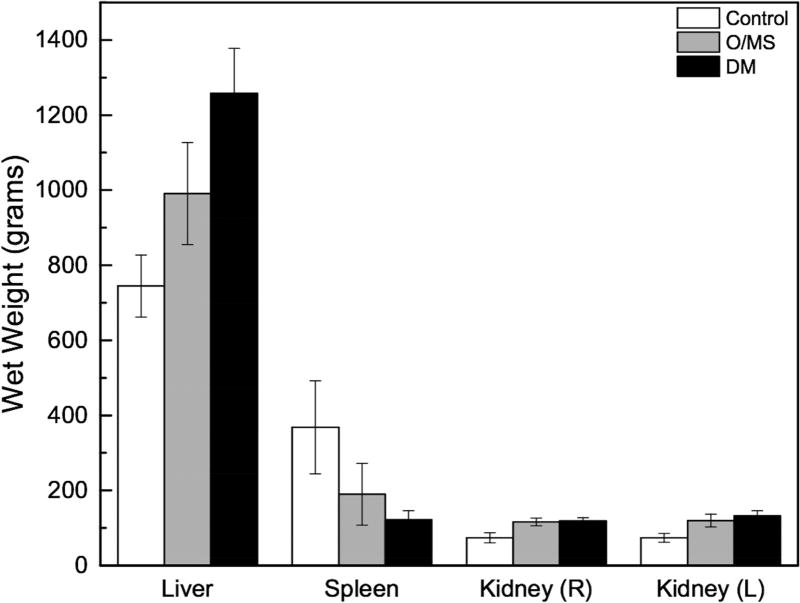
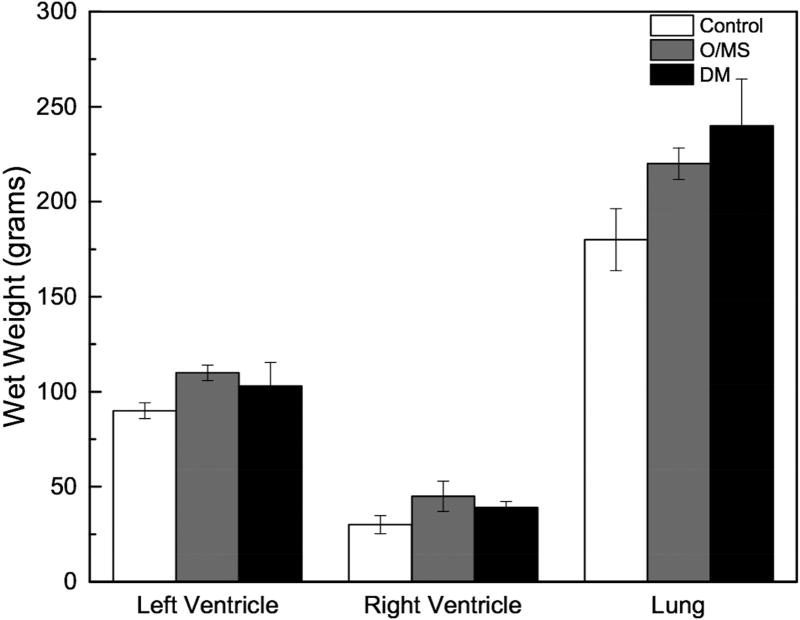
At initiation of the study, Göttingen minipigs presented with an average weight of 28kg. Upon initiation of respective diets the control animals continued to grow for about 14 weeks when weight plateaued at ~45 kg. Weights of both groups of pigs receiving the cafeteria diet (DM and O/MS) increased over time to ~73 and ~83kg at termination, respectively (Figure 1A). Macroscopically, necropsy revealed excessive fatty deposits surrounding the internal organs, with particularly thick deposits around the heart and subcutaneous tissue. Organ wet weights showed that O/MS group with heavier left ventricle and right ventricle relative to control and DM groups (Figure 1B). The DM group presented higher lung, liver, and kidney weights compared to O/MS and control groups (Figures 1B and 1C). Spleen weights decreased from control to O/MS to DM (Figure 1C).
Figure 1. Progressive weight gain in Göttingen minipigs and critical organ wet weights.
A) Gross weight of control, O/MS, and DM pigs throughout the experiment demonstrating rapid weight gain for animals receiving the cafeteria diet (O/MS and DM) in the first phase, followed by weight stabilization in DM group and slower increase in O/MS group. STZ indicates the time of Streptozotocin administration. Time represents weeks after dental extraction. B) Average Heart (left and right ventricles weighed separately) and lung weights at 47 weeks (sacrifice) demonstrating higher average weights for critically affected organs in O/MS and DM animals. C) Average weights of liver, spleen, and left and right kidneys of each group at time of sacrifice.
Blood Assays
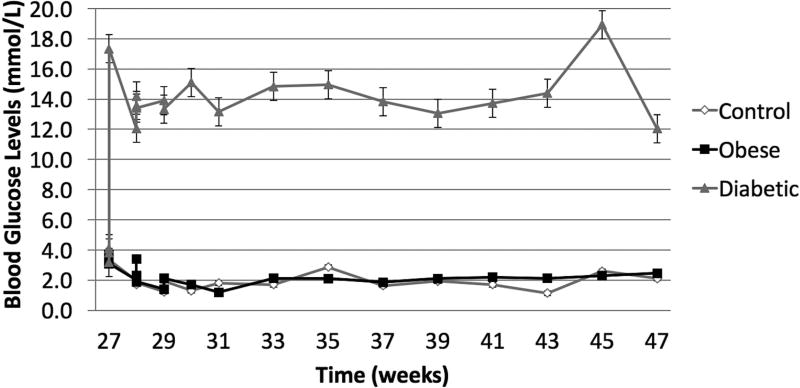
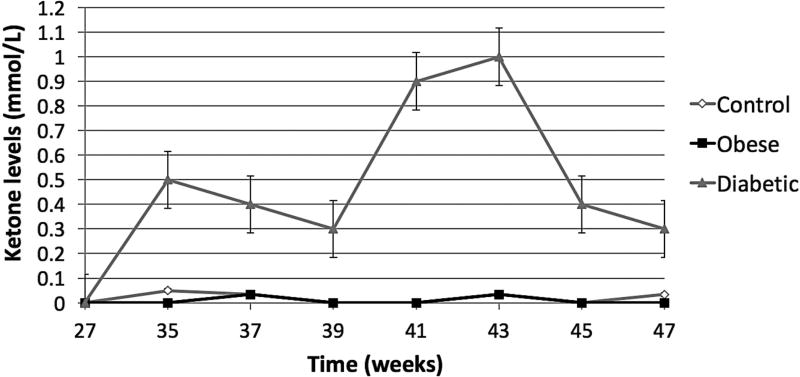
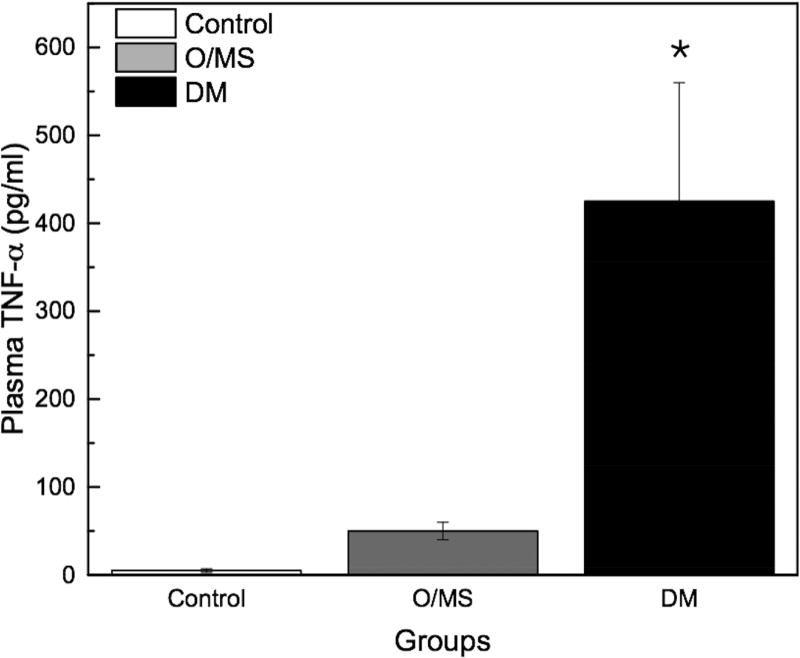
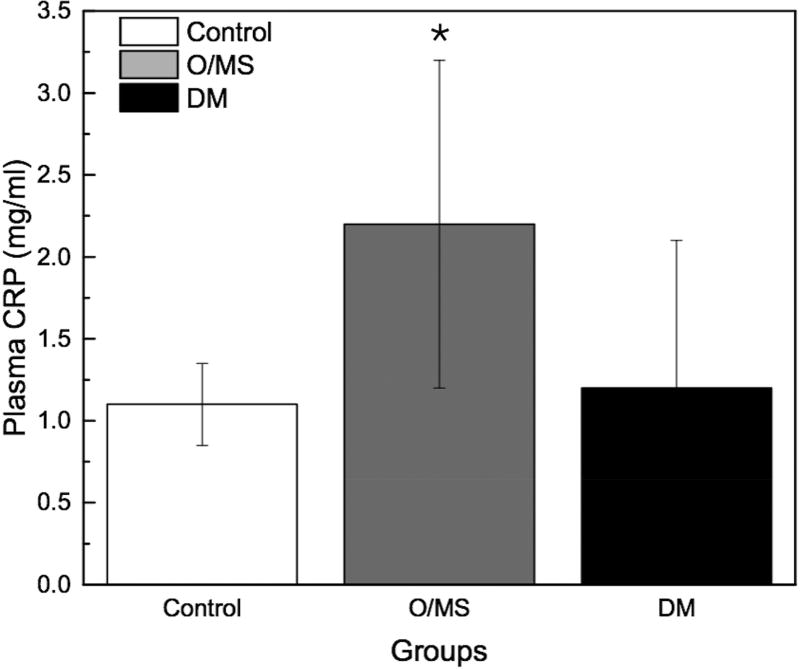
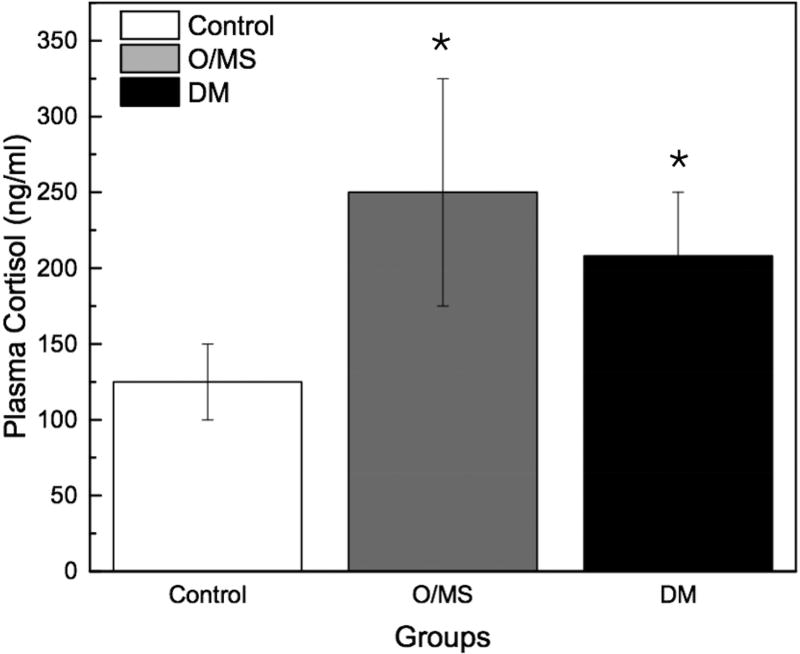
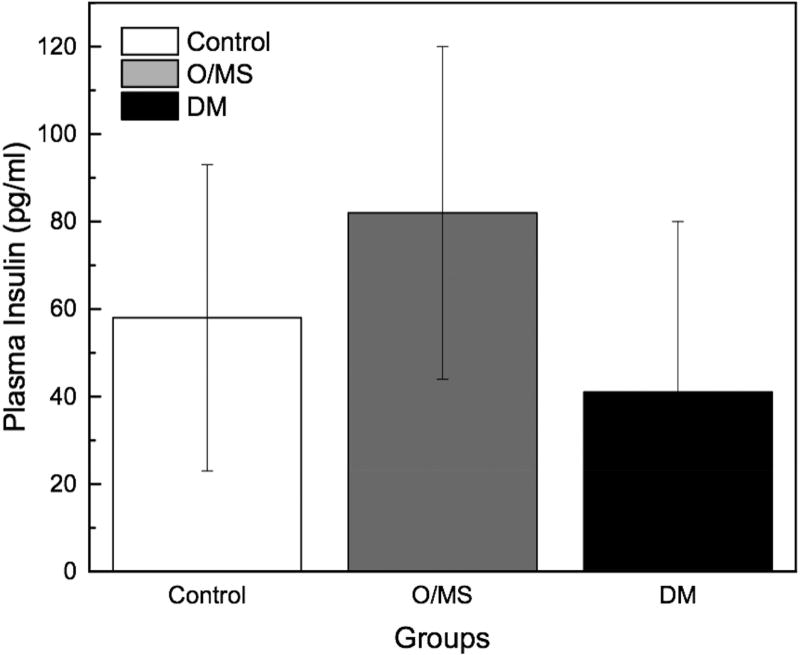
Following STZ administration, the DM group presented average blood glucose levels 5-times greater (~12 mmol/L) than the O/MS and control groups (average of 3 mmol/L). These values remained relatively constant throughout the experiment (Figure 2A). Ketone levels similarly demonstrated an increase in the DM group after STZ administration at an average of 0.5 mmol/L, with fluctuation, while the control and O/MS groups presented close to undetectable levels (Figure 2B). TNF-α plasma levels were significantly higher in the DM group (p<0.05) compared to both control and O/MS groups (Figure 2C). Plasma CRP levels were greatest in the O/MS group, compared to controls, values that were significant (p<0.05) at the time of animal sacrifice (O/MS: 3.1±0.6 mg/L, control: 1.0±0.2 mg/L) (Figure 2D). The average plasma cortisol levels at implantation were not statistically different between groups. However the levels were significantly (p<0.05) increased for the DM group compared to the control group at euthanasia. The O/MS group showed a tendency (p<0.09) towards increased cortisol levels compared to controls (Figure 2E). Plasma insulin levels were slightly greater in the O/MS group, but were not significantly different among groups at implantation or termination (Figure 2F).
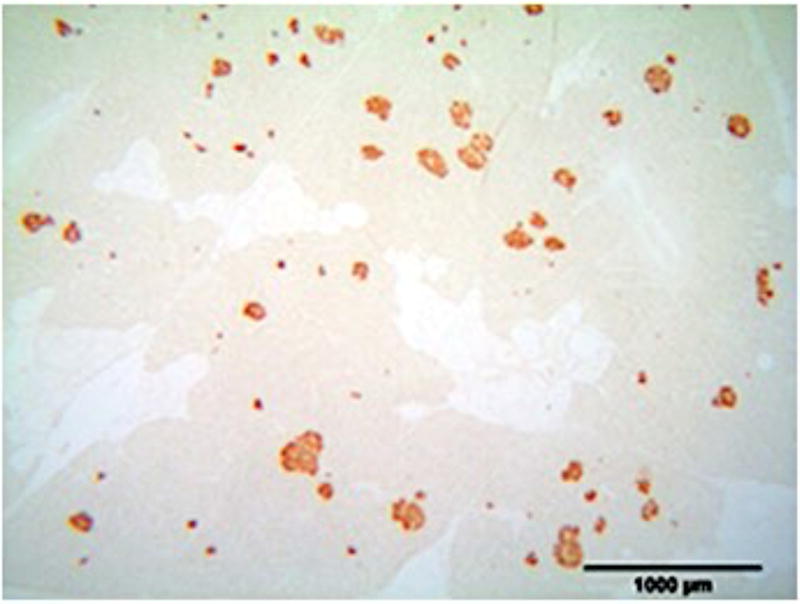
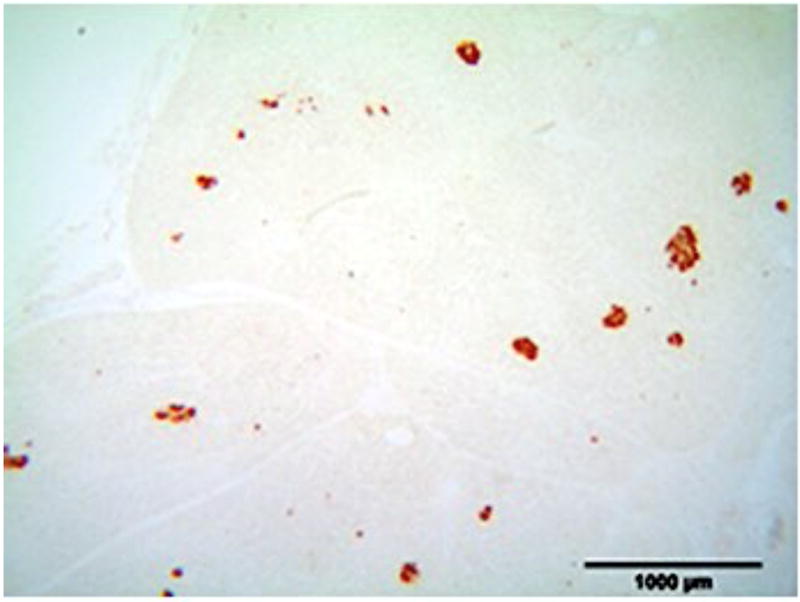
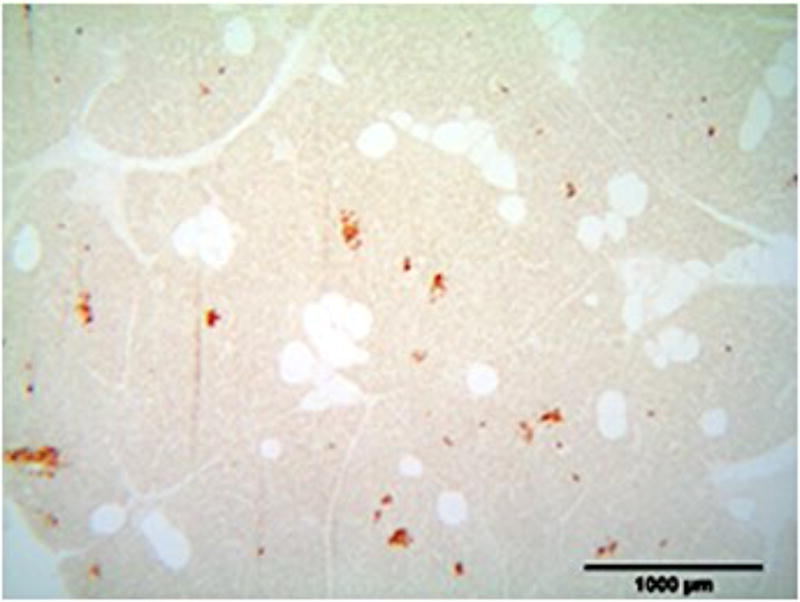
Figure 2. Blood marker profiles demonstrate effective induction of metabolic syndrome and a DM phenotype.
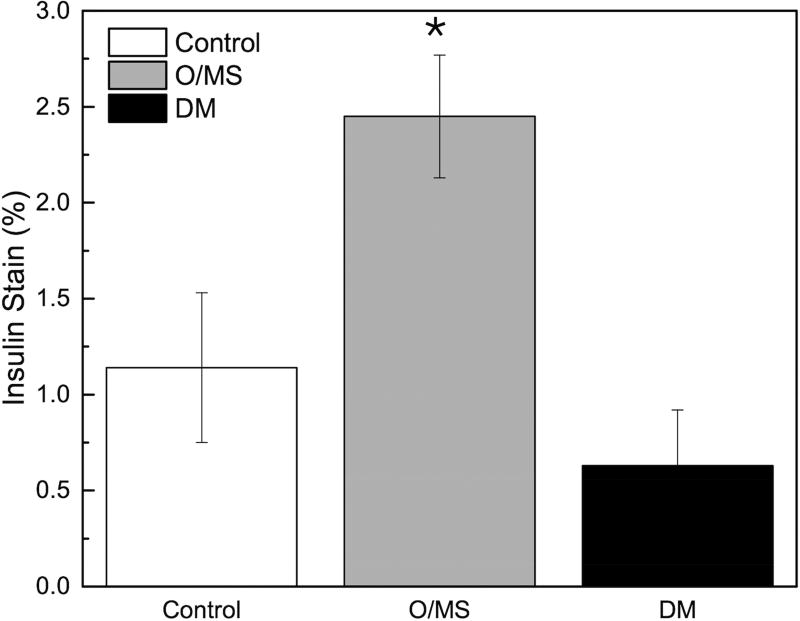
A) Blood glucose levels following STZ administration. Glucose levels are particularly elevated in DM animals while O/MS animal levels are comparable to control. B) Blood ketone levels are elevated in the DM group. Obese and control groups remain at basal levels. C–F) Average plasma levels of Tumor necrosis factor-α (TNF-α), Creactive protein (CRP), Cortisol and Insulin taken at the time of implantation and termination. Overall pro-inflammatory status is evident in the O/MS and DM groups. G–J) Immunohistochemical staining and quantification of insulin on pancreatic tissue sections demonstrate significantly increased staining in (H) O/MS pigs compared to (G) controls and (I) DM, however no (J) statistical differences was detected between controls and DM. The number of asterisks denotes statistically homogeneous groups.
Pancreatic Insulin Stain
Quantitative immunohistochemical staining demonstrated that O/MS pigs had a significantly higher levels of insulin staining compared to control and DM animals (p<0.02). Insulin staining was not significantly different between the DM and control groups (p>0.15) (Figures 2G–J).
Biomechanical Testing and Histomorphometric Analysis
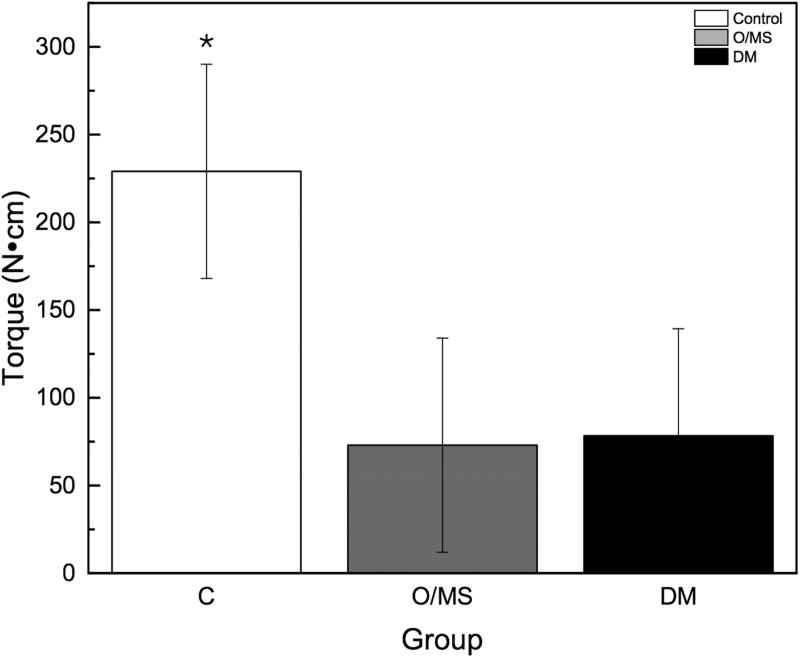
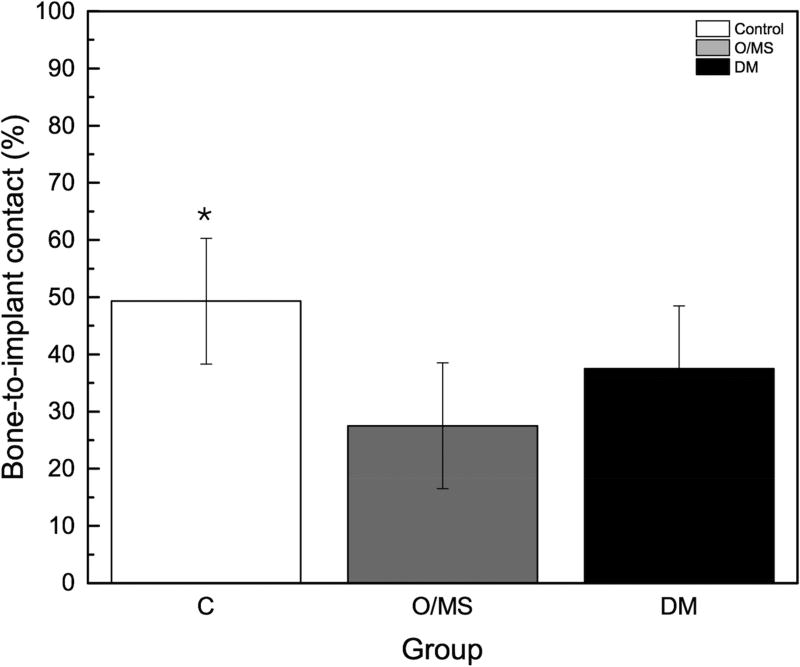
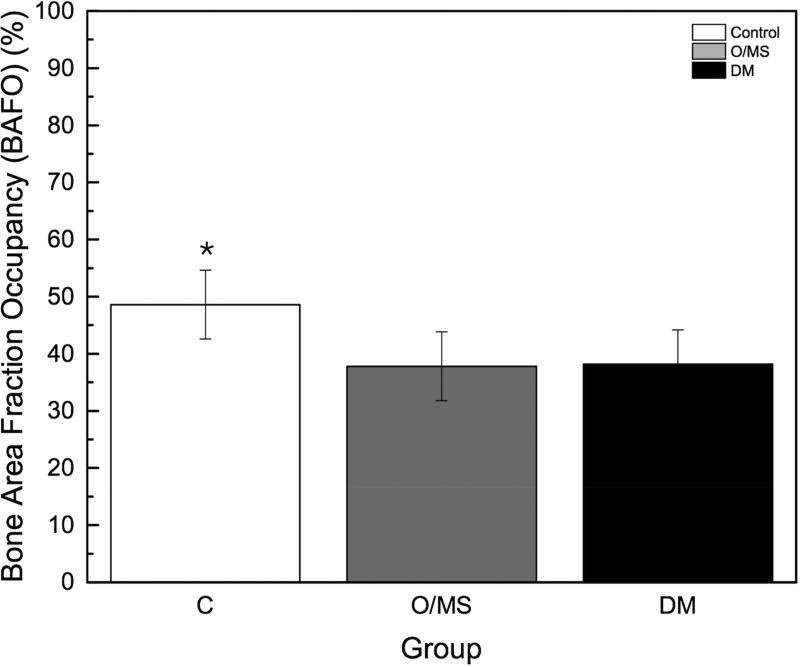
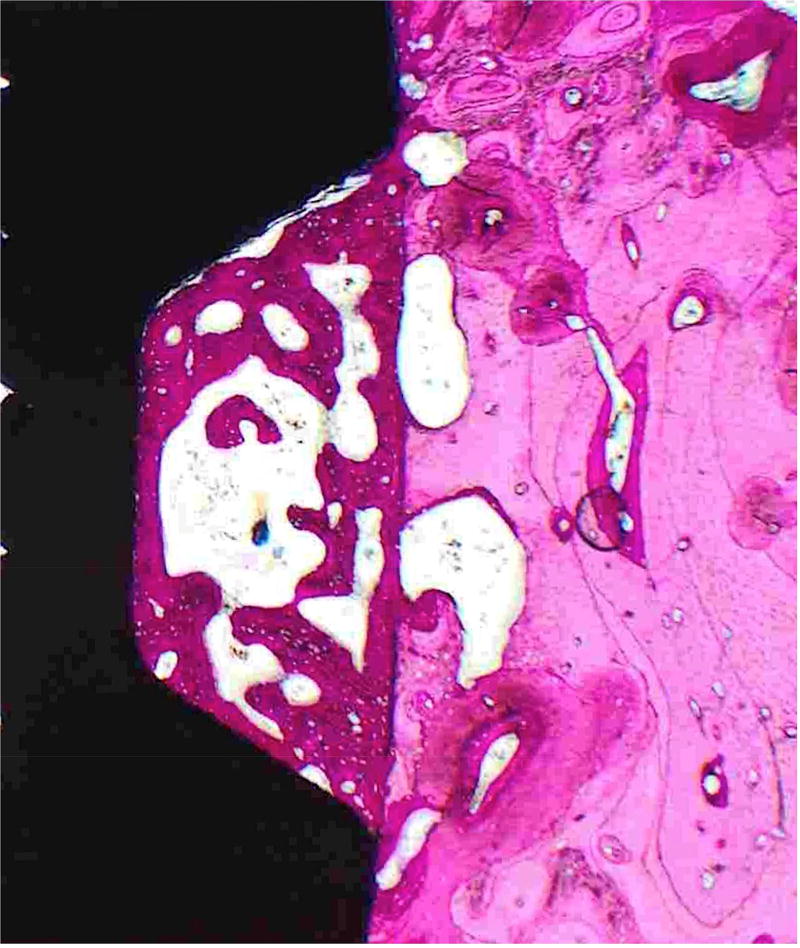
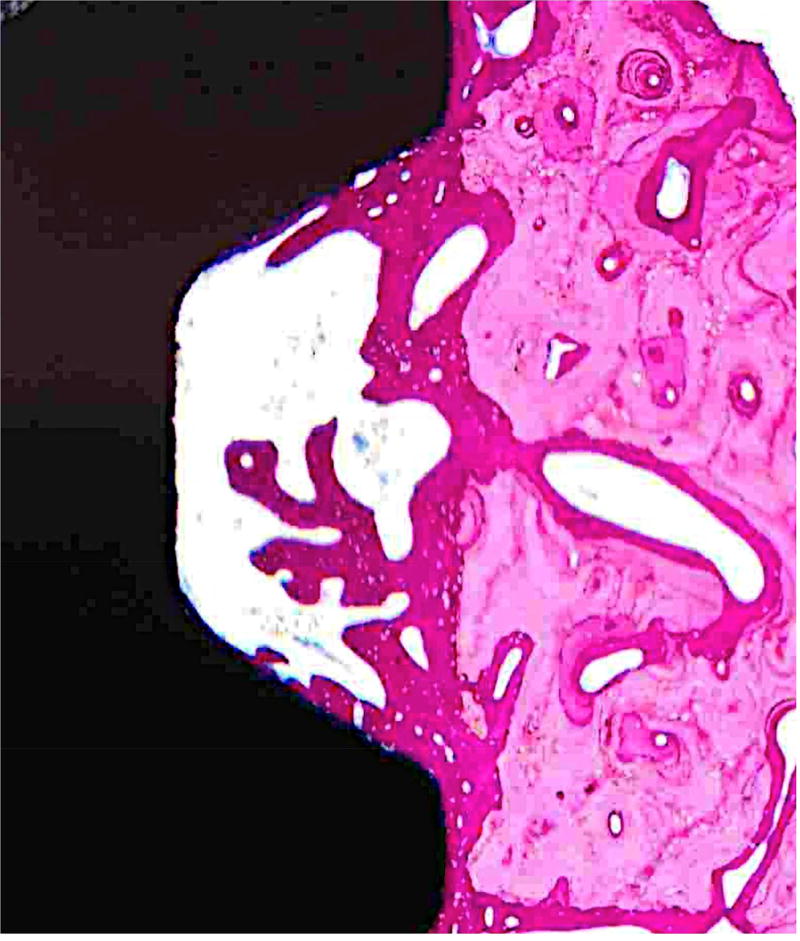
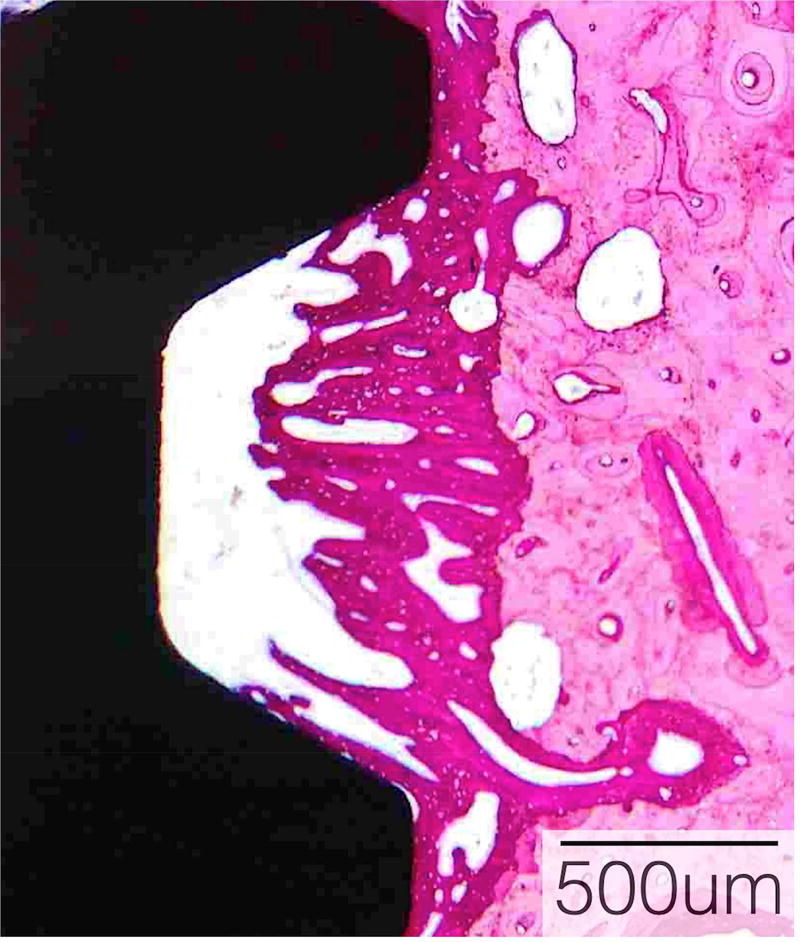
The torque to interfacial failure was significantly (p<0.001) decreased in the O/MS group and the DM group compared to controls (Figure 3A). Qualitative histologic examination demonstrated increased amounts of bone growth around implants placed in control group animals compared to metabolically compromised groups (Figures 4A–C). No bone morphologic difference between groups was evident. Histomorphometric analysis showed that the control group exhibited significantly higher values of BIC (bone-to-implant contact) compared to O/MS (p<0.01) and DM (P<0.001) (Figure 3B). Similarly, the control group exhibited significantly higher values (p<0.02) of BAFO (bone area fraction occupancy) measurements compared to metabolic disease groups (Figure 3C). There was no significant difference between the O/MS and DM groups in both BIC and BAFO measurements.
Figure 3. Biomechanical and histomorphometric measurements.
A) Maximum torque-out values for implants at time of sacrifice. Lower torque-out vales demonstrate that the osseointegration of implants in O/MS and DM animals is significantly less than in the control group. There are no significant differences between O/MS and DM groups. B) Histomorphometric analysis of tissue/implant sections. BAFO corresponds to the new bone area per total area within a defined region of interest (ROI), here defined as the total area from the defect border to the implant surface. BIC corresponds to the total bone to implant contact and is expressed as a percentage of the bone physically attached to the implant surface as compared to the total implant surface. Histological evidence supports the biomechanical measurements and demonstrates the significantly less new bone formation around dental implants is O/MS and DM groups as compared to the control group. The number of asterisks denotes statistically homogeneous groups.
Figure 4. Histological sections demonstrate bone formation surrounding implants.
Hematoxylin and eosin stained sections of mandibular implant sites of A) Control, B) O/MS and C) DM pig groups demonstrating considerable amounts of newly formed bone encompassing dental implants seen as a darker pink compared to existing bone seen in lighter pink.
4. Discussion
Compromised healing around endosteal implants due to metabolic conditions such as O/MS and DM are prominent health concerns that remain unaddressed 41. The present investigation aimed to demonstrate proof of concept of the induction of stable, obesity/metabolic syndrome (O/MS) and type-2 diabetes mellitus (DM) in a Göttingen minipig model and determine whether obesity induced metabolic syndrome had the same impact on the initial stability of dental implants as type-2 diabetes and to determine whether mechanistically it was caused by reduced bone formation around the implant.
While bone healing impairment around implants was observed upon induction of a stable diabetic state, we also observed that in the obese state impaired bone healing reached comparable impairment levels to those found in uncontrolled diabetic animals. The O/MS minipigs had high weight gain, high levels of systemic inflammation as evidenced by elevated CRP, and high levels of insulin production in the pancreas. Weight gain through a diet high in saturated and hydrogenated fats and sugars resulted in disease induction phenotypically similar to human in these animals. Animal weight increase and stabilization without reversing the disease process strongly suggests that Göttingen minipigs manifest a similar disease process to humans 42, 43. The DM group followed the natural progression of obesity with a mild state of diabetes (detectable glucose metabolism deficiency) successfully achieved with a mild STZ regimen that has been reported to have no metabolic effect on Göttingen minipigs. Yet, when following diet induced O/MS, such STZ regimen effectively induced a disease phenotype similar to type-2 diabetes mellitus, 17, 44 indicating that O/MS Göttingen minipigs are predisposed to type-2 diabetes and the modest additional damage to beta-cells by low dose STZ is sufficient to induce a type 2 DM phenotype. Importantly, following induction of DM, animals reached diagnostic levels of hyperglycemia.
Previous studies 41, 45 have used swine as a systemically compromised and clinically relevant model for dental implant testing. However, these differed from the current investigation as they utilized the substantially larger domestic pig model using STZ to induce a diabetic state without prior O/MS induction resulting in a Type I diabetes phenotype (no obesity induction was performed prior STZ diabetes induction).
In the context of insulin-resistance in both O/MS and DM 46, elevated cortisol levels are expected given the known insulin antagonistic effects of cortisol 47. Conversely, and in agreement with previous reports 48, TNF-α levels were not significantly elevated in the obese phenotype but were elevated in the DM group, suggesting that further inflammatory state evolution is induced by the diabetic state, contributing to clinical sequelae prevalent in this metabolic disease. A previous study has shown that inflammatory factors are not as affected in obese mice relative to the values observed in the present investigation.49
For both metabolic conditions, initial bone formation around implants was significantly less pronounced compared to controls and affected the biomechanical stability of implants. Such histomorphometric and biomechanical results in diabetic animals have been explained by previous investigations and include reduced osteoblast expression, reduced osteoid production, impaired bone apposition to implants,5, 50–52 and decreased expression of bone matrix proteins 53, 54. While no reports are currently available regarding impaired osseointegration of implants in O/MS subjects, recent work in humans has demonstrated reduced bone mineral density in adolescents.
5. Conclusion
Obesity/metabolic syndrome and diabetes have known associations with higher dental implant faiure and are regarded as significant risk-factors for implant therapy 55. In this study, we present a highly translational large animal model of O/MS where a pro-inflammatory state is established in the early phases of obesity and persists upon induction of diabetes. Moreover, we showed the equally compromised bone healing around dental implants in O/MS and uncontrolled DM pigs compared to controls. Given the increasing prevalence of these progressive metabolic conditions, the animal models described may be a useful in future translational development of preventive/therapeutic approaches that minimize oral rehabilitation morbidity related to O/MS and DM.
Acknowledgments
The authors acknowledge and valuable help and input from Marcel Obrecht. The implants utilized in the study were kindly donated by Straumann AB, Switzerland. Funds for the current project originated from a grant (926/2013) from the ITI Foundation (Switzerland), NIH/NIDCR DE023649-01A1, and DE023649-02S1.
Footnotes
Publisher's Disclaimer: This is a PDF file of an unedited manuscript that has been accepted for publication. As a service to our customers we are providing this early version of the manuscript. The manuscript will undergo copyediting, typesetting, and review of the resulting proof before it is published in its final citable form. Please note that during the production process errors may be discovered which could affect the content, and all legal disclaimers that apply to the journal pertain.
Conflict of interest
The authors declare no conflict of interest.
References
- 1.Adult Obesity Facts. Centers for Disease Control and Prevention. 2016 [Google Scholar]
- 2.Diabetes Facts. World Health Organization. 2016 [Google Scholar]
- 3.Boyle JP, Thompson TJ, Gregg EW, Barker LE, Williamson DF. Projection of the year 2050 burden of diabetes in the US adult population: dynamic modeling of incidence, mortality, and prediabetes prevalence. Population health metrics. 2010;8:29. doi: 10.1186/1478-7954-8-29. [DOI] [PMC free article] [PubMed] [Google Scholar]
- 4.Alabdulkarim M, Bissada N, Al-Zahrani M, Ficara A, Siegel B. Alveolar bone loss in obese subjects. Journal of the International Academy of Periodontology. 2005;7:34–38. [PubMed] [Google Scholar]
- 5.Mellado-Valero A, Ferrer Garcia JC, Herrera Ballester A, Labaig Rueda C. Effects of diabetes on the osseointegration of dental implants. Medicina oral, patologia oral y cirugia buccal. 2007;12:E38–43. [PubMed] [Google Scholar]
- 6.Monje A, Catena A, Borgnakke WS. Association between diabetes mellitus/hyperglycaemia and peri-implant diseases: Systematic review and meta-analysis. J Clin Periodontol. 2017 doi: 10.1111/jcpe.12724. [DOI] [PubMed] [Google Scholar]
- 7.Di Benedetto A, Gigante I, Colucci S, Grano M. Periodontal disease: linking the primary inflammation to bone loss. Clinical & developmental immunology. 2013;2013:503754. doi: 10.1155/2013/503754. [DOI] [PMC free article] [PubMed] [Google Scholar]
- 8.Swindle MM, Makin A, Herron AJ, Clubb FJ, Jr, Frazier KS. Swine as models in biomedical research and toxicology testing. Veterinary pathology. 2012;49:344–356. doi: 10.1177/0300985811402846. [DOI] [PubMed] [Google Scholar]
- 9.Roura E, Koopmans SJ, Lalles JP, Le Huerou-Luron I, de Jager N, Schuurman T, et al. Critical review evaluating the pig as a model for human nutritional physiology. Nutr Res Rev. 2016;29:60–90. doi: 10.1017/S0954422416000020. [DOI] [PubMed] [Google Scholar]
- 10.Bellinger DA, Merricks EP, Nichols TC. Swine models of type 2 diabetes mellitus: insulin resistance, glucose tolerance, and cardiovascular complications. ILAR journal. 2006;47:243–258. doi: 10.1093/ilar.47.3.243. [DOI] [PubMed] [Google Scholar]
- 11.Spurlock ME, Gabler NK. The development of porcine models of obesity and the metabolic syndrome. The Journal of nutrition. 2008;138:397–402. doi: 10.1093/jn/138.2.397. [DOI] [PubMed] [Google Scholar]
- 12.Litten-Brown JC, Corson AM, Clarke L. Porcine models for the metabolic syndrome, digestive and bone disorders: a general overview. Animal : an international journal of animal bioscience. 2010;4:899–920. doi: 10.1017/S1751731110000200. [DOI] [PubMed] [Google Scholar]
- 13.Singer AJ, Taira BR, McClain SA, Rooney J, Steinhauff N, Zimmerman T, et al. Healing of mid-dermal burns in a diabetic porcine model. Journal of burn care & research : official publication of the American Burn Association. 2009;30:880–886. doi: 10.1097/BCR.0b013e3181b48a6b. [DOI] [PubMed] [Google Scholar]
- 14.von Wilmowsky C, Stockmann P, Metzler P, Harsch IA, Amann K, Schlegel KA. Establishment of a streptozotocin-induced diabetic domestic pig model and a systematic evaluation of pathological changes in the hard and soft tissue over a 12-month period. Clinical oral implants research. 2010;21:709–717. doi: 10.1111/j.1600-0501.2010.01914.x. [DOI] [PubMed] [Google Scholar]
- 15.Liu Y, Zheng Y, Ding G, Fang D, Zhang C, Bartold PM, et al. Periodontal ligament stem cell-mediated treatment for periodontitis in miniature swine. Stem cells. 2008;26:1065–1073. doi: 10.1634/stemcells.2007-0734. [DOI] [PMC free article] [PubMed] [Google Scholar]
- 16.Johansen T, Hansen HS, Richelsen B, Malmlof R. The obese Gottingen minipig as a model of the metabolic syndrome: dietary effects on obesity, insulin sensitivity, and growth hormone profile. Comparative medicine. 2001;51:150–155. [PubMed] [Google Scholar]
- 17.Larsen MO, Wilken M, Gotfredsen CF, Carr RD, Svendsen O, Rolin B. Mild streptozotocin diabetes in the Gottingen minipig A novel model of moderate insulin deficiency and diabetes. American journal of physiology Endocrinology and metabolism. 2002;282:E1342–1351. doi: 10.1152/ajpendo.00564.2001. [DOI] [PubMed] [Google Scholar]
- 18.Koopmans SJ, Mroz Z, Dekker R, Corbijn H, Ackermans M, Sauerwein H. Association of insulin resistance with hyperglycemia in streptozotocin-diabetic pigs: effects of metformin at isoenergetic feeding in a type 2-like diabetic pig model. Metabolism: clinical and experimental. 2006;55:960–971. doi: 10.1016/j.metabol.2006.03.004. [DOI] [PubMed] [Google Scholar]
- 19.Kilkenny C, Browne WJ, Cuthill IC, Emerson M, Altman DG. Improving bioscience research reporting: the ARRIVE guidelines for reporting animal research. PLoS Biol. 2010;8:e1000412. doi: 10.1371/journal.pbio.1000412. [DOI] [PMC free article] [PubMed] [Google Scholar]
- 20.te Pas MF, Koopmans SJ, Kruijt L, Calus MP, Smits MA. Plasma proteome profiles associated with diet-induced metabolic syndrome and the early onset of metabolic syndrome in a pig model. PloS one. 2013;8:e73087. doi: 10.1371/journal.pone.0073087. [DOI] [PMC free article] [PubMed] [Google Scholar]
- 21.Mantzoros CS. Obesity and Diabetes. United States: Humana Press; 2006. [Google Scholar]
- 22.Ervin RB. Prevalence of metabolic syndrome among adults 20 years of age and over, by sex, age, race and ethnicity, and body mass index: United States, 2003–2006. Natl Health Stat Report. 2009:1–7. [PubMed] [Google Scholar]
- 23.Yang TY, Chou JI, Ueng KC, Chou MY, Yang JJ, Lin-Shiau SY, et al. Weight reduction effect of Puerh tea in male patients with metabolic syndrome. Phytother Res. 2014;28:1096–1101. doi: 10.1002/ptr.5111. [DOI] [PubMed] [Google Scholar]
- 24.Aguilar M, Bhuket T, Torres S, Liu B, Wong RJ. Prevalence of the metabolic syndrome in the United States, 2003–2012. JAMA. 2015;313:1973–1974. doi: 10.1001/jama.2015.4260. [DOI] [PubMed] [Google Scholar]
- 25.Aronson D, Bartha P, Zinder O, Kerner A, Markiewicz W, Avizohar O, et al. Obesity is the major determinant of elevated C-reactive protein in subjects with the metabolic syndrome. Int J Obes Relat Metab Disord. 2004;28:674–679. doi: 10.1038/sj.ijo.0802609. [DOI] [PubMed] [Google Scholar]
- 26.Raffaitin C, Gin H, Empana JP, Helmer C, Berr C, Tzourio C, et al. Metabolic syndrome and risk for incident Alzheimer's disease or vascular dementia: the Three-City Study. Diabetes Care. 2009;32:169–174. doi: 10.2337/dc08-0272. [DOI] [PMC free article] [PubMed] [Google Scholar]
- 27.Birdsill AC, Carlsson CM, Willette AA, Okonkwo OC, Johnson SC, Xu G, et al. Low cerebral blood flow is associated with lower memory function in metabolic syndrome. Obesity (Silver Spring) 2013;21:1313–1320. doi: 10.1002/oby.20170. [DOI] [PMC free article] [PubMed] [Google Scholar]
- 28.Hanson RL, Imperatore G, Bennett PH, Knowler WC. Components of the "metabolic syndrome" and incidence of type 2 diabetes. Diabetes. 2002;51:3120–3127. doi: 10.2337/diabetes.51.10.3120. [DOI] [PubMed] [Google Scholar]
- 29.Lind L. Endothelium-dependent vasodilation, insulin resistance and the metabolic syndrome in an elderly cohort: the Prospective Investigation of the Vasculature in Uppsala Seniors (PIVUS) study. Atherosclerosis. 2008;196:795–802. doi: 10.1016/j.atherosclerosis.2007.01.014. [DOI] [PubMed] [Google Scholar]
- 30.Pedersen R, Ingerslev HC, Sturek M, Alloosh M, Cirera S, Christoffersen BO, et al. Characterisation of gut microbiota in Ossabaw and Gottingen minipigs as models of obesity and metabolic syndrome. PloS one. 2013;8:e56612. doi: 10.1371/journal.pone.0056612. [DOI] [PMC free article] [PubMed] [Google Scholar]
- 31.Christoffersen BO, Grand N, Golozoubova V, Svendsen O, Raun K. Gender-associated differences in metabolic syndrome-related parameters in Gottingen minipigs. Comparative medicine. 2007;57:493–504. [PubMed] [Google Scholar]
- 32.Christoffersen B, Golozoubova V, Pacini G, Svendsen O, Raun K. The young Gottingen minipig as a model of childhood and adolescent obesity: influence of diet and gender. Obesity (Silver Spring) 2013;21:149–158. doi: 10.1002/oby.20249. [DOI] [PubMed] [Google Scholar]
- 33.Huang JV, Lu L, Ye S, Bergman BC, Sparagna GC, Sarraf M, et al. Impaired contractile recovery after low-flow myocardial ischemia in a porcine model of metabolic syndrome. Am J Physiol Heart Circ Physiol. 2013;304:H861–873. doi: 10.1152/ajpheart.00535.2012. [DOI] [PMC free article] [PubMed] [Google Scholar]
- 34.Phillips-Eakley AK, McKenney-Drake ML, Bahls M, Newcomer SC, Radcliffe JS, Wastney ME, et al. Effect of High-Calcium Diet on Coronary Artery Disease in Ossabaw Miniature Swine With Metabolic Syndrome. J Am Heart Assoc. 2015;4:e001620. doi: 10.1161/JAHA.114.001620. [DOI] [PMC free article] [PubMed] [Google Scholar]
- 35.Westover AJ, Johnston KA, Buffington DA, Humes HD. An Immunomodulatory Device Improves Insulin Resistance in Obese Porcine Model of Metabolic Syndrome. J Diabetes Res. 2016;2016:3486727. doi: 10.1155/2016/3486727. [DOI] [PMC free article] [PubMed] [Google Scholar]
- 36.Bratz IN, Dick GM, Tune JD, Edwards JM, Neeb ZP, Dincer UD, et al. Impaired capsaicin-induced relaxation of coronary arteries in a porcine model of the metabolic syndrome. Am J Physiol Heart Circ Physiol. 2008;294:H2489–2496. doi: 10.1152/ajpheart.01191.2007. [DOI] [PubMed] [Google Scholar]
- 37.Friedmann A, Friedmann A, Grize L, Obrecht M, Dard M. Convergent methods assessing bone growth in an experimental model at dental implants in the minipig. Annals of anatomy = Anatomischer Anzeiger : official organ of the Anatomische Gesellschaft. 2014;196:100–107. doi: 10.1016/j.aanat.2014.02.001. [DOI] [PubMed] [Google Scholar]
- 38.Leonard G, Coelho P, Polyzois I, Stassen L, Claffey N. A study of the bone healing kinetics of plateau versus screw root design titanium dental implants. Clinical oral implants research. 2009;20:232–239. doi: 10.1111/j.1600-0501.2008.01640.x. [DOI] [PubMed] [Google Scholar]
- 39.Shibli JA, Melo L, Ferrari DS, Figueiredo LC, Faveri M, Feres M. Composition of supra-and subgingival biofilm of subjects with healthy and diseased implants. Clinical oral implants research. 2008;19:975–982. doi: 10.1111/j.1600-0501.2008.01566.x. [DOI] [PubMed] [Google Scholar]
- 40.Tabanella G, Nowzari H, Slots J. Clinical and microbiological determinants of ailing dental implants. Clinical implant dentistry and related research. 2009;11:24–36. doi: 10.1111/j.1708-8208.2008.00088.x. [DOI] [PubMed] [Google Scholar]
- 41.von Wilmowsky C, Stockmann P, Harsch I, Amann K, Metzler P, Lutz R, et al. Diabetes mellitus negatively affects peri-implant bone formation in the diabetic domestic pig. J Clin Periodontol. 2011;38:771–779. doi: 10.1111/j.1600-051X.2011.01746.x. [DOI] [PubMed] [Google Scholar]
- 42.Shapses SA, Sukumar D. Bone metabolism in obesity and weight loss. Annual review of nutrition. 2012;32:287–309. doi: 10.1146/annurev.nutr.012809.104655. [DOI] [PMC free article] [PubMed] [Google Scholar]
- 43.Cao JJ. Effects of obesity on bone metabolism. Journal of orthopaedic surgery and research. 2011;6:30. doi: 10.1186/1749-799X-6-30. [DOI] [PMC free article] [PubMed] [Google Scholar]
- 44.Gabel H, Bitter-Suermann H, Henriksson C, Save-Soderbergh J, Lundholm K, Brynger H. Streptozotocin diabetes in juvenile pigs. Evaluation of an experimental model. Hormone and metabolic research = Hormon- und Stoffwechselforschung = Hormones et metabolisme. 1985;17:275–280. doi: 10.1055/s-2007-1013518. [DOI] [PubMed] [Google Scholar]
- 45.Schlegel KA, Prechtl C, Most T, Seidl C, Lutz R, von Wilmowsky C. Osseointegration of SLActive implants in diabetic pigs. Clinical oral implants research. 2013;24:128–134. doi: 10.1111/j.1600-0501.2011.02380.x. [DOI] [PubMed] [Google Scholar]
- 46.Koopmans SJ, Schuurman T. Considerations on pig models for appetite, metabolic syndrome and obese type 2 diabetes: From food intake to metabolic disease. Eur J Pharmacol. 2015;759:231–239. doi: 10.1016/j.ejphar.2015.03.044. [DOI] [PubMed] [Google Scholar]
- 47.Rafacho A, Ortsater H, Nadal A, Quesada I. Glucocorticoid treatment and endocrine pancreas function: implications for glucose homeostasis, insulin resistance and diabetes. The Journal of endocrinology. 2014;223:R49–62. doi: 10.1530/JOE-14-0373. [DOI] [PubMed] [Google Scholar]
- 48.Doucette CR, Horowitz MC, Berry R, MacDougald OA, Anunciado-Koza R, Koza RA, et al. A High Fat Diet Increases Bone Marrow Adipose Tissue (MAT) But Does Not Alter Trabecular or Cortical Bone Mass in C57BL/6J Mice. Journal of cellular physiology. 2015;230:2032–2037. doi: 10.1002/jcp.24954. [DOI] [PMC free article] [PubMed] [Google Scholar]
- 49.Gotoh K, Inoue M, Masaki T, Chiba S, Shimasaki T, Ando H, et al. A novel anti-inflammatory role for spleen-derived interleukin-10 in obesity-induced inflammation in white adipose tissue and liver. Diabetes. 2012;61:1994–2003. doi: 10.2337/db11-1688. [DOI] [PMC free article] [PubMed] [Google Scholar]
- 50.Verhaeghe J, van Herck E, Visser WJ, Suiker AM, Thomasset M, Einhorn TA, et al. Bone and mineral metabolism in BB rats with long-term diabetes. Decreased bone turnover and osteoporosis. Diabetes. 1990;39:477–482. doi: 10.2337/diab.39.4.477. [DOI] [PubMed] [Google Scholar]
- 51.Iyama S, Takeshita F, Ayukawa Y, Kido MA, Suetsugu T, Tanaka T. A study of the regional distribution of bone formed around hydroxyapatite implants in the tibiae of streptozotocin-induced diabetic rats using multiple fluorescent labeling and confocal laser scanning microscopy. Journal of periodontology. 1997;68:1169–1175. doi: 10.1902/jop.1997.68.12.1169. [DOI] [PubMed] [Google Scholar]
- 52.Hasegawa H, Ozawa S, Hashimoto K, Takeichi T, Ogawa T. Type 2 diabetes impairs implant osseointegration capacity in rats. The International journal of oral & maxillofacial implants. 2008;23:237–246. [PubMed] [Google Scholar]
- 53.Lu H, Kraut D, Gerstenfeld LC, Graves DT. Diabetes interferes with the bone formation by affecting the expression of transcription factors that regulate osteoblast differentiation. Endocrinology. 2003;144:346–352. doi: 10.1210/en.2002-220072. [DOI] [PubMed] [Google Scholar]
- 54.Brandao-Burch A, Utting JC, Orriss IR, Arnett TR. Acidosis inhibits bone formation by osteoblasts in vitro by preventing mineralization. Calcified tissue international. 2005;77:167–174. doi: 10.1007/s00223-004-0285-8. [DOI] [PubMed] [Google Scholar]
- 55.Morris HF, Ochi S, Winkler S. Implant survival in patients with type 2 diabetes: placement to 36 months. Annals of periodontology. 2000;5:157–165. doi: 10.1902/annals.2000.5.1.157. [DOI] [PubMed] [Google Scholar]


