Abstract
Magnetic Particle Imaging (MPI) is an emerging, whole body biomedical imaging technique, with sub-millimeter spatial resolution and high sensitivity to a biocompatible contrast agent consisting of an iron oxide nanoparticle core and a biofunctionalized shell. Successful application of MPI to imaging of cancer depends on the nanoparticles (NPs) accumulating at tumors at sufficient levels relative to other sites. NPs physiochemical properties such as size, crystallographic structure and uniformity, surface coating, stability, blood circulation time and magnetization determine the efficacy of their tumor accumulation and MPI signal generation. Here, we address these criteria by presenting strategies for the synthesis and surface functionalization of efficient MPI tracers, that can target a typical murine brain cancer model and generate three dimensional images of these tumors with very high signal-to-noise ratios (SNR). Our results showed high contrast agent sensitivities that enabled us to detect 1.1ng of iron (SNR~3.9) and enhance the spatial resolution to about 600μm. The biodistribution of these NPs was also studied using near infra-red fluorescent (NIRF) and single-photon emission computed tomography (SPECT) imaging. NPs were mainly accumulated in liver and spleen and did not show any renal clearance. This first pre-clinical study of cancer targeted NPs imaged using a tomographic MPI system in an animal model, paves the way to explore new nanomedicine strategies for cancer diagnosis and therapy, using clinically safe magnetic iron oxide nanoparticles and MPI.
Keywords: Nanoparticles, iron oxide, cancer, targeting, imaging, diagnosis, magnetic particle imaging, MPI
Introduction
Magnetic Particle Imaging (MPI) is a novel biomedical imaging technique, incorporating high contrast agent mass sensitivity (~5 nano grams Fe/μL1), and sub-mm spatial resolution,2 that is linearly quantitative with NPs concentration, and with zero tissue depth signal attenuation.3–6 Further, MPI involves no ionizing radiation and uses biocompatible superparamagnetic iron oxide nanoparticles (NPs) as contrast agents thereby enhancing its clinical safety.7–9 These unique advantages of MPI offer promise in a wide range of clinical applications such as cardiovascular imaging, cancer diagnosis, brain injury detection, lung perfusion imaging, and in vivo tracking of magnetically labeled stem cells.10–15 However, efforts to improve MPI scanners/spectrometers and design of functionalized contrast agents are still required to not only enhance MPI performance such as spatial resolution, signal intensity and imaging speed, but also to develop promising translational medical applications.16
Here, we study the cancer targeting ability of our functionalized MPI contrast agents in mice with brain cancer xenografts, and assess MPI capabilities for targeted and tomographic imaging of the cancer. To enhance specific tumor targeting, we conjugated lactoferrin (a brain cancer targeting peptide17) to the NPs and used an external magnet to improve the localization of the NPs to tumor xenografts. Using MPI, we were able to visualize only nanoparticles that were embedded in tissues, based on their intrinsic magnetic responses. Therefore, unlike MRI, we did not see background interference from surrounding diamagnetic tissues and the signals were depth-independent, as generally expected in MPI. We have also developed a generalized platform for functionalization of individual NPs for multimodal imaging, combining MPI, near infra-red fluorescent (NIRF) imaging, single-photon emission computed tomography (SPECT) and computed tomography (CT) modalities, in order to study the biodistribution of these NPs in mice more accurately. Such critical proof-of-concept studies provide the necessary information for future applications of MPI with optimized contrast agents for tomographic and quantitative cancer imaging and diagnosis, in combination with other imaging modalities such as fluorescent imaging, SPECT/PET and magnetic resonance imaging (MRI).
Results and Discussions
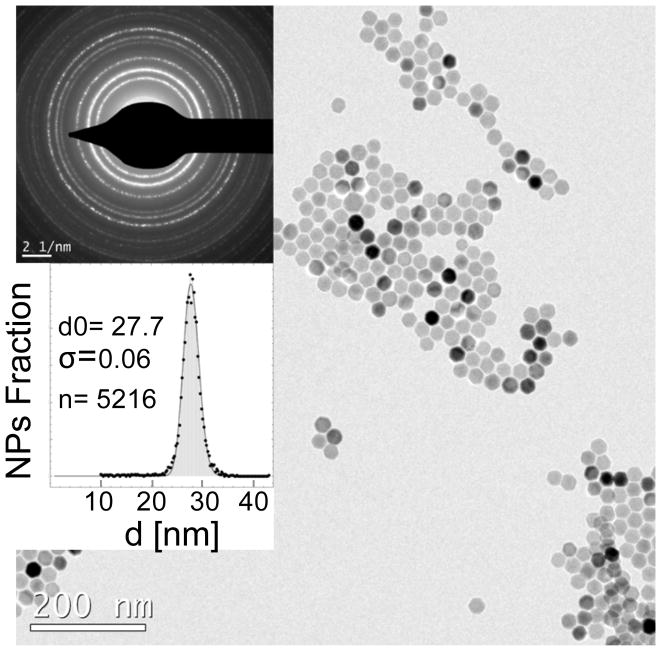
The signal in MPI originates directly from the superparamagnetic iron oxide nanoparticles and is proportional to the field dependent magnetization response of the NPs (χdiff = dm/dH, where m = MsV, is the magnetic moment of individual NPs of volume, V and saturation magnetization, Ms, and H is the applied field in a typical MPI scanner).18 In the x-space MPI image reconstruction method, improvements in image quality can be represented by narrower full width at half maximum (FWHM) and larger peak heights of nanoparticles dm/dH, measured by a magnetic particle spectrometer (MPS).6, 19–21 Here, we use thermodynamically phase-pure and monodisperse nanoparticles (dC ~ 25–27nm), with near ideal saturation magnetization,22 and long blood circulation times,11 optimized for cancer diagnosis using MPI (Figs. 1 and S3). This is critical for cancer targeted MPI, since phase pure NPs in this size range generate much higher MPI signal intensities, which enables imaging of the tumors with higher sensitivities (per unit mass of the NPs) using MPI, when only a small fraction (i.e., nanograms) of the administered NPs accumulate in tumors.
Fig. 1.
Synthesis of highly monodisperse and superparamagnetic nanoparticles with near-theoretical possible magnetic susceptibility optimized for MPI. TEM image (scale bar 200nm), electron diffraction pattern (scale bar: 2 1/nm), and size distribution histogram of the optimized phase pure NPs synthesized by thermal decomposition of iron oleate in the presence of oleic acid surfactant, followed by their controlled oxidation in the presence of oxygen.
Details of our core synthesis procedure and structural parameters are reported elsewhere.22–24 Incomplete oxidation of the iron oxide nanoparticles lead to the presence of Wüstite (FeO), an antiferromagnetic phase, in NPs which results in dramatic deterioration in their MPS and MPI performance, as shown by an increase in the FWHM (i.e., losing resolution in MPI, Fig. S3a). Controlled oxidation to obtain pure magnetite NPs results in a very narrow dm/dH peak, with a FWHM of about 60% of commercial ResovistTM iron oxide NPs. Note that hydrodynamic size and polydispersity index of the NPs measured by DLS method were almost identical (dH ~ 55–65nm, PDI ~ 0.2–0.25). Such variations in MPS dm/dH response were also reflected in the near-zero field derivatives of dc m-H measurements of these two types of NPs (Fig. S3b). In spite of their similar sizes observed in TEM, single crystalline phase-pure magnetite NPs were rapidly magnetized and reached their saturation magnetization at much smaller field values, compared to FeO/Fe3O4 hetrogenous structures, a phenomenon which resulted in their significantly improved MPI performance (i.e., narrower FWHM of the point spread function, or PSF, in MPS). Phase purity and tuned size of the NPs enhanced their detection sensitivity and achievable spatial resolution. Our in vitro results (Fig. S4a) showed that we were able to detect about 1ng of these NPs (total volume 2–3μL, SNR=3.9). Larger volume of the NPs (~ 200μL) with a concentration of ~550pg Fe/μL could be feasibly imaged (SNR=4.9) in our scanner (Fig. S4b). The signal intensity changes linearly with concentration of the NPs, ranging from less than 10ng Fe/μL to about 10,000ng Fe/μL (Fig. S4c), which is critical for quantitative imaging of NPs in tissues and cells. Finally, we were able to distinguish the NPs solutions (1–2μL each) placed at different distances (~ 4600, 1400 and 600μm) relative to each other, showing a high spatial resolution of less than 600μm (Fig. S5) with our optimized contrast agents and a preclinical MPI scanner (Magnetic Insight, Momentum).
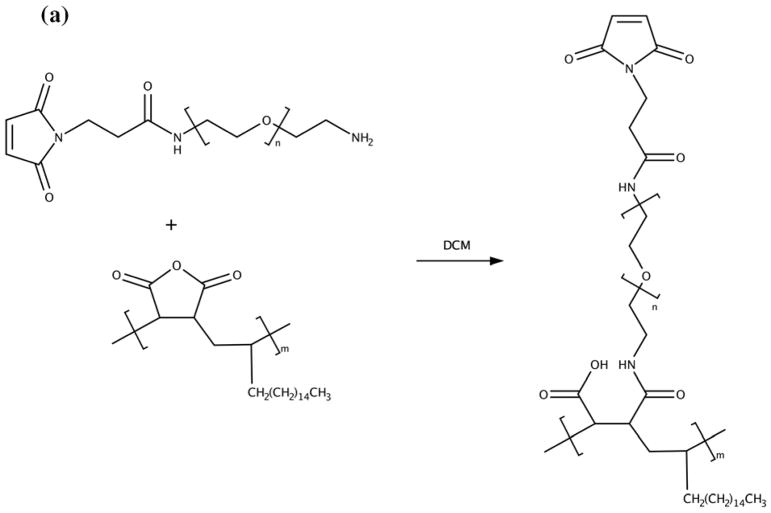
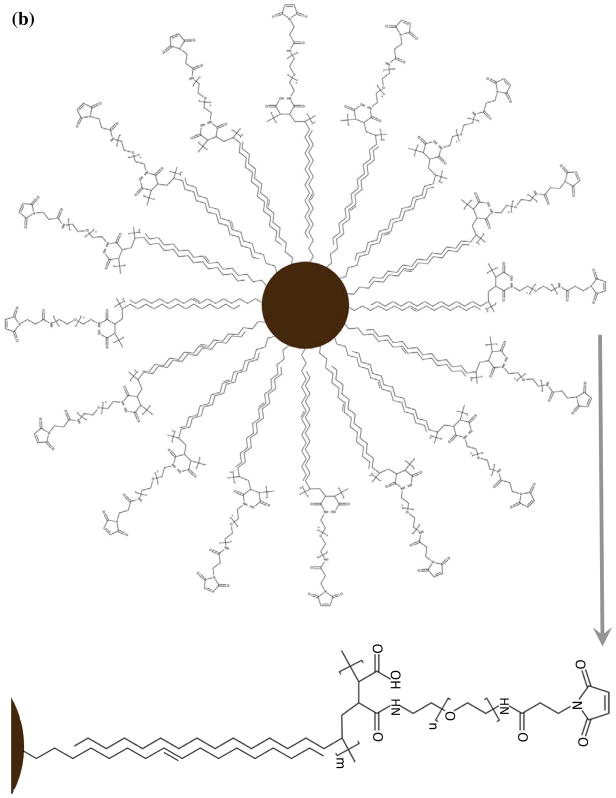
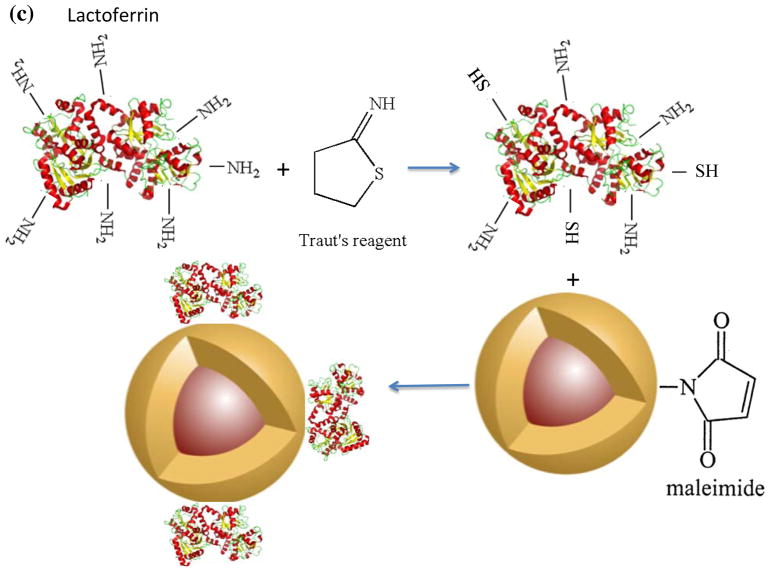
NPs were coated with PMAO-PEG co-polymer molecules, in which PEG molecules were functionalized with a maleimide group (Figs. 2a and b). Maleimides are highly reactive with thiols (-SH), which makes them a suitable platform for conjugation of various types of targeting peptides with thiol groups on their backbone structure. We used lactoferrin, since our recent in vitro studies showed that they can effectively target C6 brain cancer cells, presenting a reasonable MPI signal after cellular internalization.17 Since lactoferrin lacks any thiol groups, but has a large number of amine groups on its backbone structure, we transformed some of these amine groups to thiols with the help of Traut’s reagent (Fig. 2c).25 The thiolated lactoferrin was then conjugated to maleimide groups of the PMAO-PEG coating molecules on the surface of the NPs (Fig. 2c). Cy5.5-NHS NIRF molecules were also conjugated to the lactoferrin molecules using methods we reported earlier.17, 26 NPs without lactoferrin on their surface were used as control samples to evaluate the role of lactoferrin on tumor uptake. Dynamic light scattering (DLS) measurements showed that the hydrodynamic sizes of the lactoferrin conjugated and control NPs were 112 and 104nm, respectively.
Fig. 2.
Schematics showing surface functionalization of the optimized MPI contrast agents for glioma targeting. (a) synthesis of the PMAO-PEG co-polymer, with active maleimide functional groups and (b) its assembly on the surface of the oleic acid coated nanoparticles after phase transfer to aqueous phases. (c) Thiolation of the lactoferrin molecules using Traut’s reagent and their conjugation to maleimide functionalized MPI contrast agents for in vivo brain cancer targeting experiments.
Evaluation of the NPs uptake in tumors, 1 and 2 hours after tail-vein injection, was carried out using a MPI scanner and a near infra-red fluorescent imaging system (IVIS); the magnetic and fluorescence signals of excised tumors were also measured by IVIS, an MPS (frequency ~ 25kHz) and a MPI scanner. Tissue fluorescence signal intensity is highly dependent on the number of fluorescent-tagged nanoparticles accumulated within them as MPS and MPI signals are quantitative and depend linearly on the concentration of magnetic nanoparticles. MPS is an accurate and quick representative technique to evaluate the MPI signal of the tissues (similar to nuclear magnetic resonance or NMR versus MRI). Mice were injected in four different groups with: (1) Lactoferrin-conjugated NPs combined with an external magnet to enhance the targeting, (2) Lactoferrin without an external magnet, (3) NPs without lactoferrin on their surface to evaluate enhanced permeation and retention (EPR) mediated accumulation, and (4) phosphate buffered solution (PBS) as a control.
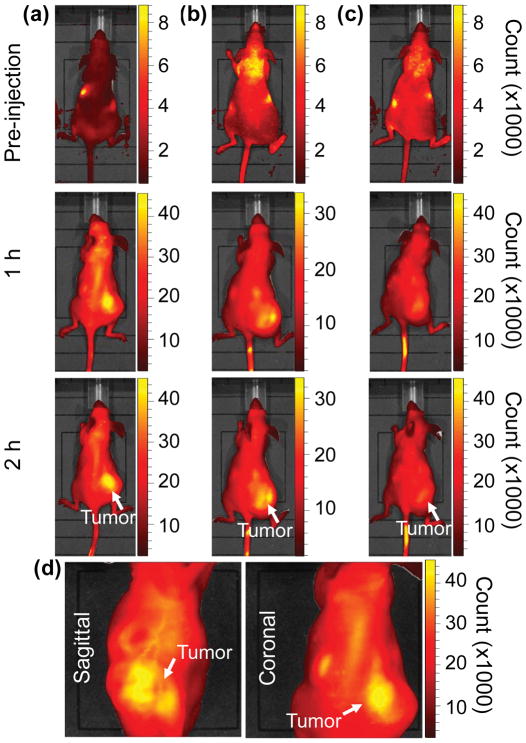
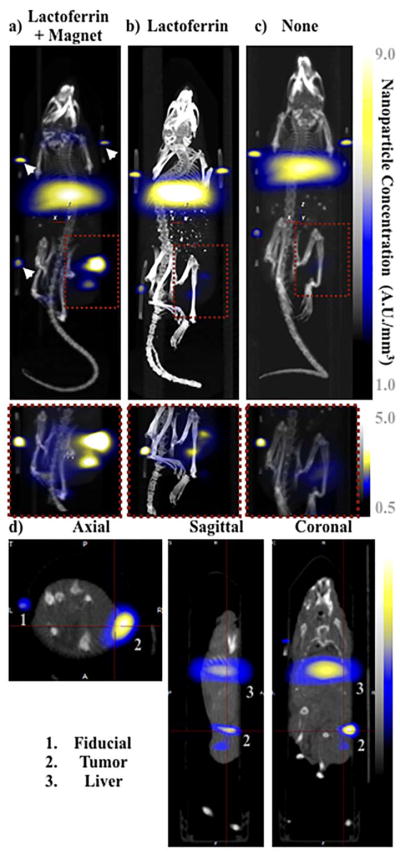
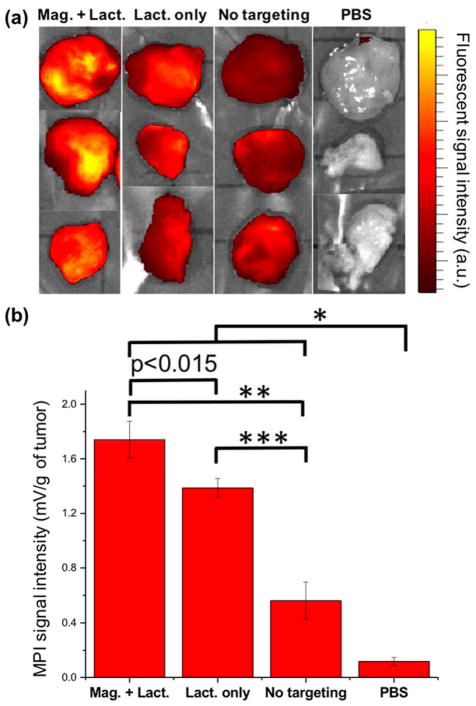
Overall, our in vivo (Figs. 3, 4 and S6–S10) and ex vivo results (Fig. 5) showed that nanoparticles accumulated within tumors based on three mechanisms: 1) EPR effect, associated with the passive diffusion of particles through the presumably leaky vasculature (enhanced permeation) and subsequent accumulation in the tumors (retention); 2) ligand (lactoferrin) assisted accumulation and 3) external magnetic targeting. Generally, these three mechanisms depend on nanoparticle blood circulation time, hydrodynamic size, surface coating and charge (zeta potential).27 Whole body NIRF and MPI images showed a much lower uptake in the tumors due to the EPR effect (Figs. 3c, S7c and S10); however, the lactoferrin conjugated NPs were readily internalized and retained in xenografts (Figs. 3b, S7b and S9), and uptake was enhanced when we placed a magnet adjacent to the tumors (Figs. 3a, 3d, S7a and S8). Tomographic analyses of the MPI results enabled us to determine the 3D distribution of the NPs in tumors and livers (Fig. 4d and supporting videos 1–3). Note that color scale bar ranges of these videos are the same as their counterpart 2D images shown in Fig. 4. MPI results and NIRF images of the excised tumors (Figs. 4, 5a and supporting videos 1–3) showed that the tumor uptake, based on these mechanisms is cumulative, with the combination of magnetic and lactoferrin-assisted targeting showing the greatest uptake. These results were also confirmed by MPI signal analyses of the tumor tissues from the excised xenografts (Fig. 5b).
Fig. 3.
Near Infrared fluorescent (NIRF) images of the tumor xenografts. Images of the mice injected with Cy5.5-Lactoferrin conjugated NPs, with (a) and without (b) a permanent magnet placed adjacent to the tumor xenograft on the right side flank, compared with mice injected with Cy5.5-labeled NPs, without using lactoferrin and magnetic targeting (c). (d) Higher magnification sagittal and coronal images of the tumors, 2h after magnetic targeting. Three mice were used for each condition and pre-injection and post-injection (1 and 2h) images were captured from four different mice positions to show NPs accumulation in tumors clearly (see additional mice images in Figs. S4–S8).
Fig. 4.
MPI images of the mice with tumor xenografts. Two-dimensional (2D) MPI/CT images (2h post-injection) of mice injected with Cy5.5-Lactoferrin conjugated NPs, with (a) and without (b) a permanent magnet placed adjacent to the tumor xenograft on the right side flank, compared with mice injected with Cy5.5-labeled NPs, without using lactoferrin and magnetic targeting (c). The tumors are marked with the red squares. Rescaled images are shown below each mouse to highlight the tumors. Three fiducial (white arrowheads in (a)) were used for registration of the MPI and CT images. Also see supporting videos 1–3, showing the three dimensional tumor images. Axial, sagittal and coronal images through the tumor for mouse (a) are shown in (d). The liver can also be seen in the sagittal and the coronal images.
Fig. 5.
Ex vivo evaluation of the uptake of MPI contrast agents by tumor xenografts. (a) NIRF images and (b) Representative MPI signal intensities (per tumor mass) of the tumor xenografts excised from mice (mean ± standard deviation; n = 3) injected with Cy5.5-lactoferrin conjugated NPs, with (Mag. + Lact.) and without (Lact. only) using magnetic targeting, compared with Cy5.5-labeled NPs (without any lactoferrin and magnetic targeting) and PBS as controls. Signal intensities were measured using a magnetic particle spectrometer. Significance was confirmed by one-way ANOVA with Bonferroni multiple comparison correction * p<0.05, ** p<0.0005 and *** p<0.0001. In NIRF images brightness is proportional to the uptake of the fluorescently labeled NPs, while in MPI measurements, bars represent MPI signal intensity (dm/dH) only generated from magnetic response of the NPs without any background signal from the tissues.
Exploiting the versatility of our surface functionalization platform, we also radiolabeled our optimized nanoparticles for SPECT/CT contrast, using 67Ga-NOTA and forming a thiourea bond with amine groups present on the surface of the nanoparticles (Fig. S1). Abundant number of amine groups on the surface of the nanoparticles made them suitable platforms for radiolabeling with 67Ga-NOTA. This molecule has an isothiocyanate group that can feasibly react with amine groups on the surface of the NPs by forming a thiourea bonding.28 The NOTA molecules did not get separated after storage for 2–3 days or during the purification and thin-layer chromatography (TLC) analyses of the radiolabelled NPs, which further confirms formation and stability of this covalent bonding. SPECT imaging provided high tracer mass sensitivity, enabling accurate, quantitative estimation of NPs concentration in the major clearance organs (i.e., liver, spleen and kidneys) and other tissues.29 SPECT/CT imaging (Fig. S11 and Supporting Videos 4 and 5) and biodistribution studies (Fig. S12) confirmed that NPs only accumulated in liver and spleen 4h after injection, with almost no traces of NPs in kidneys, lungs and heart. Quantitative measurements of the radioactivity from all organs (Fig. S12) indicated the biodistribution to be predominantly in the liver (92±10% of the administered dose) and spleen (5±1%) with trace distributions, within experimental error, in the brain and kidneys.
Conclusions
To summarize, targeted, tomographic and quantitative cancer diagnosis using MPI requires optimized NPs with tuned crystalline structure and phase purity to enhance the signal intensity and resolution. In addition, the surface of these optimized NPs should be properly functionalized to improve their blood circulation time, tumor targeting and retention. Here, using a general surface functionalization platform, we conjugated a targeting glycoprotein to the NP surface, in order to increase the uptake of the NPs by a brain tumor xenograft to levels greater than the sensitivity of current MPI scanners. Our functionalized platform, with glioma-targeting lactoferrin, conjugated to the PMAO-PEG surface coatings of the optimized MPI contrast agents, enhanced uptake by tumors. Magnetic targeting further improved the tumor uptake of the NPs. High contrast agent mass sensitivity and fast image processing of NIRF, in combination with MPI analyses enabled us to monitor the NPs uptake by tumors and perform preliminary feasibility testing of tumor targeted MPI. Multimodal MPI/CT/X-ray imaging enabled us to generate 2D and 3D tomographic and positive contrast images of these cancers in mice models with very high signal-to-noise ratios (SNR). In addition, radiolabeling of these optimized MPI contrast agents by 67Ga-NOTA, followed by highly sensitive and quantitative SPECT/CT imaging, confirmed that these NPs had no discernable renal clearance, since their hydrodynamic sizes (100–110nm) were much larger than the endothelial fenestrae in kidneys (5–15nm). Note that the hydrodynamic size and surface charge of the NPs did not have a noticeable change after their radiolabeling. Therefore, their in vivo behavior should not change after radiolabeling, since these are the major factors determining NPs biodistribution and pharmacokinetics.27 Previous studies have shown that lactoferrin molecules can pass blood brain barrier (BBB) through a receptor-mediated transcytosis mechanism.30 Therefore, future investigations using intracranially implanted brain tumor xenografts are required to validate facilitated BBB transport of these lactoferrin conjugated NPs. These proof of concept results hold promise for the safe clinical translation of our MPI contrast agents. Our flexible PMAO-PEG coating platform further provides opportunities for various conjugation strategies, ideal for multimodal MPI/CT/NIRF/MRI/CT/SPECT imaging, and each one with distinct advantages.
Experimental
Synthesis of the maleimide functionalized PMAO-PEG co-polymer
Maleimide functionalized PMAO-PEG (Fig. 2a) was synthesized by amide bond formation between heterobifunctional maleimide-poly(ethylene glycol)-amine (Mal-PEG, Mn~7.5kDa), methoxy-poly(ethylene glycol)-amine (m-PEG, Mn~20kDa), and poly(maleic anhydride-alt-1-octadecene) (PMAO, Mn~30–50kDa). Briefly, 1.75μmol (70mg) PMAO and 4μmol (30mg) Mal-PEG were dissolved in 3mL dichloromethane (DCM) followed by the addition of 10μL triethylamine. This mixture was protected from light and allowed to react for 4 hours, then 68μmol (1360mg) m-PEG, 2mL DCM, and 50μL triethylamine were added. The mixture was again protected from light and allowed to react. After 48 hours, the polymer was dried by rotary evaporation, dissolved in deionized (DI) water, and purified by membrane dialysis with a molecular weight cut-off of 50kDa. An increase in molecular weight was confirmed by Gel Permeation Chromatography (GPC).
Synthesis and phase transfer of the optimized MPI contrast agents
Monodisperse hydrophobic NPs (dC ~27nm) were synthesized by modification of a method we reported before.22, 23 As-synthesized NPs were dispersed in a 5mL mixture of hexanes and ethyl acetate (1:1) by sonication (~30sec) and then separated by a strong magnet. This step was repeated once with a mixture of hexanes and ethyl acetate (1:2), and three times with a mixture of hexane and acetone (1:1). The purified NPs (~10mg) were then dried under vacuum and re-dispersed in 10mL chloroform by sonication (~3min). 150mg of the maleimide functionalized PMAO-PEG co-polymer was added to the NPs and sonicated (~3 min), followed by overnight stirring using a small magnetic stir bar. Rotary evaporation was used to remove chloroform and then, 10mL DI water was added to the dried mixture of NPs and polymer, followed by 2 hours sonication to re-disperse the NPs. The water dispersed PMAO-PEG coated NPs (Fig. 2b) were concentrated by centrifugation filter with a molecular weight cut-off of 50kDa.
Conjugation of lactoferrin to NPs
Lactoferrin was thiolated by modification of a method reported before.31 First, we dissolved 1mg of lactoferrin in 1mL PBS. Then, 50μg of 2-iminothiolane (also called Traut’s reagent) was mixed with lactoferrin solution for 1.5h in the dark at room temperature, followed by purification using Amicon® ultra centrifugal filters (MWCO 30kDa). The final NPs were re-dispersion in the same amount of PBS. The thiolated lactoferrin was then added to the NPs solution, wrapped in aluminum foil and placed on a shaker at room temperature overnight. Then, the lactoferrin conjugated NPs were purified using PD-10 columns equilibrated with sodium bicarbonate (pH~8–8.5) buffer. Five milligrams of Cy5.5-NHS NIRF molecules (emission and excitation wavelengths ~ 673 and 707nm, respectively, and fluorescence quantum yield ~ 0.2) were dissolved in 0.5mL of DMSO and then 100μL of this solution was added to each 1mg of lactoferrin conjugated NPs. The mixture was wrapped in aluminum foil and placed on a s shaker for 2 hours. Finally, the NPs were purified using Amicon centrifuge vials (MWCO 30kDa) to remove the un-reacted Cy5.5 molecules from the NPs solution and redispersed in PBS solution for animal studies. We also synthesized a separate batch without any lactoferrin for comparison. To do this, we added 100mg NH2-PEG-SH (3.4kDa) to the NPs solution (1mg Fe), sonicated the mixture for 15 min to make sure all the polymer was dissolved and then wrapped it in aluminum foil and placed it on a shaker overnight. Thiol groups of the PEG reacted with maleimide groups on the surface of the NPs and their other amine terminating tail were used for Cy5.5 conjugation, as described above.
Radiolabeling of the NPs
For ligand modification and 67Ga-radiolabeling, nanoparticles were modified with the chelator p-SCN-bz-NOTA (Macrocyclics, USA) and then radiolabeled with Gallium-67 (67Ga, t1/2 = 78.3h) (Fig. S1). For this purpose, 800μL of the particles were diluted with NaHCO3 (800μl, 0.1N) and incubated with 0.8mg of p-SCN-bz-NOTA solution at 19 °C overnight. The particles were concentrated using Amicon® ultra(30kDa MWCO), washed twice and re-suspended in 1mL PBS. NOTA was bound to the amine groups on the surface of NPs through a thiourea bond. NPs were radiolabeled by adding 67GaCl3 (5.3mCi) to the suspension and incubating at room temperature for 30min with mixing, followed by Amicon concentration and washing twice with PBS (92% labeling efficiency). The radiolabeled particles (67Ga-NP) were dispersed in 500μl PBS for the biodistribution studies. The hydrodynamic size and zeta potential of the labeled nanoparticles were 121nm (PDI: 0.201) and −36mV.
NPs Characterizations
Transmission electron microscopy (TEM, FEI TecnaiTM G2 F20, 200KeV), equipped with a Gatan CCD camera was used to analyze size and morphology of the synthesized NPs. Magnetization behavior (m-H) of the NPs (~150μg of NPs solution in 100μL polycarbonate capsules) were studied using a vibrating sample magnetometer (VSM, Lakeshore). Dynamic light scattering (DLS, Zetasizer Nano, Malvern Instruments) was used to measure the hydrodynamic size of the PEG coated NPs. An Inductively Coupled Plasma Optical Emission Spectrophotometer (ICP-OES, Perkin Elmer Optima 8300) was used to determine the iron concentration in each NPs solution.
We also used a custom-built magnetic particle spectrometer (MPS) with a sinusoidal excitation field of 18.6mTμ0−1 (peak-peak, f0=25kHz) to evaluate MPI performance (i.e., dm/dH) of the synthesized NPs.20, 32 The data processing method for calculating dm/dH graphs from the induced voltage in receiving coils of the MPS was reported earlier.20 All dm/dH plots obtained from MPS were normalized to one in order to compare their FWHM, which is a good indicator, to first order, of the potential spatial resolution in an MPI scanner.
Preparation of the mice with C6 brain cancer xenografts
Athymic female CD-1 nude mice (12 mice, 25–30gr, 12 weeks old, Charles River Laboratories) were used as models for our tumor uptake studies, based on the animal use protocols reviewed and approved by the Institutional Animal Care and Use Committee (IACUC) of the University of Washington. Mice were housed in ventilated cages within specific pathogen free facilities and provided free access to food and water. Animals were not maintained with any specific diet such as foods with low autofluorescent signals. To generate the tumor xenografts required for this investigation, we used subcutaneous injection of C6 rat glioma cells (ATCC® CCL-107™, 106 cells in 100μL of DMEM-10% FBS cell culture media and 100μL of Matrigel) into the right flanks of the mice. The tumor growth was monitored daily and nanoparticles were injected after about 3–4 weeks 25).
NPs administration
Mice were injected, under 2–3% isoflurane anesthesia, via the tail veins with 200μL of a sterile filtered 1g Fe/L iron oxide nanoparticles suspended in phosphate buffered solution (1x, PBS). To aid in NP targeting two axially connected small neodymium rare earth magnetic discs (3/8 × 1/8 inches, N48, magnetic field strength ~ 3.900 gauss, at an angle of 0° from vertical axis) were placed on the skin adjacent to the tumors and fixed in place for about 2h using sterile wound tape, based on the results reported by Cole et al.33 We compared the targeting results with and without using an external magnet. Control animals had no magnet taped to the tumor.
In vivo and ex vivo imaging of the excised tumors (IVIS and MPS)
Before the injections, and 1 and 2 hours post-injection, mice were monitored using an IVIS fluorescent imaging system (Caliper Life Sciences, US, equipped with the Living Image software package) to evaluate for nanoparticle uptake in the tumor, liver, spleen, kidneys, lungs, brain and heart. During the nanoparticle injections and imaging steps, mice were maintained under 2–3% isoflurane anesthesia. Anesthetized animals were euthanized using cervical dislocation after in vivo imaging and the tumors were excised for fluorescent imaging and MPS measurements. We used 3 mice for each condition to determine the targeting efficiency using whole body and xenograft IVIS imaging and MPS.
MPI/CT/X-ray imaging
MPI images of the mice were acquired with the projection Field Free Line (FFL) Momentum MPI scanner (Magnetic Insight Co., Fig. S2), operating with a magnetic field gradient strength of 6 × 6T/m. Mice were translated along the z-axis of the scanner using a single-axis translation stage, with field-free line along y-axis and excitation field (45kHz, 20mT peak amplitude) along z-axis. Overlap fraction and harmonic bandwidth were 90% and 1000 kHz. Note that overlap fraction represents the path traversed by the FFL when generating the image and a higher overlap fraction generally improves SNR by increased averaging. Images were captured with a field of view (FOV) of 6cm × 8cm and acquisition time of 10 seconds per projection (Number of projections= 55), plus 30 seconds for automatic set up of the magnets and about 35 minutes for image reconstruction (total time ~ 40min). CT scans were acquired for anatomical references, using MicroCT (TriFoil Imaging CT120) scanner, with about 10 minutes acquisition time and 100μm isotropic resolution. Fiducial points (2.5μL of NPs with a concentration of 500μgFe/mL, sealed in PTFE tubing (Cole-Parmer, 1/32” and 1/16” internal and external diameters) were used for 2D and 3D registration of the MPI images with CT scans and as standards for quantification of the NPs in tissues. VivoQuant software was used for 2D and 3D image reconstructions, registrations and NPs quantifications.
SPECT/CT imaging
For biodistribution studies using SPECT/CT imaging, three female C57Bl6 mice (Charles River Laboratories) were injected each 67Ga-NP (1mCi, 120μL; 67Ga (γ: 93, 185, 300, 393KeV, 100% EC)) via tail vein. The animals were scanned individually in a MILabs VECTor/CT SPECT/CT scanner (imaging protocol approved by the University of British Columbia Animal Care Committee according to guidelines set out by the Canadian Council on Animal Care) immediately and at 4h post injection, and then euthanized. Following each SPECT acquisition, a whole body CT scan was performed to obtain anatomical information and both images were registered. For quantitative analysis, SPECT data were reconstructed with ordered subset expectation maximization algorithm (OS-EM) using 6 iterations of 16 subsets and 0.4mm3 voxel size. All organs were then counted for radioactivity.
Supplementary Material
Acknowledgments
This work was supported by NIH grants 1RO1EB013689-01 (National Institute of Biomedical Imaging and Bioengineering, NIBIB), 1R41EB013520-01 and 2R42EB013520-02A1. SPECT/CT imaging protocol was approved by the UBC’s ACC, according to CCAC guidelines. Part of this work was conducted at the University of Washington Molecular Analysis Facility (MAF), a member of the NSF National Nanotechnology Infrastructure Network (NNIN). HA, ET and KMK also acknowledge helpful discussions with Dr. S. Kemp, Dr. A. P. Khandhar, and Dr. R. M. Ferguson. HA acknowledges Stanford Cancer Imaging Training (T32) fellowship provided by NIH. Authors thank Magnetic Insight Inc. for valuable input and support for generation of MPI results. Authors also appreciate Dr. Chirag Patel for helpful discussions regarding statistical analyses.
Footnotes
Supporting data including images and videos and any associated references are included in the additional supporting information document.
References
- 1.Graeser M, Knopp T, Szwargulski P, Friedrich T, Gladiss Av, Kaul M, Krishnan KM, Ittrich H, Adam G, Buzug TM. Scientific Reports. 2017;7:6872. doi: 10.1038/s41598-017-06992-5. [DOI] [PMC free article] [PubMed] [Google Scholar]
- 2.Ferguson RM, Khandhar AP, Kemp SJ, Arami H, Saritas EU, Croft LR, Konkle J, Goodwill PW, Halkola A, Rahmer J, Borgert J, Conolly SM, Krishnan KM. IEEE Transactions on Medical Imaging. 2015;34:1077–1084. doi: 10.1109/TMI.2014.2375065. [DOI] [PMC free article] [PubMed] [Google Scholar]
- 3.Gleich B, Weizenecker J. Nature. 2005;435:1214–1217. doi: 10.1038/nature03808. [DOI] [PubMed] [Google Scholar]
- 4.Krishnan KM. Fundamentals and Applications of Magnetic Materials. Oxford University Press; Oxford: 2016. [Google Scholar]
- 5.Ferguson RM, Khandhar AP, Arami H, Hua L, Hovorka O, Krishnan KM. Biomedical Engineering. 2013;58:493–507. doi: 10.1515/bmt-2012-0058. [DOI] [PMC free article] [PubMed] [Google Scholar]
- 6.Goodwill PW, Saritas EU, Croft LR, Kim TN, Krishnan KM, Schaffer DV, Conolly SM. Advanced Materials. 2012;24:3870–3877. doi: 10.1002/adma.201200221. [DOI] [PubMed] [Google Scholar]
- 7.Krishnan KM. IEEE Transactions on Magnetics. 2010;46:2523–2558. doi: 10.1109/TMAG.2010.2046907. [DOI] [PMC free article] [PubMed] [Google Scholar]
- 8.Saritas EU, Goodwill PW, Croft LR, Konkle JJ, Lu K, Zheng B, Conolly SM. Journal of Magnetic Resonance. 2013;229:116–126. doi: 10.1016/j.jmr.2012.11.029. [DOI] [PMC free article] [PubMed] [Google Scholar]
- 9.Pablico-Lansigan MH, Situ SF, Samia ACS. Nanoscale. 2013;5:4040–4055. doi: 10.1039/c3nr00544e. [DOI] [PubMed] [Google Scholar]
- 10.Khandhar AP, Ferguson RM, Arami H, Krishnan KM. Biomaterials. 2013;34:3837–3845. doi: 10.1016/j.biomaterials.2013.01.087. [DOI] [PMC free article] [PubMed] [Google Scholar]
- 11.Khandhar AP, Keselman P, Kemp SJ, Ferguson RM, Goodwill PW, Conolly S, Krishnan KM. Nanoscale. 2017;9:1299–1306. doi: 10.1039/c6nr08468k. [DOI] [PMC free article] [PubMed] [Google Scholar]
- 12.Yu E, Bishop M, Zheng B, Ferguson R, Khandhar A, Kemp S, Krishnan KM, Goodwill PW, Conolly SM. Nano Letters. 2017;17:1648–1654. doi: 10.1021/acs.nanolett.6b04865. [DOI] [PMC free article] [PubMed] [Google Scholar]
- 13.Orendorff R, Peck AJ, Zheng B, Shirazi SN, Ferguson RM, Khandhar AP, Kemp SJ, Goodwill P, Krishnan KM, Brooks GA, Kaufer D, Conolly S. Physics in Medicine and Biology. 2017;62:3501. doi: 10.1088/1361-6560/aa52ad. [DOI] [PMC free article] [PubMed] [Google Scholar]
- 14.Zhou XY, Jeffris KE, Yu Elaine, Zheng B, Goodwill PW, Nahid P, Conolly SM. Physics in Medicine and Biology. 2017;62:3510. doi: 10.1088/1361-6560/aa616c. [DOI] [PMC free article] [PubMed] [Google Scholar]
- 15.Zheng B, Marc P, Yu E, Gunel B, Lu K, Vazin T, Schaffer DV, Goodwill PW, Conolly SM. Theranostics. 2016;6:291–301. doi: 10.7150/thno.13728. [DOI] [PMC free article] [PubMed] [Google Scholar]
- 16.Zheng B, Lu K, Konkle JJ, Hensley DW, Keselman P, Orendorff RD, Tay ZW, Yu E, Zhou XY, Bishop M, Gunel B, Taylor L, Ferguson RM, Khandhar AP, Kemp SJ, Krishnan KM, Goodwill PW, Conolly SM. Design and Applications of Nanoparticles in Biomedical Imaging. Springer; 2017. pp. 69–93. [Google Scholar]
- 17.Tomitaka A, Arami H, Gandhi S, Krishnan KM. Nanoscale. 2015;7:16890–16898. doi: 10.1039/c5nr02831k. [DOI] [PMC free article] [PubMed] [Google Scholar]
- 18.Ferguson RM, Khandhar A, Arami H, Hua L, Hovorka O, Krishnan KM. Biomedical Engineering (Biomedizinische Technik) 2013:1–15. doi: 10.1515/bmt-2012-0058. [DOI] [PMC free article] [PubMed] [Google Scholar]
- 19.Goodwill PW, Conolly SM. IEEE Transactions on Medical Imaging. 2011;30:1581–1590. doi: 10.1109/TMI.2011.2125982. [DOI] [PMC free article] [PubMed] [Google Scholar]
- 20.Arami H, Ferguson RM, Khandhar AP, Krishnan KM. Medical Physics. 2013;40:071904. doi: 10.1118/1.4810962. [DOI] [PMC free article] [PubMed] [Google Scholar]
- 21.Arami H, Krishnan KM. Journal of Applied Physics. 2014;115:17B306. doi: 10.1063/1.4867756. [DOI] [PMC free article] [PubMed] [Google Scholar]
- 22.Kemp SJ, Ferguson RM, Khandhar AP, Krishnan KM. RSC Advances. 2016;6:77452–77464. [Google Scholar]
- 23.Hufschmid R, Arami H, Ferguson RM, Gonzales M, Teeman E, Brush LN, Browning ND, Krishnan KM. Nanoscale. 2015;7:11142–11154. doi: 10.1039/c5nr01651g. [DOI] [PMC free article] [PubMed] [Google Scholar]
- 24.Arami H, Krishnan KM. IEEE Transactions on Magnetics. 2013;49:3500–3503. doi: 10.1109/TMAG.2013.2245110. [DOI] [PMC free article] [PubMed] [Google Scholar]
- 25.Kievit FM, Veiseh O, Bhattarai N, Fang C, Gunn JW, Lee D, Ellenbogen RG, Olson JM, Zhang MQ. Advanced Functional Materials. 2009;19:2244–2251. doi: 10.1002/adfm.200801844. [DOI] [PMC free article] [PubMed] [Google Scholar]
- 26.Arami H, Khandhar AP, Tomitaka A, Yu E, Goodwill PW, Conolly SM, Krishnan KM. Biomaterials. 2015;52:251–261. doi: 10.1016/j.biomaterials.2015.02.040. [DOI] [PMC free article] [PubMed] [Google Scholar]
- 27.Arami H, Khandhar A, Liggitt D, Krishnan KM. Chemical Society Reviews. 2015;44:8576–8607. doi: 10.1039/c5cs00541h. [DOI] [PMC free article] [PubMed] [Google Scholar]
- 28.Saatchi K, Tod SE, Leung D, Nicholson KE, Andreu I, Buchwalder C, Schmitt V, Häfeli UO, Gray SL. Nanomedicine: Nanotechnology, Biology, and Medicine. 2017;13:559–568. doi: 10.1016/j.nano.2016.08.012. [DOI] [PubMed] [Google Scholar]
- 29.Misri R, Saatchi K, Hafeli UO. Nanomedicine. 2012;7:719–733. doi: 10.2217/nnm.12.32. [DOI] [PubMed] [Google Scholar]
- 30.Kumari S, Ahsan SM, Kumar JM, Kondapi AK, Rao NM. Scientific Reports. 2017;7:6602. doi: 10.1038/s41598-017-06888-4. [DOI] [PMC free article] [PubMed] [Google Scholar]
- 31.Kievit FM, Stephen ZR, Veiseh O, Arami H, Wang TZ, Lai VP, Park JO, Ellenbogen RG, Disis ML, Zhang MQ. Acs Nano. 2012;6:2591–2601. doi: 10.1021/nn205070h. [DOI] [PMC free article] [PubMed] [Google Scholar]
- 32.Ferguson RM, Khandhar AP, Krishnan KM. Journal of Applied Physics. 2012;111:07B318. doi: 10.1063/1.3676053. [DOI] [PMC free article] [PubMed] [Google Scholar]
- 33.Cole AJ, David AE, Wang JX, Galban CJ, Hill HL, Yang VC. Biomaterials. 2011;32:2183–2193. doi: 10.1016/j.biomaterials.2010.11.040. [DOI] [PMC free article] [PubMed] [Google Scholar]
Associated Data
This section collects any data citations, data availability statements, or supplementary materials included in this article.


