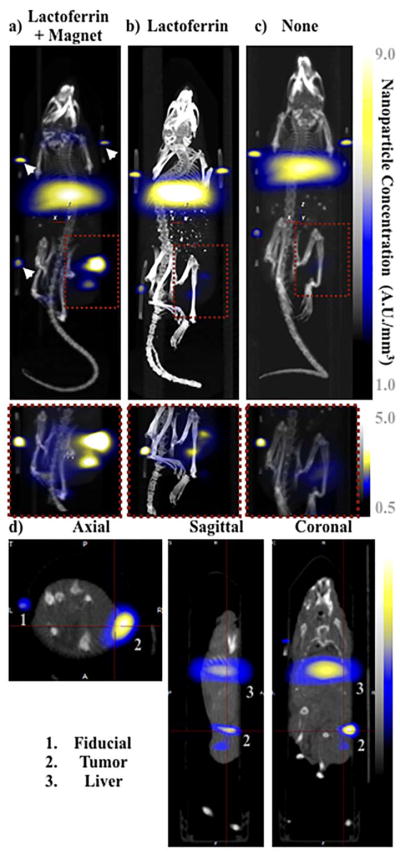
Fig. 4.
MPI images of the mice with tumor xenografts. Two-dimensional (2D) MPI/CT images (2h post-injection) of mice injected with Cy5.5-Lactoferrin conjugated NPs, with (a) and without (b) a permanent magnet placed adjacent to the tumor xenograft on the right side flank, compared with mice injected with Cy5.5-labeled NPs, without using lactoferrin and magnetic targeting (c). The tumors are marked with the red squares. Rescaled images are shown below each mouse to highlight the tumors. Three fiducial (white arrowheads in (a)) were used for registration of the MPI and CT images. Also see supporting videos 1–3, showing the three dimensional tumor images. Axial, sagittal and coronal images through the tumor for mouse (a) are shown in (d). The liver can also be seen in the sagittal and the coronal images.

