

Abstract
The hierarchical nature of the brain's functional organization has long been recognized, but when and how this architecture emerges during development remains largely unknown. Here the development of the brain's hierarchical organization was characterized using a modified stepwise functional connectivity approach based on resting‐state fMRI in a fully longitudinal sample of infants (N = 28, with scans after birth, and at 1 and 2 years) and adults. Results obtained by placing seeds in early sensory cortices revealed novel hierarchical patterns of adult brain organization ultimately converging in limbic, paralimbic, basal ganglia, and frontoparietal brain regions. These findings are remarkably consistent with predictive coding accounts of neural processing that place these regions at the top of predictive coding hierarchies. Infants gradually developed toward this architecture in a region‐ and step‐dependent manner, and displayed many of the same regions as adults in top hierarchical positions, starting from 1 year of age. The findings further revealed patterns of inter‐sensory connectivity likely reflecting the emergence and development of multisensory processing strategies during infancy, the strengths of which were correlated with early cognitive development scores. Hum Brain Mapp 38:2666–2682, 2017. © 2017 Wiley Periodicals, Inc.
Keywords: early brain development, hierarchical brain organization, stepwise functional connectivity, sensory integration, predictive coding
INTRODUCTION
The hierarchical nature of the brain's functional organization has long been recognized [Damasio, 1989; Mesulam, 1998]. This architecture can be broadly described as starting from early sensory processing and ascending through successive levels of sensory abstraction and gradual inter‐sensory convergence, such that the most multimodal cortices are situated toward the top of the hierarchy. This organizational scheme facilitates the integrated and reciprocal communication across sensory and higher‐order networks necessary for perceptual binding, detection of redundant inter‐sensory properties, and the learning, representation and retrieval of conceptual knowledge [Bahrick and Lickliter, 2000; Damasio, 1989; Driver and Noesselt, 2008; Fernandino et al., 2016; Man et al., 2013]. A pioneering study from Sepulcre et al. investigated this architecture in the resting brain using a novel stepwise functional connectivity (SFC) technique. Their results revealed stepwise organization that gradually transitioned from seed‐specific sensory networks to “hub” regions frequently implicated in cognitive processing, providing new insights into the hierarchical organization of the resting brain.
The development of this hierarchical organization in infants remains unexplored. Using conventional resting‐state functional connectivity approaches [Biswal et al., 1995] we previously characterized the emergence and growth of a range of the brain's functional networks during the first years of life, revealing that the development of sensory networks precedes that of higher‐order networks [Gao et al., 2016]. While this study revealed early segregation of sensory systems, another study demonstrated gradual segregation of thalamocortical connectivity during the first 2 years of life [Alcauter et al., 2014]. However, no study that we are aware of has explicitly examined the development of inter‐sensory network integration, likely because conventional functional connectivity is not able to detect such convergence if it occurs through multistep functional connections. Therefore, uncovering functional connections beyond direct links and exploring when and how adult‐like hierarchical organization emerges may provide unprecedented information about brain development, particularly as it relates to sensory integration and cognitive development.
To this end, we modified the approach of Sepulcre et al. [2012] to deterministically search for the shortest path lengths linking any two regions in the brain, and applied our modified SFC method (mSFC) to characterize the development of the brain's hierarchical architecture, grounded by seeds in sensorimotor (SM), auditory (AUD), and visual (VIS) cortices. A seed in the posterior cingulate cortex (PCC) was also included for comparison. Data from 28 infants with complete 3‐point longitudinal resting‐state functional magnetic resonance imaging (rsfMRI) scans were used in this study, minimizing the effects of inter‐subject variability on our developmental findings. RsfMRI data from 198 adult subjects were also included for comparison. Based on our previous observation of symmetrical, adult‐like sensory networks in neonates [Gao et al., 2009b, 2014a], we hypothesized that one‐step direct connectivity would mature earlier than greater step‐distance connections in infants for all three sensory seeds. We also expected the PCC seed to display prolonged developmental trajectories for all mSFC steps when compared with sensory seeds [Gao et al., 2009b]. Given recent SFC findings reflecting sensory integration analogs in adults [Sepulcre, 2014; Sepulcre, 2015; Sepulcre et al., 2012], and evidence supporting the protracted and incremental development of sensory integration abilities across childhood [Burr and Gori, 2012], we further hypothesized the varied and gradual emergence of sensory integration analogs in infants across different sensory seed pairings. Finally, we hypothesized that the degree of inter‐sensory convergence would reflect the ease of inter‐sensory communication, and should correlate with infants' behavioral development. These hypotheses were supported by our results, which also revealed patterns of final‐step SFC convergence that, to the best of the authors' knowledge, have not been previously reported and are remarkably consistent with predictive coding models of learning and brain function [Barrett and Simmons, 2015; Chanes and Barrett, 2016].
MATERIALS AND METHODS
Participants
Infants
This study was part of a larger project examining brain development in healthy and at‐risk infants [Alcauter et al., 2013; Alcauter et al., 2014; Gao et al., 2009b; Gilmore et al., 2012; Short et al., 2013]. Resting state fMRI data were collected from naturally sleeping infants with neuropsychological assessments at 1 and 2 years of age. Healthy infants who passed rsfMRI quality screening at all three data collection points (i.e., neonatal, 1 year, and 2 years), completed at least one neuropsychological assessment, and were free from any excluding factors were retrospectively identified from the larger sample. Functional scans were determined to meet quality requirements if at least 90 volumes remained after motion scrubbing and visual inspection confirmed successful alignment with anatomical scans. Exclusion criteria included chromosomal or major congenital abnormalities, NICU stay more than 1 day, significant maternal or neonatal illness, and maternal drug use. When twins qualified for this study, one of the pair was randomly selected and the other excluded from further analysis. This procedure resulted in the identification of the 28 healthy infants (16 F) included in this study (see Supporting Information Table SI for maternal and infant birth statistics). The parents of all participating infants provided informed written consent in compliance with the institutional review board at the University of North Carolina at Chapel Hill.
Adults
RsfMRI data from 198 healthy adults (123 F, 18–30 years) were downloaded from the “Cambridge Buckner” dataset, part of the publicly available 1,000 Functional Connectomes Project (http://fcon_1000.projects.nitrc.org).
Data Acquisition
Infant imaging data acquisition
Infants were scanned soon after birth, at 1, and at 2 years of age (Supporting Information Table SI) using a Siemen's 3T MRI system. Infants were fed, swaddled, and fitted with ear protection prior to scanning. T2*‐weighted functional images were acquired for 5 minutes using a gradient‐echo echo‐planar sequence (TR = 2,000 ms, TE = 32 ms, 33 4‐mm slices, voxel size = 4 mm3, 150 volumes) and structural images were acquired with a T1‐weighted magnetization‐prepared rapid acquisition gradient echo sequence (TR = 1,820 ms, TE = 4.38 ms, IT = 1,100 ms, 144 1‐mm slices, voxel size = 1 mm3).
Adult imaging data acquisition
According to the Functional Connectomes Project documentation, 119 functional volumes for each subject were collected on a 3T scanner using a T2*‐weighted sequence (TR = 3,000 ms, 47 slices) for approximately 6 minutes.
Behavioral data acquisition
The Mullen Scales of Early Learning (MSEL) [Mullen, 1995] neuropsychological assessment was administered to infants at 1 and 2 years of age (Supporting Information Table SI). Three infants did not complete testing at 2 years. The MSEL consists of five subscales including Gross Motor, Fine Motor, Visual Reception, Expressive Language, and Receptive Language domains. Not including the Gross Motor domain, these MSEL subscales can be combined to produce a cognitive composite score indexing general cognitive development.
Data Analysis
Preprocessing
To ensure steady‐state magnetization, the first 10 volumes were discarded from further analysis. Functional volumes were corrected for differences in slice acquisition time, co‐registered, aligned to the T1‐weighted anatomical volume, and bandpass filtered from 0.01 to 0.08 Hz. Volumes with greater than 0.5% signal change and 0.5 mm framewise displacement (FD) were excluded from analysis (i.e., data scrubbing) [Power et al., 2012]. Resting state fluctuations in blood oxygenation were examined only after covariates of noninterest were accounted for by means of least squares regression. These covariates of noninterest included translation and rotation parameters obtained from the alignment routine, as well as signal fluctuations from white matter, cerebral spinal fluid, and the global signal. To test the influence of global signal regression (GSR) on our results, we also performed mSFC analysis without this step and compared those results with our primary findings. Moreover, we also tested the robustness of our findings against different motion correction procedures by comparing our results with those obtained using a more stringent motion scrubbing threshold of FD less than 0.3 mm. Infant and adult data were normalized to the UNC Infant Atlas [Shi et al., 2011] and MNI template space and resampled to 6 and 8 mm3 voxels, respectively.
Stepwise functional connectivity analysis
Time series for each grey matter voxel were correlated with those from the rest of the brain, resulting in an N * N Pearson's correlation coefficient matrix for each subject (N = 4,403 voxels for infants in UNC atlas space and 3,404 voxels for adults in MNI space). Given the potential controversy of interpreting negative correlations after GSR [Murphy et al., 2009], we chose to remove negative correlations from further analysis and the remaining positive coefficients were thresholded at r > 0.5 and binarized. SFC was calculated from these individual, binarized matrices for each of 4 voxels belonging to a seed. Seeds were placed in early VIS, AUD, and SM cortices (i.e., along the calcarine sulcus, Heschl's gyrus, and the central sulcus, respectively), as well as in the PCC for comparison, for both infants and adults. These adult seed locations overlap with the peaks of their canonical resting‐state networks identified by spatial ICA in a very large sample of adults [Allen et al., 2011]. Homologous infant seeds were defined by nonlinear warping of the adult seeds, but were modified slightly to maintain uniform voxel counts and geometry across seeds for consistency in SFC calculation. Center of mass coordinates for each adult seed in MNI space were: VIS (x = −4, y = −78, z = 10), AUD (x = −48, y = −22, z = 6), SM (x = −36, y = −22, z = 58), and PCC (x = −4, y = −54, z = 34).
Similar to Sepulcre et al., we aimed to quantify the number of links connecting a given voxel with the seed at a particular step length. However, in their original implementation recurrent pathways were allowed to cross the seed regions multiple times, which was not allowed by our modified approach. Instead, our approach involved a deterministic search for the shortest paths linking a target voxel with a seed, based on findings at the systems [van den Heuvel and Sporns, 2011] and cellular [Nigam et al., 2016] levels that support an economic model of brain organization. Specifically, the proposal of economic organization argues that minimizing the cost of neural communication (i.e., connections) is one of the determining features of the brain's organization [Bullmore and Sporns, 2012]. In our modified SFC approach, for each target voxel we first determined whether it was directly correlated with the seed voxel (r > 0.5). If this was the case, the search stopped; if not, the search continued by searching for 2‐step links connecting the target voxel with the seed. This process continued until a step linking the target voxel with the seed was identified. This procedure ensured that only the shortest paths were used to quantify the connectivity strength between a target voxel and the seed. Hence, our mSFC calculation involved a deterministic search for the shortest path lengths between any pair of voxels, which was different from previous methods [Sepulcre et al., 2012]. For each subject, every voxel only corresponded to a single step‐distance from the seed, and the number of paths at this step length connecting that voxel with the seed was calculated for each seed (i.e., the average of the four seed voxels) and each subject as a measure of the strength of connectivity at that step. In preparation for the group‐level analysis these maps were z‐score normalized and spatially smoothed using an 8 (infants) or 10 (adults) mm FWHM Gaussian kernel. Note that throughout this article “direct connectivity” refers only to functional correlations and should not be interpreted herein as indicating monosynaptic connectivity.
Group statistical maps
Individual z‐maps served as input for group‐level voxelwise one‐sample t‐tests to detect significance. The most robust connections were detected in infants (N = 28) using P < 0.01, FDR corrected [Benjamini and Yekutieli, 2001]. Given the difference in sample size between infants and adults, a bootstrapping technique was employed in the adult sample in which t‐tests were performed for 28 randomly selected adults 1000 times. The adult mSFC maps were defined by those voxels showing significance (P < 0.01, FDR corrected) at the group level and for at least 95% of 1,000 iterations.
Infant step maturity and developmental trajectory
Unthresholded adult mean z‐maps were warped to infant UNC template space by first applying 12‐parameter affine alignment followed by nonlinear warping using AFNI's 3dQwarp program. These warped maps were correlated with infant z‐maps to determine how similar each infant's SFC maps were at each age to the adult average. These coefficients served as “maturation scores” and were entered into linear mixed‐effect regression models to determine the best model to describe the longitudinal relationship between days of age and network maturity. Linear, log‐linear, and quadratic models for age were tested, with intercept (subject) and slope as random factors. Several covariates of noninterest were included in these models, including years of maternal education, twin status, birth weight, residual framewise displacement after motion censoring, and scanner. The Akaike information criterion was used to determine the best of the models tested.
Repeated measures ANOVAs were also performed for each seed to test whether age at scan and step affected mSFC map maturity coefficients. Significance of main effects was defined as P < 0.05 after FDR correction and post‐hoc comparisons were thresholded at P < 0.01, Dunn–Sidak adjusted.
Inter‐sensory convergence of mSFC
Inter‐sensory convergence of mSFC across sensory modalities were detected by examining spatial overlap at each step across all three statistically thresholded SFC maps (AUD ∩ SM ∩ VIS), and across all pairwise comparisons (i.e., AUD ∩ SM only, AUD ∩ VIS only, SM ∩ VIS only).
Inter‐sensory connection densities and cognitive performance
To determine whether a relationship exists between inter‐sensory communication and cognitive performance, inter‐sensory connection densities were calculated by averaging the number of n Step connections between the seeds of interest and their group‐defined intersecting voxels. This inter‐sensory connection density measure was then correlated with adjusted MSEL cognitive composite scores. Significance was defined by P < 0.01.
RESULTS
Hierarchical Brain Organization in Adults and its Development in Infants
We designed and applied a modified SFC approach to characterize the hierarchical organization of the brain in cohorts of 198 adults and 28 infants, each infant with three longitudinal scans during the first 2 years of life (i.e., soon after birth, at 1, and at 2 years, Supporting Information Table SI). Different from Sepulcre et al. [2012], our mSFC approach was designed to deterministically quantify the number of shortest pathways connecting a seed voxel with a target voxel without allowing the pathways to cross the seed multiple times, in line with the economic organization assumption of the brain [Bullmore and Sporns, 2012]. For ease of description we will use the term “network” in our results to refer to regions routinely identified as connected using conventional functional connectivity methods (e.g., seed‐based correlation analysis).
As expected, adult Step 1 connectivity maps generally displayed patterns consistent with each seed's conventional functional connectivity networks (Figs. 1, 2, 3, 4; Supporting Information Figs. S1–S4). Step 2 connectivity maps for AUD and SM seeds showed additional reciprocal connectivity with each other's Step 1 networks, while the VIS seed expanded its connectivity beyond Step 1 to include regions resembling the dorsal and ventral visual attention networks [Corbetta and Shulman, 2002; Corbetta et al., 2008], including bilateral intraparietal sulci, frontal eye fields, the right ventral inferior frontal gyrus, and the right supramarginal gyrus (SMG) (Fig. 3b). The PCC seed's Step 2 connectivity was very similar to its pattern from Step 1, which was primarily within areas belonging to the default mode network (DMN) [Raichle et al., 2001], but also included bilateral superior frontal gyri—major components of the salience network (SN)—and the middle frontal gyrus and dorsal SMG/superior parietal lobule (SPL)—comprising much of the executive control network (ECN) [Seeley et al., 2007]. Hence, Step 2 mSFC featured both within‐network connectivity and connectivity that expanded to other sensory networks (e.g., AUD connectivity with sensorimotor cortex), or in the case of the PCC seed, to other higher‐order networks. For Step 3, connectivity for all sensory seeds converged on regions belonging to the DMN, SN, and ECN. The PCC seed presented the inverse pattern, connecting with auditory, visual, and sensorimotor cortices. New, reciprocal Step 3 connectivity patterns were also detected between AUD and SM seeds with visual cortices, and between the VIS seed with auditory and sensorimotor cortices. Hence, although new connectivity emerged across sensory networks for Step 3 (similar to Step 2), its most differentiating feature was new connectivity that emerged between sensory networks and higher‐order networks, and vice versa for the PCC seed. Step 4 mSFC patterns remained mostly within higher‐order networks for the sensory seeds, but also developed new connectivity with the limbic, paralimbic, and basal ganglia regions. The PCC seed demonstrated increased Step 4 connectivity with the insula. Together, these findings suggest that Step 4 mSFC of the sensory seeds is best described by connectivity extending beyond that observed for Step 3 to include limbic, paralimbic, and basal ganglia regions. No significant mSFC beyond Step 4 were detected.
Figure 1.
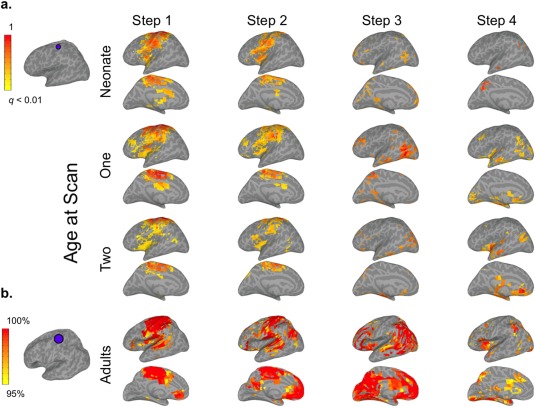
mSFC of the sensorimotor (SM) seed in left hemispheres of infants and adults (see Supporting Information Fig. S1 for right hemisphere). (a) The SM seed in infant template space is shown on the left. Infant results (right) are thresholded at P < 0.01 (FDR corrected) and scaled to the maximum t‐value. (b) The adult SM seed is displayed to the left of adult maps, which are scaled to show mSFC that was significant (P < 0.01, FDR corrected) at the group level and for at least 95% of 1,000 iterations, including 28 randomly‐selected adults for each iteration. [Color figure can be viewed at http://wileyonlinelibrary.com]
Figure 2.
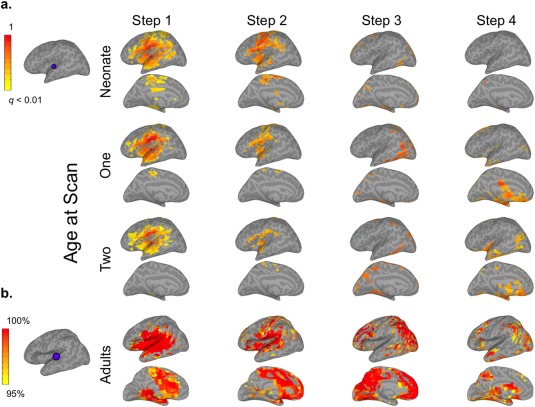
mSFC of the auditory (AUD) seed in infants and adults (see Supporting Information Fig. S2 for right hemisphere). (a) The AUD seed in infant template space is shown on the top left. Infant results (right) are thresholded at P < 0.01 (FDR corrected) and scaled to the maximum t‐value. (b) The adult AUD seed is displayed to the left of adult maps, which are scaled to show mSFC that was significant (P < 0.01, FDR corrected) at the group level and for at least 95% of 1000 iterations, including 28 randomly‐selected adults for each iteration. [Color figure can be viewed at http://wileyonlinelibrary.com]
Figure 3.
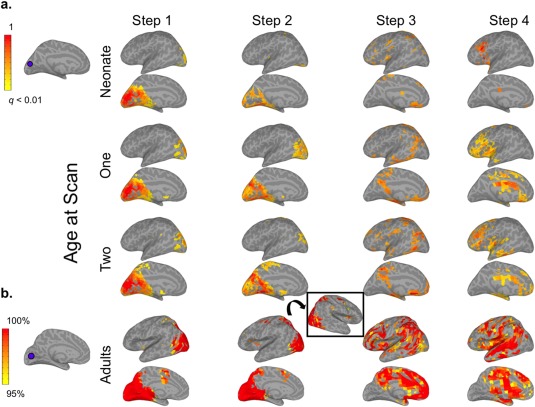
mSFC of the visual (VIS) seed in infants and adults (see Supporting Information Fig. S3 for right hemisphere). (a) The VIS seed in infant template space is shown on the top left. Infant results (right) are thresholded at P < 0.01 (FDR corrected) and scaled to the maximum t‐value. (b) The adult VIS seed is displayed to the left of adult maps, which are scaled to show mSFC that was significant (P < 0.01, FDR corrected) at the group level and for at least 95% of 1,000 iterations, including 28 randomly‐selected adults for each iteration. Step 2 inset shows visual attention networks in the right hemisphere. [Color figure can be viewed at http://wileyonlinelibrary.com]
Figure 4.
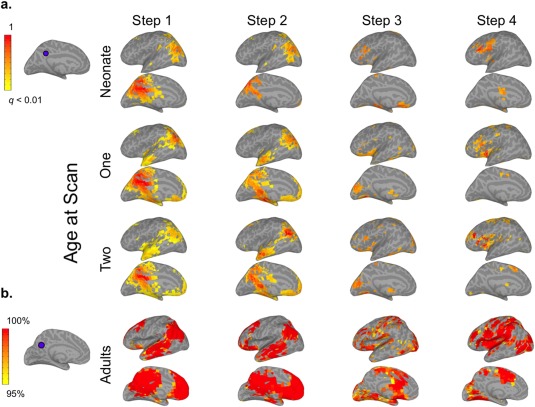
mSFC of the posterior cingulate cortex (PCC) seed in infants and adults (see Supporting Information Fig. S4 for right hemisphere). (a) The PCC seed in infant template space is shown on the top left. Infant results (right) are thresholded at P < 0.01 (FDR corrected) and scaled to the maximum t‐value. (b) The adult VIS seed is displayed to the left of adult maps, which are scaled to show mSFC that was significant (P < 0.01, FDR corrected) at the group level and for at least 95% of 1,000 iterations, including 28 randomly‐selected adults for each iteration. [Color figure can be viewed at http://wileyonlinelibrary.com]
Infants' mSFC maps generally followed similar trends of propagation when compared with adults, but their spatial topologies were much less mature, especially for Steps 2–4 (Figs. 1, 2, 3, 4; Supporting Information Figs. S1–S4). Specifically, infants' Step 1 sensory networks displayed the most adult‐like patterns, and this was the case even for the earliest neonatal scan. This finding is consistent with previous work using conventional connectivity approaches establishing bilateral network connectivity very early in development [Fransson et al., 2011; Gao et al., 2009b, 2014a]. Exceptions to this included connectivity with midline regions, especially for SM and AUD seeds, which were observed in adults but not detected to the same extent for infants at any age. Other exceptions included limited connectivity of neonates' VIS seed with the lateral occipital lobe and minimal connectivity of their PCC seed with frontal and temporal lobes; both of these seeds, however, developed more adult‐like connectivity by infants' first‐year scans. Step 2 maps for the three sensory seeds did not show marked changes from Step 1. The development of infants' Step 2 connectivity for the PCC seed largely resembled its Step 1 progression. In contrast to adults' extensive Step 3 connectivity—covering regions comprising DMN, SN, and ECNs for the sensory seeds and the sensory networks for the PCC seed—infants' Step 3 patterns were much less extensive, but showed age‐dependent expansion in qualitatively similar areas. This was especially apparent for infants' VIS seed, which showed increasingly adult‐like connectivity with the ventromedial prefrontal cortex, posterior cingulate, and lateral temporo‐parietal regions with age. Similarly, infants' Step 4 connectivity, which was nearly undetectable at birth, developed with age to include many of the same limbic and subcortical regions as adults, starting from 1 year.
To more objectively delineate the growth of mSFC in infants we calculated their “maturation scores,” which were based on the degree of similarity between each infant's mSFC map for each age‐seed‐step combination and the corresponding group‐level adult map. Longitudinally, PCC Steps 1 through 4 [b = 0.08/0.12/0.06/0/06, t(77) = 4.72/6.03/4.88/3/39, P < 0.001/<0.001/<0.001/=0.001]), and VIS Steps 1 and 3 [b = 0.05/0.06, t(77) = 3.33/5.56, P = 0.001/<0.001] demonstrated log‐linear growth (Supporting Information Fig. S5). VIS Steps 2 and 4 showed log‐linear trends [b = 0.06/0.05, t(77) = 2.43/1.88, P = 0.017/0.063]. No other significance was detected. We further conducted repeated measures ANOVAs to test the main effects of age and step on maturation scores for each seed. Our results indicated main effects of age for VIS [F(2,54) = 9.15, P < 0.001) and PCC (F(2,54) = 22.61, P < 0.001] seeds. Main effects of step were detected for all seeds [AUD: F(3,81) = 47.76; SM: F(3,81) = 139.87; VIS: F(3,81) = 16.81; PCC: F(3,81) = 34.6957, all P < 0.001] and post‐hoc tests (P < 0.01, Dunn–Sidak adjusted) revealed that Step 1 was more mature than Steps 2, 3, and 4 for all sensory seeds and Step 3 was more mature than Steps 2 and 4 for AUD and SM seeds. Results for the PCC seed indicated that Step 1 was more mature than Steps 3 and 4 and Step 3 was more mature than Step 4. Note that while this metric serves as an index of how adult‐like infants' mSFC patterns were, null growth results should be interpreted with caution because age‐dependent maturational changes may have occurred during this period, but were not captured by increasingly adult‐like patterns.
Inter‐Sensory Convergence of mSFC Connectivity
Spatial overlap across mSFC maps was examined to reveal common connectivity for each step across all three sensory seeds (i.e., AUD ∩ SM ∩ VIS) and particular to sensory seed pairings (i.e., AUD ∩ SM only, AUD ∩ VIS only, and SM ∩ VIS only) (Figs. 5, 6, 7, 8, Supporting Information Table SII).
Figure 5.
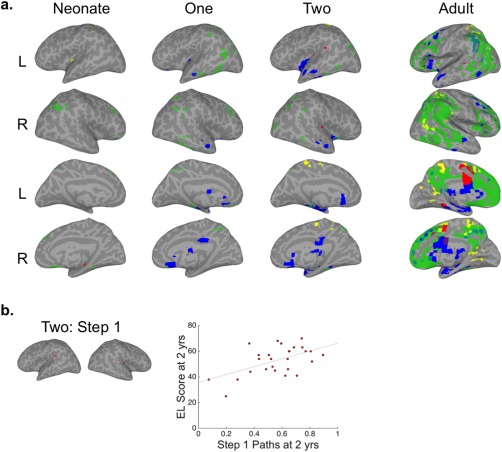
Convergence of mSFC for AUD‐VIS‐SM seeds. (a) Brain surfaces show the intersections of thresholded mSFC maps (see Figs. 1–3). Step 1 = red, Step 2 = yellow, Step 3 = green, and Step 4 = blue. (b) The intersection of AUD‐VIS‐SM Step 1 in infants at 2 years (left) and a scatter plot (right) showing the relationship between 2‐year‐old infants' mean inter‐sensory connection density and their Expressive Language scores (r = 0.54, P = 0.003) at 2 years. [Color figure can be viewed at http://wileyonlinelibrary.com]
Figure 6.
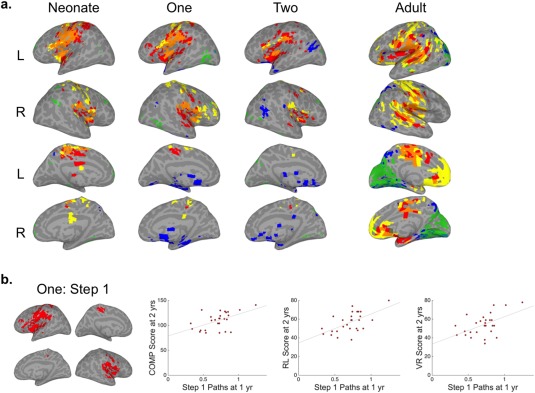
Convergence of mSFC for AUD‐SM seeds. (a) Brain surfaces show the intersections of thresholded mSFC maps (see Figs. 1 and 2). Step 1 = red, Step 2 = yellow, Step 3 = green, and Step 4 = blue. (b) The intersection of AUD‐SM Step 1 for infants at 1 year (left) and scatter plots (right) showing the relationship between 1‐year‐old infants' mean inter‐sensory connection density and their MSEL composite (r = 0.52, P = 0.005), Receptive Language (r = 0.59, P = 0.001), and Visual Reception (r = 0.52, P = 0.006) scores at 2 years. [Color figure can be viewed at http://wileyonlinelibrary.com]
Figure 7.
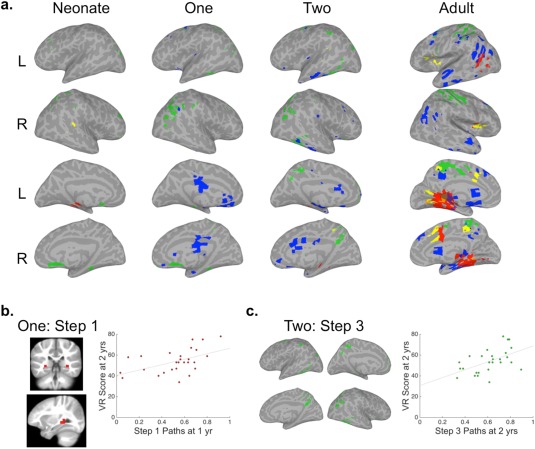
Convergence of mSFC for AUD‐VIS seeds. (a) Brain surfaces show the intersections of thresholded mSFC maps (see Figs. 2 and 3). Step 1 = red, Step 2 = yellow, Step 3 = green, and Step 4 = blue. (b) The intersection of AUD‐VIS Step 1 for infants at 1 year shown on coronal and sagittal slices in the volume (left) and a scatter plot (right) of the relationship between 1‐year‐old infants' mean inter‐sensory connection density and their Visual Reception (r = 0.51, P = 0.006) scores at 2 years. (c) The intersection of AUD‐VIS Step 3 in infants at 2 years (left) and a scatter plot (right) showing the relationship between 2‐year‐old infants' mean inter‐sensory connection density and their Visual Reception (r = 0.52, P = 0.005) scores at 2 years. [Color figure can be viewed at http://wileyonlinelibrary.com]
Figure 8.
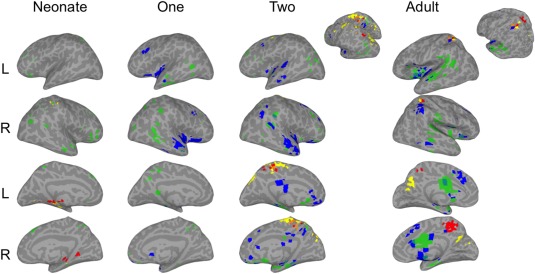
Convergence of mSFC for SM‐VIS seeds. Brain surfaces show the intersections of thresholded mSFC maps (see Figs. 1 and 3). Step 1 = red, Step 2 = yellow, Step 3 = green, and Step 4 = blue. [Color figure can be viewed at http://wileyonlinelibrary.com]
AUD ∩ VIS ∩ SM
For adults, as shown in Figure 5, all sensory seeds were directly connected to the mid‐cingulate/supplementary motor area (SMA) for Step 1. The intersection for Step 2 was minimal, with small areas of common mSFC in sensorimotor, SPL, retrosplenial, and right posterior middle temporal cortices. Step 3, on the other hand, showed extensive overlap in areas collectively resembling the DMN (i.e., medial prefrontal, posterior cingulate, postero‐lateral temporal, and lateral parietal cortices). Areas commonly connected across all sensory seeds for Step 4 included bilateral thalamus, left insula, basal ganglia (bilateral putamen and right caudate), limbic (amygdala and hippocampus), paralimbic (anterior temporal lobes, cingulate and parahippocampal gyri), lateral prefrontal, and left SMG cortices.
In infants, there was very little overlap across all sensory seeds for Steps 1 and 2, except for a small cluster of common Step 2 connectivity with the SMA at 2 years, which was also observed in adults. Small and scattered clusters of Step 3 overlap were distributed throughout temporal and parietal cortices, in the vicinity of the posterior nodes of the DMN. Common Step 4 connectivity across all sensory seeds was observed starting at 1 year and consisted of many of the areas observed for adults, including the anterior temporal lobes, insula, thalamus, basal ganglia, and limbic regions. Infants also had Step 4 connectivity in the subgenual/medial orbitofrontal area, which was not observed in adults.
AUD ∩ SM only
In adults, the AUD and SM seeds displayed the most extensive Step 1 overlap of any pairing (Fig. 6), which included mainly perisylvian areas (e.g., superior temporal gyri, parietal opercula, insulae, the left inferior frontal gyrus), but also some medial structures, including the hippocampi. Step 2 overlap was similar to Step 1, but with expansive connectivity with medial prefrontal cortices. Overlapping connectivity for Step 3 was mainly with the occipital lobe. Outside of those areas common to all three seeds, small clusters of additional Step 4 overlap were observed mostly in parietal and ventral temporal cortices.
Similar to the adults, overlap across AUD and SM seeds was the most extensive of any pairing for Steps 1 and 2 at all infant ages (Fig. 6). The spatial distributions for these early steps were generally comparable to the adult results. Noticeably missing, however, was the Step 2 connectivity with medial prefrontal cortex observed for adults. Step 3 connectivity with the medial visual cortex was minimal, developing by infants' second year scan. Step 4 connectivity, on the other hand, was more extensive for 1‐ and 2‐year‐old infants than adults and included clusters in posterior middle temporal gyri extending into occipital cortex that were not observed for adults.
AUD ∩ VIS only
Areas with Step 1 connectivity common to AUD and VIS seeds (Fig. 7) in adults included the left posterior superior temporal sulcus (pSTS) and bilateral ventral and ventromedial temporal lobes, including bilateral hippocampi. Step 2 overlap included small clusters located in the insulae, and Step 3 overlap consisted mainly of regions involved in somatosensory and motor processing. Lastly, the composition of Step 4 overlap generally expanded from that of AUD ∩ VIS ∩ SM, including greater coverage of the lateral anterior temporal lobes.
AUD‐VIS intersections for Steps 1 and 2 were almost entirely missing for infants at all ages (Fig. 7), except for Step 1 connectivity with the left hippocampus in neonates, which expanded to include the right hippocampus at 1 and 2 years. The largest clusters of Step 3 overlap in infants were observed in the right inferior parietal lobule, beginning at 1 year, and in the posterior cingulate, starting at 2 years. Step 4 overlap was most similar between infants and adults for this pairing, first evident at infants' 1‐year scan.
SM ∩ VIS only
For Steps 1 and 2 in adults the SM and VIS seeds were commonly connected to bilateral precuneus and SPLs (Fig. 8). Step 3 overlapped primarily in dorsal and ventromedial temporal lobes, insulae, and mid‐to‐anterior cingulate cortices. Finally, clusters of Step 4 overlap were observed in dorsal striatum, dorsomedial prefrontal cortex, and cortical regions reflecting the ECN.
The dorsal stream (i.e., SPL) areas observed for adults' Step 1 and 2 intersections were detected only in infants' second year scans (Fig. 8). Infants also developed adult‐like Step 3 connectivity with the left parahippocampal gyrus at 2. Finally, infants' SM and VIS seeds showed Step 4 overlap resembling that of adults, including connectivity with the insulae, middle frontal gyri, and anterior temporal lobes at 1 year, and with the right SMG and dorsomedial prefrontal cortex at 2 years.
mSFC–Behavior Relationships
To test the hypothesis that inter‐sensory communication is essential for cognitive development, correlation analyses were performed between inter‐sensory connection densities (i.e., individuals' mean number of n Step connections between the seeds of interest and their group‐defined intersecting voxels) and MSEL cognitive composite scores at 1 or 2 years. The mean number of AUD and SM seed connections with the AUD‐SM Step 1 intersection for infants at 1 year was related to MSEL composite scores at 2 years (r = 0.52, P = 0.005, Fig. 6b). A secondary analysis of the relationship between AUD‐SM Step 1 inter‐sensory connection densities in infants at 1 and the subscales administered at 2 years of age also revealed relationships with Receptive Language and Visual Reception scores (r = 0.59/0.52, P = 0.001/0.006, Fig. 6b). Other subscale relationships detected were between AUD‐VIS‐SM Step 1 inter‐sensory connection densities at 2 years and Expressive Language scores from the same year (r = 0.54, P = 0.003, Fig. 5b), AUD‐VIS Step 1 inter‐sensory connection densities at 1 year and Visual Reception scores at 2 (r = 0.51, P = 0.006, Fig. 7b), and AUD‐VIS Step 3 inter‐sensory connection densities at 2 years and Visual Reception scores from the same year (r = 0.52, P = 0.005, Fig. 7c) (Supporting Information Table SIII). Significant relationships were not detected for MSEL composite nor any of the subscales collected at 1 year.
DISCUSSION
In this study we applied an mSFC technique to characterize the brain's hierarchical functional organization in adults (N = 198) and its development during infancy (N = 28, all having three rsfMRI scans during the first 2 years of life). Our results revealed novel hierarchical architectures in the adult brain, which were generally immature for infants at birth, but showed seed and step‐dependent improvements with age. By examining areas that showed inter‐sensory convergence, we detected sensory integration “analogs” and other multimodal regions in infants and adults. Denser inter‐sensory connectivity in infants, especially within the perisylvian AUD‐SM Step 1 convergence region, displayed significant relationships with infant performance on MSEL behavioral assessments. Our results also placed limbic, paralimbic, basal ganglia, and ECN cortices at the top of sensory processing hierarchies in both adults and infants, supporting models that emphasize the importance of these regions for predictive coding [Barrett and Simmons, 2015; Chanes and Barrett, 2016; Langner et al., 2012].
Hierarchical Brain Organization in Adults and its Emergence in Infants
Our mSFC findings in adults provide a hierarchical perspective of the brain's functional organization, with many aspects aligning with and adding to previous reports. Seeds placed in early sensory cortices demonstrated successive levels of connectivity progressing from local and distributed sensory processing networks, reflected in Steps 1 and 2, to converging DMN, SN, and ECN regions for Step 3, and finally to limbic, paralimbic, and basal ganglia regions for Step 4. The successive progression and eventual convergence of mSFC across seeds in “cortical hub” regions, especially those comprising the DMN, is consistent with results reported by Sepulcre et al. [2012]. However, two major differences were observed: first, the number of steps employed to transition from early sensory areas to cortical hub regions was 3 in our study, while it was 5 or more in Sepulcre et al.—a difference likely due, at least in part, to our deterministic approach. Second, our results displayed robust Step 4 connectivity with limbic, paralimibic, and basal ganglia regions, while Sepulcre et al. [2012] did not report such connectivity, even for their furthest step‐distances. It is possible that these regions were difficult to detect using their approach, due to a background of recursive connections that were allowed to cross the seeds multiple times.
When compared with adults, infants' mSFC maps demonstrated qualitatively similar stepwise progression from sensory to cortical hub regions, but their Step 2, 3, and 4 maps were generally much less mature. The fact that Step 1 sensory maps resembled adult‐like topologies from their earliest neonatal scan is consistent with our previous findings using conventional functional connectivity approaches [Gao et al., 2014b]. In contrast, Step 1 maps for the PCC seed demonstrated connectivity largely confined to parietal areas in neonates, but that expanded to reflect mature network distributions at 1 and 2 years, which is also consistent with our previous work [Gao et al., 2009b, 2013]. For Steps 2 through 4, only VIS Step 3 demonstrated age‐related growth in maturity (VIS Steps 2 and 4 showed trends of growth). The lack of age‐dependent growth in adult‐like network connectivity for SM and AUD seeds has also been reported [Gao et al., 2014b]. These findings suggest different growth trajectories between AUD/SM and VIS functional connectivity with the latter demonstrating more deterministic growth toward adult‐like topologies during the first 2 years of life. However, it should also be emphasized that although AUD and SM seeds did not demonstrate increasingly adult‐like patterns with age, this should not be interpreted as the complete absence of developmental changes for these systems; rather, developmental changes may have occurred during this period that were not effectively captured by comparing infant with adult connectivity patterns. Similar to the VIS seed, PCC Steps 2–4 also showed consistent age‐dependent increases in maturity. Overall, given that Step 1 regions mainly reside in the vicinity of or homologous to the seed area, the lack of multistep links early in development may reflect immature myelination of long‐distance structural connections. However, since the major development of myelination concludes during the first year [Gao et al., 2009a; Girard et al., 1991], subsequent immaturity of multi‐step links is likely related more to infants' functional brain organization.
Inter‐Sensory Convergence for Steps 1 and 2 and its Relationship with Cognitive Performance in Infants
The inter‐sensory convergence analysis revealed regions commonly connected to more than one sensory seed, which, in several instances for Steps 1 and 2, paralleled regions routinely reported as having sensory integration properties. In several instances infants' inter‐sensory connection densities were related to their behavioral performance on scales relying on inter‐sensory coordination respective to the intersection. Hence, the possibility that these early steps provide insight into the development of sensory integration capabilities in infants is intriguing.
Among all inter‐sensory pairs, AUD‐SM demonstrated the most extensive and adult‐like overlap starting from the neonatal period, which is consistent with the relatively early fetal development of auditory and motor functions [Hepper and Shahidullah, 1994]. A detailed examination of this AUD‐SM intersection revealed exciting clues about the brain basis of early language development. Among the perisylvian regions observed for adult AUD‐SM Step 1 overlap included the sylvian‐parietal‐temporal area (Spt). As a component of the auditory dorsal stream, area Spt performs key audio‐motor integration functions for speech, linking internal phonological representations in the superior temporal gyrus with regions involved in articulation in the ventral frontal lobe via the arcuate fasciculus [Foxe et al., 2002; Hickok et al., 2009, 2011]. The observation of common Spt connections in SM and AUD Step 1 maps starting from infants' neonatal scan is not entirely surprising given structural connectivity data demonstrating neonatal connectivity between the superior temporal gyrus and premotor cortex [Brauer et al., 2013; Perani et al., 2011], a finding in contrast to other language‐related tracts that develop much later [Brauer et al., 2013]. While Spt's role is likely imperative for speech production, it also responds to speech perception in adults [Liebenthal et al., 2013; Okada and Hickok, 2006], and may be key for infants' development of subsequent speech production. Newborn infants are sensitive to perceptual aspects of speech [Newman et al., 2006; Vouloumanos et al., 2010], and their perceptual performance is predictive of vocabulary size at 2 years [Newman et al., 2006]. Further, very young children more accurately produce speech that occurs more frequently in their native languages [Munson, 2001; Zamuner et al., 2004], suggesting a perceptual influence on production. Therefore, AUD‐SM overlap in area Spt of neonates may reflect an innate mechanism to facilitate speech perception and later speech production. Consistent with this postulation, infants' AUD‐SM Step 1 inter‐sensory connection density at 1 year predicted MSEL composite, Receptive Language, and Visual Reception scores at 2 years. Performance on both of these tests at 2 years relied on infants' ability to successfully follow verbal instructions, recognizing concepts by their phonetic labels. Interestingly, infants AUD‐VIS‐SM Step 1 inter‐sensory connection density at 2 years, located exclusively in bilateral Spt, was predictive of Expressive Language scores at 2 years. This involvement of the VIS system—which occurred only at 2 years—and its importance for Expressive Language scores during the same period may indicate a unique role for the VIS system in auditory‐motor speech transformation (e.g., attention to mouths) during a period when infants are rapidly acquiring language abilities [Benedict, 1979; Fenson et al., 1994; Goldfield and Reznick, 1990; Schipke and Kauschke, 2010].
Adult AUD and VIS seeds shared direct connectivity with the pSTS, which has been frequently identified as an audiovisual integration area [Beauchamp et al., 2010; Miller and D'Esposito, 2005]. They also converged on the ventral temporal lobes, which have been implicated for linking speech sounds (phonology) with visual word forms in the left hemisphere [Cai et al., 2010; Conant et al., 2014; Hashimoto and Sakai, 2004; Mano et al., 2013; Price and Devlin, 2011] and possibly familiar voices with faces in the right [Blank et al., 2011; Von Kriegstein and Giraud, 2004; Von Kriegstein et al., 2005; Von Kriegstein et al., 2006]. However, only the hippocampus was detected in infants, suggesting that any sensory integration processing that occurs outside of the hippocampus emerges relatively late. It has been argued that much of the early evidence in support of audiovisual speech integration in infants can be explained by infants performing other forms of sensory association, rather than integration per se [Shaw and Bortfeld, 2015], a perspective that aligns with our discrepant findings between infants and adults in the pSTS. One possibility supported by our results is that VIS connectivity with Spt at 2 years, which is related to language production, informs the subsequent development of audiovisual integration in nearby pSTS. If audiovisual connectivity with the ventral temporal lobe develops with the acquisition of reading skills, then it makes sense that infants would not display these same patterns. However, the AUD‐VIS Step 1 intersection in adults also extended medially, including the hippocampi, which infants also showed, focally, from their neonatal scan. Moreover, the AUD‐VIS inter‐sensory connection density within the bilateral hippocampi of infants at 1 year predicted Visual Reception scores at 2 years. This finding suggests that the hippocampi of infants are involved in the type of audiovisual coordination or integration necessary to perform well on a scale that relies on audiovisual instruction for some of its visual discrimination and/or matching items. In several instances the inter‐sensory connection densities at 1 were predictive of behavioral performance at 2, but these relationships, although in the same direction, did not maintain the same level of significance for infant scans at 2 years (see Supporting Information Table SIII). One possibility is that the density of connections at 1 reflects a critical period, for which high levels of connectivity lay the groundwork for subsequent organization and functioning.
Although the primary goal of our behavioral analysis was to examine whether the seeds' inter‐sensory connection density—which may reflect inter‐sensory communication or integration—would correlate with cognitive performance, we also performed a post‐hoc analysis testing for relationships between infants' maturation indices and MSEL composite scores. Results were largely consistent with AUD‐SM behavioral findings: the maturity of infants' SM Step 1 at 1 year was related to MSEL composite, Receptive Language, and Visual Reception scores at 2 (all r = ∼0.5, P < 0.01). Although this finding relates the maturity of SM Step 1 connectivity to the MSEL measures, as opposed to the density of AUD and SM seed connections with their overlapping region, the adult SM Step 1 pattern is spatially similar to the AUD‐SM Step 1 overlapping region, and the inter‐sensory connection density measure's relationship with MSEL scores produced higher correlation coefficients.
Common Step 1 and 2 connectivity for SM and VIS seeds in adults included the SPL, which has been routinely identified as a component of the dorsal stream [Kravitz et al., 2011] related to visually‐guided grasping and manipulation [Binkofski et al., 1999; Culham et al., 2003; Johnson‐Frey et al., 2005]. The precuneus was also identified, and has also been associated with aspects of visuo‐motor processing [Connolly et al., 2003; Karnath and Perenin, 2005]. The emergence of SM‐VIS overlap in the SPL of infants at 2 is consistent with reports showing that infants develop intentional bimanual visuo‐motor skills around this age [Kimmerle et al., 2010; Nelson et al., 2013; Ramsay and Weber, 1986]. Although reaching behaviors emerge as early as three to four months [Thelen et al., 1993; Von Hofsten, 1991], infants' ability to purposely and independently orchestrate both hands to manipulate objects only starts to emerge around 13 months [Kimmerle et al., 2010; Nelson et al., 2013] and continues to develop through the second year [Nelson et al., 2013; Ramsay and Weber, 1986]. Hence, factors like intention and corresponding skill may play a role in the development of VIS‐SM SPL connectivity, consistent with evidence linking these regions to top‐down attention and the transformation of visuospatial coordinates into goal‐directed movements [Grefkes and Fink, 2005; Ptak, 2012].
Finally, a cluster of common connectivity for all three seeds was observed in the SMA of adults. Connectivity between this region and the SM seed was expected, and its connectivity with the VIS seed is not surprising, given the SMA is contiguous with the supplementary eye fields [Amiez and Petrides, 2009; Fried et al., 1991]. The significance of its direct connectivity with the auditory system, however, is less obvious. Because the SMA has been tied to movement preparation [Cunnington et al., 2003], it may receive direct sensory information from all modalities to inform future motor actions. This region was not detected in infants, which may indicate that this type of multimodal processing occurs later in development.
Inter‐Sensory Convergence for Steps 3 and 4 in Adults and Infants
We also observed dramatic overlap in mSFC across sensory seeds for Steps 3 and 4, converging on regions highly abstracted from early sensory cortices. For example, the DMN—which has been shown to receive input from all sensory modalities [Mesulam, 1998] and is involved in the multimodal representation of concepts [Binder et al., 2009; Fernandino et al., 2016]—was especially apparent for Step 3. Along with the SN, the ECN was also observed for Steps 3 and 4, but was more exclusively tied to Step 4 intersections.
Although this expanse of Step 3 mSFC overlap was not observed to nearly the same extent in infants, small and scattered clusters were detected in similar regions (e.g., posterior cingulate for AUD‐SM‐VIS, SM‐VIS, and AUD‐VIS), gradually appearing with age. For the DMN, these results suggest that multimodal processing in the DMN may begin developing during infancy and may parallel infants' ability to form multimodal representations at a time when infants are rapidly acquiring concepts. The only behavioral relationship detected for Step 3 or 4 intersections was between the number of Step 3 AUD‐VIS inter‐sensory connections, which included components of the DMN and ECN, and Visual Reception scores at 2 years. Although the parietal regions of AUD‐VIS Step 3 have been tied to visuospatial [Grefkes and Fink, 2005; Rushworth et al., 2006] and multimodal spatial processing [Culham et al., 2003], which would be necessary for performance on the Visual Reception scale, it is unclear why overlap specific to the VIS and AUD systems was particularly tied to this scale.
The neuroanatomical makeup of Step 4 convergence in adults is intriguing, mainly because its composition includes reward‐processing regions belonging to mesolimbic pathways and other regions involved in executive functioning (i.e., SN and ECN). The relative positioning of these regions at the top of the sensory processing hierarchy is consistent with a recent neurobiological model of predictive coding. More specifically, Chanes and Barrett [2016] propose that sensory processing in the brain occurs primarily through predictive coding mechanisms, which are facilitated by the architecture of underlying laminar structures of cortical columns [Chanes and Barrett, 2016]. Limbic and paralimbic cortices have the most simple laminar structures, and therefore sit at the top of these predictive coding hierarchies, sending predictions and receiving prediction error feedback from downstream sensory cortices [Barrett and Simmons, 2015; Chanes and Barrett, 2016]. Additionally, basal ganglia and ECN regions have also been reported to function in a manner consistent with occupying high‐level predictive coding positions for sensory processing [Langner et al., 2012]. Empirically, we found that DMN regions from Step 3 were incrementally closer to early sensory cortices than ECN regions, which is also consistent with reports that the ECN functions as a control system, interposed between and flexibly coupling with dorsal attention and DMNs to mediate goal‐directed cognitive control between externally [Macaluso, 2010; Ptak, 2012] and internally directed attention [Cole et al., 2013; Gao and Lin, 2012; Spreng et al., 2010].
Strikingly, we consistently observed adult‐like Step 4 overlap for infants, starting from 1 year of age. A closer look revealed that Step 4 overlap in infants tended to fall more in the basal ganglia, limbic, and paralimbic regions of the mesolimbic pathway than in the dorsolateral prefrontal and parietal regions of the ECN, which may indicate a particularly important role for dopamine‐mediated functional circuits during early development. Consistently, the mechanism of reinforcement learning—closely related to the reward calculation role of the dopamine pathways—has been suggested to underlie the development of a range of infant behaviors including grasping [Oztop et al., 2004], gaze following [Deak et al., 2014], social referencing [Jasso et al., 2008], and language production [Warlaumont et al., 2013]. Our results provide support for a unique predictive coding role of mesolimbic pathway regions (e.g., striatum, amygdala, hippocampus, insula) in early brain development. The fact that significant relationships were not detected between Step 4 overlap and behavior is interesting and future studies following these infants as they age may be needed to clarify if a long‐term relationship exists.
Several limitations of this study deserve discussion. First, the relationship between our mSFC measure and underlying neural structure and/or physiology is not established. Therefore, our stepwise findings should not be interpreted as corresponding to single or multi‐synaptic connections. Additionally, although the infant dataset was collected longitudinally from the same subjects, the adult dataset was collected from a non‐overlapping cohort; therefore, it is possible that some of the similarities and/or differences observed between infants and adults may be driven by inter‐subject variability. Future studies using complete longitudinal samples would be needed to verify this (although such long‐term studies could be extremely challenging in practice). Along the same vein, infants were sleeping during their rsfMRI scans, which should also be considered when interpreting and comparing their results with those from awake, resting adults. Other considerations when interpreting results from this study relate to methodology. We chose to threshold correlation coefficients at r > 0.5 for stepwise calculations to minimize the effects of spurious voxelwise functional connections at the individual subject level; however, there is always a tradeoff between type I and type II error and therefore it is possible that certain connections at r < 0.5 may have been missed in this analysis. Likewise, we chose to limit our analysis to positive correlations, however considering negative correlations may provide additional information about SFC and deserves further investigation. Because our analysis considered only positive correlations, we also chose to perform global signal regression, which improves spatial specificity and minimizes the influence of physiological noise [Chang and Glover, 2009; Yan et al., 2013]. However, when we repeated our analysis without GSR in adults we observed highly consistent mSFC patterns (mean correlation of 0.81 with a standard deviation of 0.13 across all seeds all steps). We also repeated our analysis using a more stringent motion scrubbing threshold of FD < 0.3 mm and found 0.97 mean correlation (0.04 standard deviation) with our results across all ages, seeds and steps, supporting the robustness of our findings with regard to motion artifacts. Finally, image downsampling and smoothing were implemented in this study for the purposes of computational efficiency and to promote robust whole brain results, but with some compromise on spatial detail. Future efforts using higher spatial resolution rsfMRI images may delineate finer SFC spatial details.
In conclusion, this study used mSFC to delineate the development of the brain's hierarchical functional organization during the first 2 years of life. Our results confirmed that across all three sensory systems Step 1 matured earlier than steps involving multiple links. Among multi‐link steps, those associated with the visual system showed more deterministic and statistically significant growth toward their mature forms than sensorimotor and auditory systems. Inter‐sensory convergence, particularly for Step 1, included sensory integration “analogs,” and in several instances inter‐sensory connection densities were related to cognitive performance, especially between perisylvian audio‐motor regions and language‐dependent scales. Finally, the emergence of consistent and adult‐like Step 4 overlap in limbic, paralimbic and striatum areas starting from 1 year provides support for a unique developmental role of these dopamine‐pathway‐related brain areas.
Supporting information
Supporting Information
Supporting Information
Supporting Information
Supporting Information
Supporting Information
Supporting Information
Supporting Information
Supporting Information
Supporting Information
REFERENCES
- Alcauter S, Lin W, Smith JK, Gilmore JH, Gao W (2013): Consistent anterior–posterior segregation of the insula during the first 2 years of life. Cereb Cortex 25:1176–1187. [DOI] [PMC free article] [PubMed] [Google Scholar]
- Alcauter S, Lin W, Smith JK, Short SJ, Goldman BD, Reznick JS, Gilmore JH, Gao W (2014): Development of thalamocortical connectivity during infancy and its cognitive correlations. J Neurosci 34:9067–9075. [DOI] [PMC free article] [PubMed] [Google Scholar]
- Allen EA, Erhardt EB, Damaraju E, Gruner W, Segall JM, Silva RF, Havlicek M, Rachakonda S, Fries J, Kalyanam R, Michael AM, Caprihan A, Turner JA, Eichele T, Adelsheim S, Bryan AD, Bustillo J, Clark VP, Feldstein Ewing SW, Filbey F, Ford CC, Hutchison K, Jung RE, Kiehl KA, Kodituwakku P, Komesu YM, Mayer AR, Pearlson GD, Phillips JP, Sadek JR, Stevens M, Teuscher U, Thoma RJ, Calhoun VD (2011): A baseline for the multivariate comparison of resting‐state networks. Front Syst Neurosci 5:2. [DOI] [PMC free article] [PubMed] [Google Scholar]
- Amiez C, Petrides M (2009): Anatomical organization of the eye fields in the human and non‐human primate frontal cortex. Prog Neurobiol 89:220–230. [DOI] [PubMed] [Google Scholar]
- Bahrick LE, Lickliter R (2000): Intersensory redundancy guides attentional selectivity and perceptual learning in infancy. Dev Psychol 36:190. [DOI] [PMC free article] [PubMed] [Google Scholar]
- Barrett LF, Simmons WK (2015): Interoceptive predictions in the brain. Nat Rev Neurosci 16:419–429. [DOI] [PMC free article] [PubMed] [Google Scholar]
- Beauchamp MS, Nath AR, Pasalar S (2010): fMRI‐Guided transcranial magnetic stimulation reveals that the superior temporal sulcus is a cortical locus of the McGurk effect. J Neurosci 30:2414–2417. [DOI] [PMC free article] [PubMed] [Google Scholar]
- Benedict H (1979): Early lexical development: Comprehension and production. J Child Lang 6:183–200. [DOI] [PubMed] [Google Scholar]
- Benjamini Y, Yekutieli D (2001): The control of the false discovery rate in multilpe testing under dependency. Ann Statist 29:1165–1188. [Google Scholar]
- Binder JR, Desai RH, Graves WW, Conant LL (2009): Where is the semantic system? A critical review and meta‐analysis of 120 functional neuroimaging studies. Cereb Cortex 19:2767–2796. [DOI] [PMC free article] [PubMed] [Google Scholar]
- Binkofski F, Buccino G, Posse S, Seitz RJ, Rizzolatti G, Freund HJ (1999): A fronto‐parietal circuit for object manipulation in man: Evidence from an fMRI‐study. Eur J Neurosci 11:3276–3286. [DOI] [PubMed] [Google Scholar]
- Biswal B, Zerrin Yetkin F, Haughton VM, Hyde JS (1995): Functional connectivity in the motor cortex of resting human brain using echo‐planar mri. Magn Reson Med 34:537–541. [DOI] [PubMed] [Google Scholar]
- Blank H, Anwander A, von Kriegstein K (2011): Direct structural connections between voice‐and face‐recognition areas. J Neurosci 31:12906–12915. [DOI] [PMC free article] [PubMed] [Google Scholar]
- Brauer J, Anwander A, Perani D, Friederici AD (2013): Dorsal and ventral pathways in language development. Brain Lang 127:289–295. [DOI] [PubMed] [Google Scholar]
- Bullmore E, Sporns O (2012): The economy of brain network organization. Nat Rev Neurosci 13:336–349. [DOI] [PubMed] [Google Scholar]
- Burr D, Gori M (2012): Multisensory integration develops late in humans In: Murray MM, Wallace MT, editors. The Neural Bases of Multisensory Processes. Boca Raton (FL): CRC Press/Taylor & Francis. [PubMed] [Google Scholar]
- Cai Q, Paulignan Y, Brysbaert M, Ibarrola D, Nazir TA (2010): The left ventral occipito‐temporal response to words depends on language lateralization but not on visual familiarity. Cereb Cortex 20:1153–1163. [DOI] [PubMed] [Google Scholar]
- Chanes L, Barrett LF (2016): Redefining the role of limbic areas in cortical processing. Trends Cogn Sci 20:96–106. [DOI] [PMC free article] [PubMed] [Google Scholar]
- Chang C, Glover GH (2009): Effects of model‐based physiological noise correction on default mode network anti‐correlations and correlations. Neuroimage 47:1448–1459. [DOI] [PMC free article] [PubMed] [Google Scholar]
- Cole MW, Reynolds JR, Power JD, Repovs G, Anticevic A, Braver TS (2013): Multi‐task connectivity reveals flexible hubs for adaptive task control. Nat Neurosci 16:1348–1355. [DOI] [PMC free article] [PubMed] [Google Scholar]
- Conant LL, Liebenthal E, Desai A, Binder JR (2014): FMRI of phonemic perception and its relationship to reading development in elementary‐to middle‐school‐age children. Neuroimage 89:192–202. [DOI] [PMC free article] [PubMed] [Google Scholar]
- Connolly JD, Andersen RA, Goodale MA (2003): FMRI evidence for a'parietal reach region'in the human brain. Exp Brain Res 153:140–145. [DOI] [PubMed] [Google Scholar]
- Corbetta M, Shulman GL (2002): Control of goal‐directed and stimulus‐driven attention in the brain. Nat Rev Neurosci 3:201–215. [DOI] [PubMed] [Google Scholar]
- Corbetta M, Patel G, Shulman GL (2008): The reorienting system of the human brain: From environment to theory of mind. Neuron 58:306–324. [DOI] [PMC free article] [PubMed] [Google Scholar]
- Culham JC, Danckert SL, De Souza JF, Gati JS, Menon RS, Goodale MA (2003): Visually guided grasping produces fMRI activation in dorsal but not ventral stream brain areas. Exp Brain Res 153:180–189. [DOI] [PubMed] [Google Scholar]
- Cunnington R, Windischberger C, Deecke L, Moser E (2003): The preparation and readiness for voluntary movement: A high‐field event‐related fMRI study of the Bereitschafts‐BOLD response. Neuroimage 20:404–412. [DOI] [PubMed] [Google Scholar]
- Damasio AR (1989): Time‐locked multiregional retroactivation: A systems‐level proposal for the neural substrates of recall and recognition. Cognition 33:25–62. [DOI] [PubMed] [Google Scholar]
- Deak GO, Krasno AM, Triesch J, Lewis J, Sepeta L (2014): Watch the hands: Infants can learn to follow gaze by seeing adults manipulate objects. Dev Sci 17:270–281. [DOI] [PubMed] [Google Scholar]
- Driver J, Noesselt T (2008): Multisensory interplay reveals crossmodal influences on ‘sensory‐specific'brain regions, neural responses, and judgments. Neuron 57:11–23. [DOI] [PMC free article] [PubMed] [Google Scholar]
- Fenson L, Dale PS, Reznick JS, Bates E, Thal DJ, Pethick SJ, Tomasello M, Mervis CB, Stiles J (1994): Variability in early communicative development. Monogr Soc Res Child Dev 59:1–173. [PubMed] [Google Scholar]
- Fernandino L, Binder JR, Desai RH, Pendl SL, Humphries CJ, Gross WL, Conant LL, Seidenberg MS (2016): Concept representation reflects multimodal abstraction: A framework for embodied semantics. Cereb Cortex 26:2018–2034. [DOI] [PMC free article] [PubMed] [Google Scholar]
- Foxe JJ, Wylie GR, Martinez A, Schroeder CE, Javitt DC, Guilfoyle D, Ritter W, Murray MM (2002): Auditory‐somatosensory multisensory processing in auditory association cortex: An fMRI study. J Neurophysiol 88:540–543. [DOI] [PubMed] [Google Scholar]
- Fransson P, Aden U, Blennow M, Lagercrantz H (2011): The functional architecture of the infant brain as revealed by resting‐state fMRI. Cereb Cortex 21:145–154. [DOI] [PubMed] [Google Scholar]
- Fried I, Katz A, McCarthy G, Sass KJ, Williamson P, Spencer SS, Spencer DD (1991): Functional organization of human supplementary motor cortex studied by electrical stimulation. J Neurosci 11:3656–3666. [DOI] [PMC free article] [PubMed] [Google Scholar]
- Gao W, Lin W (2012): Frontal parietal control network regulates the anti‐correlated default and dorsal attention networks. Hum Brain Mapp 33:192–202. [DOI] [PMC free article] [PubMed] [Google Scholar]
- Gao W, Lin W, Chen Y, Gerig G, Smith JK, Jewells V, Gilmore JH (2009a): Temporal and spatial development of axonal maturation and myelination of white matter in the developing brain. AJNR Am J Neuroradiol 30:290–296. [DOI] [PMC free article] [PubMed] [Google Scholar]
- Gao W, Zhu H, Giovanello KS, Smith JK, Shen D, Gilmore JH, Lin W (2009b): Evidence on the emergence of the brain's default network from 2‐week‐old to 2‐year‐old healthy pediatric subjects. Proc Natl Acad Sci U S A 106:6790–6795. [DOI] [PMC free article] [PubMed] [Google Scholar]
- Gao W, Gilmore JH, Shen D, Smith JK, Zhu H, Lin W (2013): The synchronization within and interaction between the default and dorsal attention networks in early infancy. Cereb Cortex 23:594–603. [DOI] [PMC free article] [PubMed] [Google Scholar]
- Gao W, Alcauter S, Elton A, Hernandez‐Castillo CR, Smith JK, Ramirez J, Lin W (2014a): Functional network development during the first year: Relative sequence and socioeconomic correlations. Cereb Cortex 25:2919–2928. [DOI] [PMC free article] [PubMed] [Google Scholar]
- Gao W, Alcauter S, Smith J, Gilmore J, Lin W (2014b): Development of human brain cortical network architecture during infancy. Brain Struct Funct 220:1173–1186. [DOI] [PMC free article] [PubMed] [Google Scholar]
- Gao W, Lin W, Grewen K, Gilmore JH (2016): Functional connectivity of the infant human brain: Plastic and modifiable. Neuroscientist. pii: 1073858416635986. [Epub ahead of print] [DOI] [PMC free article] [PubMed] [Google Scholar]
- Gilmore JH, Shi F, Woolson SL, Knickmeyer RC, Short SJ, Lin W, Zhu H, Hamer RM, Styner M, Shen D (2012): Longitudinal development of cortical and subcortical gray matter from birth to 2 years. Cereb Cortex 22:2478–2485. [DOI] [PMC free article] [PubMed] [Google Scholar]
- Girard N, Raybaud C, du Lac P (1991): MRI study of brain myelination. J Neuroradiol 18:291–307. [PubMed] [Google Scholar]
- Goldfield BA, Reznick JS (1990): Early lexical acquisition: Rate, content, and the vocabulary spurt. J Child Lang 17:171–183. [DOI] [PubMed] [Google Scholar]
- Grefkes C, Fink GR (2005): REVIEW: The functional organization of the intraparietal sulcus in humans and monkeys. J Anat 207:3–17. [DOI] [PMC free article] [PubMed] [Google Scholar]
- Hashimoto R, Sakai KL (2004): Learning letters in adulthood: Direct visualization of cortical plasticity for forming a new link between orthography and phonology. Neuron 42:311–322. [DOI] [PubMed] [Google Scholar]
- Hepper PG, Shahidullah BS (1994): Development of fetal hearing. Arch Dis Child 71:F81–F87. [DOI] [PMC free article] [PubMed] [Google Scholar]
- Hickok G, Okada K, Serences JT (2009): Area Spt in the human planum temporale supports sensory‐motor integration for speech processing. J Neurophysiol 101:2725–2732. [DOI] [PubMed] [Google Scholar]
- Hickok G, Houde J, Rong F (2011): Sensorimotor integration in speech processing: Computational basis and neural organization. Neuron 69:407–422. [DOI] [PMC free article] [PubMed] [Google Scholar]
- Jasso H, Triesch J, Deak G (2008): A reinforcement learning model of social referencing. In: 7th IEEE International Conference on Development and Learning. pp 286–291.
- Johnson‐Frey SH, Vinton D, Norlund R, Grafton ST (2005): Cortical topography of human anterior intraparietal cortex active during visually guided grasping. Cogn Brain Res 23:397–405. [DOI] [PubMed] [Google Scholar]
- Karnath H‐O, Perenin M‐T (2005): Cortical control of visually guided reaching: Evidence from patients with optic ataxia. Cereb Cortex 15:1561–1569. [DOI] [PubMed] [Google Scholar]
- Kimmerle M, Ferre CL, Kotwica KA, Michel GF (2010): Development of role‐differentiated bimanual manipulation during the infant's first year. Dev Psychobiol 52:168–180. [DOI] [PubMed] [Google Scholar]
- Kravitz DJ, Saleem KS, Baker CI, Mishkin M (2011): A new neural framework for visuospatial processing. Nat Rev Neurosci 12:217–230. [DOI] [PMC free article] [PubMed] [Google Scholar]
- Langner R, Kellermann T, Eickhoff SB, Boers F, Chatterjee A, Willmes K, Sturm W (2012): Staying responsive to the world: Modality‐specific and‐nonspecific contributions to speeded auditory, tactile, and visual stimulus detection. Hum Brain Mapp 33:398–418. [DOI] [PMC free article] [PubMed] [Google Scholar]
- Liebenthal E, Sabri M, Beardsley SA, Mangalathu‐Arumana J, Desai A (2013): Neural dynamics of phonological processing in the dorsal auditory stream. J Neurosci 33:15414–15424. [DOI] [PMC free article] [PubMed] [Google Scholar]
- Macaluso E (2010): Orienting of spatial attention and the interplay between the senses. Cortex 46:282–297. [DOI] [PubMed] [Google Scholar]
- Man K, Kaplan J, Damasio H, Damasio A (2013): Neural convergence and divergence in the mammalian cerebral cortex: From experimental neuroanatomy to functional neuroimaging. J Comp Neurol 521:4097–4111. [DOI] [PMC free article] [PubMed] [Google Scholar]
- Mano QR, Humphries C, Desai RH, Seidenberg MS, Osmon DC, Stengel BC, Binder JR (2013): The role of left occipitotemporal cortex in reading: Reconciling stimulus, task, and lexicality effects. Cereb Cortex 23:988–1001. [DOI] [PMC free article] [PubMed] [Google Scholar]
- Mesulam MM (1998): From sensation to cognition. Brain 121:1013–1052. [DOI] [PubMed] [Google Scholar]
- Miller LM, D'Esposito M (2005): Perceptual fusion and stimulus coincidence in the cross‐modal integration of speech. J Neurosci 25:5884–5893. [DOI] [PMC free article] [PubMed] [Google Scholar]
- Mullen EM (1995): Mullen Scales of Early Learning. Circle Pines, MN: AGS. [Google Scholar]
- Munson B (2001): Phonological pattern frequency and speech production in adults and children. J Speech Lang Hear Res 44:778–792. [DOI] [PubMed] [Google Scholar]
- Murphy K, Birn RM, Handwerker DA, Jones TB, Bandettini PA (2009): The impact of global signal regression on resting state correlations: Are anti‐correlated networks introduced?. Neuroimage 44:893–905. [DOI] [PMC free article] [PubMed] [Google Scholar]
- Nelson EL, Campbell JM, Michel GF (2013): Unimanual to bimanual: Tracking the development of handedness from 6 to 24 months. Infant Behav Dev 36:181–188. [DOI] [PMC free article] [PubMed] [Google Scholar]
- Newman R, Ratner NB, Jusczyk AM, Jusczyk PW, Dow KA (2006): Infants' early ability to segment the conversational speech signal predicts later language development: A retrospective analysis. Dev Psychol 42:643. [DOI] [PubMed] [Google Scholar]
- Nigam S, Shimono M, Ito S, Yeh F‐C, Timme N, Myroshnychenko M, Lapish CC, Tosi Z, Hottowy P, Smith WC, Masmanidis SC, Litke AM, Sporns O, Beggs JM (2016): Rich‐club organization in effective connectivity among cortical neurons. J Neurosci 36:670–684. [DOI] [PMC free article] [PubMed] [Google Scholar]
- Okada K, Hickok G (2006): Left posterior auditory‐related cortices participate both in speech perception and speech production: Neural overlap revealed by fMRI. Brain Lang 98:112–117. [DOI] [PubMed] [Google Scholar]
- Oztop E, Bradley NS, Arbib MA (2004): Infant grasp learning: A computational model. Exp Brain Res 158:480–503. [DOI] [PubMed] [Google Scholar]
- Perani D, Saccuman MC, Scifo P, Anwander A, Spada D, Baldoli C, Poloniato A, Lohmann G, Friederici AD (2011): Neural language networks at birth. Proc Natl Acad Sci 108:16056–16061. [DOI] [PMC free article] [PubMed] [Google Scholar]
- Power JD, Barnes KA, Snyder AZ, Schlaggar BL, Petersen SE (2012): Spurious but systematic correlations in functional connectivity MRI networks arise from subject motion. Neuroimage 59:2142–2154. [DOI] [PMC free article] [PubMed] [Google Scholar]
- Price CJ, Devlin JT (2011): The interactive account of ventral occipitotemporal contributions to reading. Trends Cogn Sci 15:246–253. [DOI] [PMC free article] [PubMed] [Google Scholar]
- Ptak R (2012): The frontoparietal attention network of the human brain action, saliency, and a priority map of the environment. Neuroscientist 18:502–515. [DOI] [PubMed] [Google Scholar]
- Raichle ME, MacLeod AM, Snyder AZ, Powers WJ, Gusnard DA, Shulman GL (2001): A default mode of brain function. Proc Natl Acad Sci U S A 98:676–682. [DOI] [PMC free article] [PubMed] [Google Scholar]
- Ramsay DS, Weber SL (1986): Infants' hand preference in a task involving complementary roles for the two hands. Child Dev 300–307. [Google Scholar]
- Rushworth M, Behrens T, Johansen‐Berg H (2006): Connection patterns distinguish 3 regions of human parietal cortex. Cereb Cortex 16:1418–1430. [DOI] [PubMed] [Google Scholar]
- Schipke CS, Kauschke C (2010): Early word formation in German language acquisition: A study on word formation growth during the second and third years. First Lang 14:195–211. [Google Scholar]
- Seeley WW, Menon V, Schatzberg AF, Keller J, Glover GH, Kenna H, Reiss AL, Greicius MD (2007): Dissociable intrinsic connectivity networks for salience processing and executive control. J Neurosci 27:2349–2356. [DOI] [PMC free article] [PubMed] [Google Scholar]
- Sepulcre J (2014): Integration of visual and motor functional streams in the human brain. Neurosci Lett 567:68–73. [DOI] [PubMed] [Google Scholar]
- Sepulcre J (2015): An OP4 functional stream in the language‐related neuroarchitecture. Cereb Cortex 25:658–666. [DOI] [PubMed] [Google Scholar]
- Sepulcre J, Sabuncu MR, Yeo TB, Liu H, Johnson KA (2012): Stepwise connectivity of the modal cortex reveals the multimodal organization of the human brain. J Neurosci 32:10649–10661. [DOI] [PMC free article] [PubMed] [Google Scholar]
- Shaw KE, Bortfeld H (2015): Sources of confusion in infant audiovisual speech perception research. Front Psychol 6:1844. [DOI] [PMC free article] [PubMed] [Google Scholar]
- Shi F, Yap P‐T, Wu G, Jia H, Gilmore JH, Lin W, Shen D (2011): Infant brain atlases from neonates to 1‐and 2‐year‐olds. PloS One 6:e18746. [DOI] [PMC free article] [PubMed] [Google Scholar]
- Short SJ, Elison JT, Goldman BD, Styner M, Gu H, Connelly M, Maltbie E, Woolson S, Lin W, Gerig G (2013): Associations between white matter microstructure and infants' working memory. Neuroimage 64:156–166. [DOI] [PMC free article] [PubMed] [Google Scholar]
- Spreng RN, Stevens WD, Chamberlain JP, Gilmore AW, Schacter DL (2010): Default network activity, coupled with the frontoparietal control network, supports goal‐directed cognition. Neuroimage 53:303–317. [DOI] [PMC free article] [PubMed] [Google Scholar]
- Thelen E, Corbetta D, Kamm K, Spencer JP, Schneider K, Zernicke RF (1993): The transition to reaching: Mapping intention and intrinsic dynamics. Child Dev 64:1058–1098. [PubMed] [Google Scholar]
- Van Den Heuvel MP, Sporns O (2011): Rich‐club organization of the human connectome. J Neurosci 31:15775–15786. [DOI] [PMC free article] [PubMed] [Google Scholar]
- Von Hofsten C (1991): Structuring of early reaching movements: A longitudinal study. J Motor Behav 23:280–292. [DOI] [PubMed] [Google Scholar]
- Von Kriegstein K, Giraud A‐L (2004): Distinct functional substrates along the right superior temporal sulcus for the processing of voices. Neuroimage 22:948–955. [DOI] [PubMed] [Google Scholar]
- Von Kriegstein K, Kleinschmidt A, Sterzer P, Giraud AL (2005): Interaction of face and voice areas during speaker recognition. J Cogn Neurosci 17:367–376. [DOI] [PubMed] [Google Scholar]
- Von Kriegstein K, Kleinschmidt A, Giraud AL (2006): Voice recognition and cross‐modal responses to familiar speakers' voices in prosopagnosia. Cereb Cortex 16:1314–1322. [DOI] [PubMed] [Google Scholar]
- Vouloumanos A, Hauser MD, Werker JF, Martin A (2010): The tuning of human neonates' preference for speech. Child Dev 81:517–527. [DOI] [PubMed] [Google Scholar]
- Warlaumont AS, Westermann G, Buder EH, Oller DK (2013): Prespeech motor learning in a neural network using reinforcement. Neural Netw 38:64–75. [DOI] [PMC free article] [PubMed] [Google Scholar]
- Yan CG, Craddock RC, Zuo XN, Zang YF, Milham MP (2013): Standardizing the intrinsic brain: Towards robust measurement of inter‐individual variation in 1000 functional connectomes. Neuroimage 80:246–262. [DOI] [PMC free article] [PubMed] [Google Scholar]
- Zamuner TS, Gerken L, Hammond M (2004): Phonotactic probabilities in young children's speech production. J Child Lang 31:515–536. [DOI] [PubMed] [Google Scholar]
Associated Data
This section collects any data citations, data availability statements, or supplementary materials included in this article.
Supplementary Materials
Supporting Information
Supporting Information
Supporting Information
Supporting Information
Supporting Information
Supporting Information
Supporting Information
Supporting Information
Supporting Information