

Abstract
Background
With over a decade of directed efforts to reduce sex and racial differences in coronary artery bypass grafting (CABG) utilization, and post‐CABG outcomes, we sought to evaluate how the use of CABG and its outcomes have evolved in different sex and racial subgroups.
Methods and Results
Using data on all fee‐for‐service Medicare beneficiaries undergoing CABG in the United States from 1999 to 2014, we examined differences by sex and race in calendar‐year trends for CABG utilization and post‐CABG outcomes (in‐hospital, 30‐day, and 1‐year mortality and 30‐day readmission). A total of 1 863 719 Medicare fee‐for‐service beneficiaries (33.6% women, 4.6% black) underwent CABG from 1999 to 2014, with a decrease from 611 to 245 CABG procedures per 100 000 person‐years. Men compared with women and whites compared with blacks had higher CABG utilization, with declines in all subgroups. Higher post‐CABG annual declines in mortality (95% confidence interval) were observed in women (in‐hospital, −2.70% [−2.97, −2.44]; 30‐day, −2.29% [−2.54, −2.04]; and 1‐year mortality, −1.67% [−1.88, −1.46]) and blacks (in‐hospital, −3.31% [−4.02, −2.60]; 30‐day, −2.80% [−3.49, −2.12]; and 1‐year mortality, −2.38% [−2.92, −1.84]), compared with men and whites, respectively. Mortality rates remained higher in women and blacks, but differences narrowed over time. Annual adjusted 30‐day readmission rates remained unchanged for all patient groups.
Conclusions
Women and black patients had persistently higher CABG mortality than men and white patients, respectively, despite greater declines over the time period. These findings indicate progress, but also the need for further progress.
Keywords: bypass graft, mortality, race, readmission, sex
Subject Categories: Cardiovascular Surgery, Quality and Outcomes
Clinical Perspective
What Is New?
The utilization of coronary artery bypass grafting (CABG) decreased over the past 2 decades, with concurrent decrease in post‐CABG mortality.
Women and black patients experienced higher declines in post‐CABG mortality than men and white patients, respectively.
In spite of higher declines in mortality rates, women and black patients continued to have higher post‐CABG mortality at the end of the study.
What Are the Clinical Implications?
Further efforts are required to harmonize the care of women and black patients undergoing CABG, to narrow the gap in the outcomes.
Introduction
Quality improvement initiatives for coronary artery bypass grafting (CABG) have paralleled improved postoperative outcomes, despite declining CABG volumes in the United States.1, 2 However, several studies have highlighted lower CABG utilization rates and worse post‐CABG mortality among women and racial/ethnic minorities, particularly blacks.3, 4, 5, 6, 7 This awareness has spurred multifaceted local and national interventions aimed at narrowing sex‐ and race‐related differences in CABG use and outcomes.8, 9, 10, 11 However, it is not clear whether there has been a concomitant change in the differences in outcomes by sex and race over time. Given that previous studies have focused primarily on overall CABG utilization and outcomes,12, 13, 14, 15, 16 a contemporary assessment of relative trends in CABG utilization, post‐CABG mortality, and readmission rates, across subgroups of race and sex, is urgently needed. An understanding of how these outcomes have evolved across sex and racial divides may provide valuable insight into the effects of various efforts undertaken by different authorities to narrow the sex and race gap.
Accordingly, we examined national fee‐for‐service Medicare data to determine sex‐ and race‐based differences in CABG utilization, and post‐CABG mortality and 30‐day readmission rates over the past 2 decades in Medicare beneficiaries aged ≥65 years. Specifically, we evaluated trends in CABG utilization and early, as well as 1‐year, postoperative outcomes after CABG among fee‐for‐service Medicare beneficiaries during the period from 1999 through 2014.
Methods
Analytical methods can be made available to other researchers for purposes of reproducing the results or replicating the procedure through the corresponding author. The data themselves are available through the Centers for Medicare & Medicaid Services.
Study Sample
We used the Medicare beneficiary denominator file from the Centers for Medicare & Medicaid Services to identify beneficiaries aged ≥65 years who were enrolled in the fee‐for‐service plan for at least 1 month from January 1999 through December 2014. We calculated beneficiary‐years for each beneficiary to account for new enrollment, disenrollment, or death for each year of the study. We then linked the beneficiary‐years data to the Medicare fee‐for‐service inpatient claims data to identify fee‐for‐service patients who underwent CABG during an acute care hospitalization in the United States from January 1, 1999 through December 31, 2014, based on the International Classification of Diseases, Ninth Revision, Clinical Modification (ICD‐9‐CM) procedure codes 36.10 through 36.36.
Patient Characteristics
Patient demographic information included age, sex, and race (white, black, or other race). We identified comorbidities included in the Centers for Medicare & Medicaid Services 30‐day mortality and readmission measures for acute myocardial infarction and heart failure,17, 18 including cardiovascular risk factors (hypertension, diabetes mellitus, atherosclerotic disease, unstable angina, previous myocardial infarction, previous heart failure, peripheral vascular disease, stroke, and other cerebrovascular diseases), geriatric conditions (dementia, functional disability, and malnutrition), and other conditions (renal failure, chronic obstructive pulmonary disease, pneumonia, respiratory failure, liver disease, cancer, major psychiatric disorders, depression, and trauma). We determined comorbidities from a combination of secondary diagnosis codes for the index hospitalization and principal and secondary diagnosis codes for all hospitalizations over 12 months preceding the index hospitalization.
Outcomes
CABG procedures were defined as undergoing CABG during a hospitalization. Rates of CABG procedures were calculated by dividing the total number of procedures in each year by the corresponding person‐years of fee‐for‐service beneficiaries for that year. We also determined rates of mortality, readmission, and length of hospital stay. We defined rates of all‐cause in‐hospital, 30‐day, and 1‐year mortality as the proportion of CABG procedures resulting in death, regardless of cause, during the index hospital stay, within 30 days, and within 1 year, respectively, from the date of the CABG procedure. We defined 30‐day readmission as a hospitalization at any acute‐care facility within 30 days after the date of discharge from the index hospitalization for CABG.
Statistical Analysis
Rates of hospitalizations for CABG are expressed per 100 000 person‐years; mortality and readmission rates as percentages; and lengths of stay as median days and the corresponding interquartile ranges. We fit a mixed‐effects model with a Poisson‐link function and random county‐specific intercepts to determine the annual changes in CABG hospitalization rate, adjusted for age, sex, and race. We included a spherical covariate structure in models to account for spatial autocorrelation. Next, to assess in‐hospital, 30‐day, and 1‐year mortality risk, we fit a mixed model with a logit‐link function and hospital random intercepts to determine the change in in‐hospital, 30‐day, and 1‐year mortality rates, adjusted for patient age, sex, race, and comorbidities. We evaluated for changes in 30‐day readmission rates using a Cox proportional‐hazards model that adjusted for age, sex, race, and comorbidities, censored for deaths. All models included an ordinal time variable 0 to 16, representing the years 1999–2014, after the visual inspection of crude rates revealed a linear pattern. We included an interaction term, between the time variable and each of the sex and race subgroups, in the model to assess whether the change in outcomes was statistically significant across the subgroups. To permit complete follow‐up, we restricted the 1‐year mortality model to 2013 discharges and the 30‐day readmission model to November 30, 2014 discharges. After testing the adequacy of the model, the proportional hazards assumption was satisfied.19 All statistical tests were 2‐sided with a significance level of 0.05. We conducted the analyses with SAS software (version 9.4; SAS Institute Inc, Cary, NC). The Yale University Institutional Review Board reviewed the study protocol and granted a waiver of informed consent for the use of this de‐identified database.
Results
Patient Characteristics
A total of 1 863 719 fee‐for‐service Medicare beneficiaries underwent CABG from 1999 through 2014 (mean age, 74.5; 33.6% women, 4.6% black). CABG procedure rates (per 100 000 person‐years) decreased from 611 in 1999 to 245 in 2014. Characteristics of patients undergoing CABG are shown in Table 1. Figure S1 shows the annual change in baseline characteristics for sex and racial groups over the study period. During the study period, comorbidity burden of patients undergoing CABG increased with prevalence of hypertension increasing from 59.6% to 64.9%, diabetes mellitus from 29.2% to 34.6%, and renal failure from 2.1% to 8.2%.
Table 1.
Characteristics of Patients Hospitalized for Coronary Artery Bypass Grafting Surgery
| Patient Characteristics | No. (%) of Patients | |||||||
|---|---|---|---|---|---|---|---|---|
| 1999–2000 | 2001–2002 | 2003–2004 | 2005–2006 | 2007–2008 | 2009–2010 | 2011–2012 | 2013–2014 | |
| No. of patients | 324 579 | 317 699 | 289 713 | 248 573 | 204 689 | 179 583 | 153 820 | 145 063 |
| Demographics | ||||||||
| Age, mean (SD), y | 74.4 (5.5) | 74.5 (5.6) | 74.6 (5.7) | 74.6 (5.8) | 74.6 (6.0) | 74.5 (6.1) | 74.5 (6.1) | 74.3 (6.1) |
| Women | 116 400 (35.9) | 112 489 (35.4) | 99 771 (34.4) | 82 766 (33.3) | 67 363 (32.9) | 57 222 (31.9) | 47 469 (30.9) | 42 188 (29.1) |
| White | 299 445 (92.3) | 291 096 (91.6) | 263 502 (91.0) | 225 572 (90.7) | 186 002 (90.9) | 162 853 (90.7) | 138 912 (90.3) | 130 165 (89.7) |
| Black | 12 911 (4.0) | 13 943 (4.4) | 13 556 (4.7) | 11 991 (4.8) | 9644 (4.7) | 8779 (4.9) | 7639 (5.0) | 7108 (4.9) |
| Other racea | 12 223 (3.8) | 12 660 (4.0) | 12 655 (4.4) | 11 010 (4.4) | 9043 (4.4) | 7951 (4.4) | 7269 (4.7) | 7790 (5.4) |
| Risk factors and cardiovascular conditions | ||||||||
| Hypertension | 193 444 (59.6) | 198 951 (62.6) | 184 127 (63.6) | 155 230 (62.4) | 133 451 (65.2) | 116 721 (65.0) | 104 896 (68.2) | 94 218 (64.9) |
| Diabetes mellitus | 94 821 (29.2) | 96 595 (30.4) | 89 670 (31.0) | 77 213 (31.1) | 65 131 (31.8) | 56 633 (31.5) | 51 997 (33.8) | 50 239 (34.6) |
| Unstable angina | 28 520 (8.8) | 22 995 (7.2) | 16 162 (5.6) | 10 748 (4.3) | 8213 (4.0) | 6524 (3.6) | 5213 (3.4) | 4522 (3.1) |
| Previous myocardial infarction | 23 225 (7.2) | 21 519 (6.8) | 17 387 (6.0) | 12 956 (5.2) | 11 652 (5.7) | 10 753 (6.0) | 9623 (6.3) | 9426 (6.5) |
| Previous heart failure | 33 467 (10.3) | 31 361 (9.9) | 28 163 (9.7) | 23 196 (9.3) | 19 091 (9.3) | 16 861 (9.4) | 15 222 (9.9) | 13 581 (9.4) |
| Peripheral vascular disease | 17 299 (5.3) | 17 516 (5.5) | 16 006 (5.5) | 13 857 (5.6) | 11 847 (5.8) | 9727 (5.4) | 8189 (5.3) | 6767 (4.7) |
| Stroke | 3534 (1.1) | 3401 (1.1) | 3017 (1.0) | 2626 (1.1) | 2282 (1.1) | 2003 (1.1) | 1856 (1.2) | 1728 (1.2) |
| Cerebrovascular disease other than stroke | 14 755 (4.5) | 13 998 (4.4) | 12 017 (4.1) | 9954 (4.0) | 8014 (3.9) | 6725 (3.7) | 5840 (3.8) | 4914 (3.4) |
| Geriatric conditions | ||||||||
| Dementia | 3218 (1.0) | 3603 (1.1) | 3686 (1.3) | 3438 (1.4) | 2949 (1.4) | 2916 (1.6) | 2253 (1.5) | 1311 (0.9) |
| Functional disability | 3396 (1.0) | 3187 (1.0) | 2872 (1.0) | 2168 (0.9) | 2107 (1.0) | 1887 (1.1) | 1907 (1.2) | 1710 (1.2) |
| Malnutrition | 3416 (1.1) | 3665 (1.2) | 4070 (1.4) | 4572 (1.8) | 5466 (2.7) | 6445 (3.6) | 6474 (4.2) | 6139 (4.2) |
| Other conditions | ||||||||
| Renal failure | 6822 (2.1) | 7857 (2.5) | 8489 (2.9) | 10 578 (4.3) | 12 644 (6.2) | 12 829 (7.1) | 12 515 (8.1) | 11 919 (8.2) |
| Chronic obstructive pulmonary disease | 61 177 (18.8) | 64 493 (20.3) | 61 583 (21.3) | 55 571 (22.4) | 39 291 (19.2) | 28 366 (15.8) | 24 681 (16.0) | 22 133 (15.3) |
| Pneumonia | 16 986 (5.2) | 17 320 (5.5) | 17 392 (6.0) | 16 164 (6.5) | 15 356 (7.5) | 14 726 (8.2) | 13 022 (8.5) | 11 856 (8.2) |
| Respiratory failure | 5658 (1.7) | 5315 (1.7) | 4895 (1.7) | 4724 (1.9) | 5403 (2.6) | 5152 (2.9) | 5190 (3.4) | 5080 (3.5) |
| Liver disease | 1136 (0.3) | 1290 (0.4) | 1304 (0.5) | 1174 (0.5) | 943 (0.5) | 865 (0.5) | 908 (0.6) | 971 (0.7) |
| Cancer | 12 957 (4.0) | 13 199 (4.2) | 12 006 (4.1) | 10 537 (4.2) | 8770 (4.3) | 7567 (4.2) | 6544 (4.3) | 5841 (4.0) |
Other races include Asian, Hispanic, North American Native, or other not specified.
Trends in CABG Utilization By Sex and Race
The proportion of women, among all those undergoing CABG, decreased linearly from 35.9% to 29.1% and experienced lower rates of CABG, but a greater relative decline than men. Women experienced a 65.7% relative decline in CABG procedures, from 370 per 100 000 person‐years in 1999 to 127 per 100 000 in 2014; the decline among men was 59.5%, from 967 per 100 000 person‐years in 1999 to 392 per 100 000 person‐years in 2014 (Figure 1). CABG utilization decreased in all racial subgroups as well as in all subgroups defined by different combinations of sex and race. For black patients, CABG procedure rates decreased by 51.4%, from 311 per 100 000 person‐years in 1999 to 151 per 100 000 person‐years; for white patients, it decreased by 59.8%, from 650 per 100 000 person‐years in 1999 to 261 per 100 000 person‐years (Figure 1). CABG procedure rates were highest in white men throughout the study period, compared with other sex‐ and race‐stratified subgroups.
Figure 1.
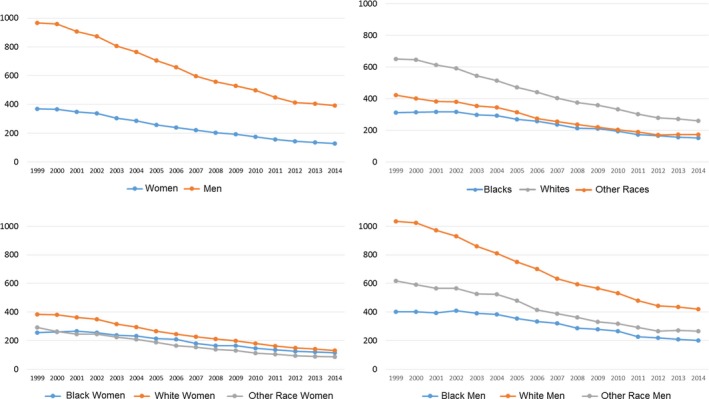
Rates of coronary artery bypass grafting procedures per 100 000 person‐years, by sex and race from 1999 to 2014.
Trends in Mortality Outcomes
From 1999 to 2014, there were absolute declines in the mortality rates in all subgroups. The overall in‐hospital mortality rate declined by 36.5% (5.2% [95% confidence interval {CI}, 5.0–5.3] in 1999 and 3.3% [95% CI, 3.2–3.4]) in 2014; 30‐day mortality declined by 29.8% (5.7% [95% CI, 5.6–5.8] to 4.0% [95% CI, 3.9–4.2]) over the study period. However, 1‐year mortality showed an initial rise from 4.8% (95% CI, 4.7–5.0) in 1999 to 5.7% (95% CI, 5.5–5.8) in 2005, followed by a decline to 4.7% (95% CI, 4.5–4.8) in 2013, a nearly 20% change in each direction.
In‐hospital mortality decreased for both sexes and all racial groups (Table 2; Figure S2). Women experienced higher in‐hospital mortality than men throughout the study period. Their in‐hospital mortality decreased by 27.3% (6.6% [95% CI, 6.4–6.8] in 1999 to 4.8% [95% CI, 4.5–5.1] in 2014), whereas in men it decreased by 37.2% (4.3% [95% CI, 4.2–4.5] in 1999 to 2.7% [95% CI, 2.6–2.9] in 2014). The adjusted annual decline in the in‐hospital mortality was slightly higher in women (−2.70% [95% CI, −2.97 to −2.44]) compared with men (−2.44% [95% CI, −2.67 to −2.21]). Black patients compared with white patients experienced higher in‐hospital mortality, with a 30% decline during the study period (6.0% [95% CI, 5.4–6.6] in 1999 to 4.2% [95% CI, 3.5–4.9] in 2014) compared with a 23.3% decline for white patients (5.1% [95% CI, 5.0–5.2] in 1999 to 3.3% [95% CI, 3.1–3.4] in 2014). After adjusting for comorbidities, there was a larger annual decline of −3.31% in black patients (95% CI, −4.02 to −2.60) compared with −2.51% in white patients (95% CI, −2.69 to −2.33; Figure 2).
Table 2.
Post–Coronary Artery Bypass Grafting Mortality Rates
| % (95% CI) | ||||||
|---|---|---|---|---|---|---|
| 1999 | 2002 | 2005 | 2008 | 2011 | 2014a | |
| In‐hospital mortality | ||||||
| No. of patients | 161 860 | 158 384 | 130 078 | 98 352 | 79 600 | 71 307 |
| Overall | 5.2 (5.0–5.3) | 4.7 (4.6–4.8) | 4.4 (4.3–4.5) | 3.8 (3.7–4.0) | 3.4 (3.3–3.6) | 3.3 (3.2–3.4) |
| Sex | ||||||
| Men | 4.3 (4.2–4.5) | 3.9 (3.8–4.0) | 3.7 (3.5–3.8) | 3.2 (3.1–3.3) | 2.9 (2.7–3.0) | 2.7 (2.6–2.9) |
| Women | 6.6 (6.4–6.8) | 6.0 (5.8–6.2) | 5.9 (5.7–6.2) | 5.2 (4.9–5.4) | 4.6 (4.4–4.9) | 4.8 (4.5–5.1) |
| Race | ||||||
| White | 5.1 (5.0–5.2) | 4.7 (4.6–4.8) | 4.4 (4.3–4.5) | 3.8 (3.7–3.9) | 3.4 (3.2–3.6) | 3.3 (3.1–3.4) |
| Black | 6.0 (5.4–6.6) | 5.0 (4.5–5.5) | 5.3 (4.7–5.9) | 4.9 (4.3–5.5) | 4.0 (3.4–4.6) | 4.2 (3.5–4.9) |
| Other raceb | 5.9 (5.3–6.5) | 4.6 (4.1–5.2) | 4.6 (4.1–5.1) | 4.0 (3.5–4.6) | 3.0 (2.5–3.6) | 3.4 (2.9–4.0) |
| White men | 4.3 (4.2–4.4) | 3.9 (3.8–4.1) | 3.6 (3.5–3.7) | 3.1 (3.0–3.3) | 2.9 (2.7–3.0) | 2.7 (2.6–2.9) |
| White women | 6.6 (6.3–6.8) | 6.0 (5.8–6.2) | 6.0 (5.7–6.2) | 5.2 (4.9–5.4) | 4.7 (4.5–5.0) | 4.7 (4.2–5.0) |
| Black men | 5.3 (4.6–6.2) | 4.2 (3.6–4.9) | 4.8 (4.0–5.6) | 4.5 (3.7–5.4) | 3.5 (2.8–4.4) | 3.3 (2.5–4.2) |
| Black women | 6.7 (5.8–7.4) | 5.7 (4.9–6.5) | 5.8 (5.0–6.7) | 5.3 (4.4–6.4) | 4.5 (3.6–5.5) | 5.3 (4.2–6.5) |
| 30‐d mortality | ||||||
| Overall | 5.7 (5.6–5.8) | 5.2 (5.1–5.3) | 4.8 (4.7–5.0) | 4.4 (4.2–4.5) | 3.8 (3.7–3.9) | 4.0 (3.9–4.2) |
| Sex | ||||||
| Men | 4.8 (4.7–5.0) | 4.5 (4.4–4.6) | 4.1 (3.9–4.2) | 3.7 (3.6–3.9) | 3.2 (3.1–3.4) | 3.4 (3.3–3.6) |
| Women | 7.2 (7.0–7.5) | 6.6 (6.4–6.8) | 6.4 (6.1–6.6) | 5.7 (5.4–5.9) | 5.1 (4.8–5.4) | 5.5 (5.2–5.9) |
| Race | ||||||
| White | 5.6 (5.5–5.8) | 5.2 (5.1–5.3) | 4.8 (4.7–4.9) | 4.3 (4.2–4.4) | 3.8 (3.7–3.9) | 4.0 (3.9–4.2) |
| Black | 6.5 (6.0–7.2) | 5.8 (5.3–6.4) | 5.4 (4.9–6.0) | 5.4 (4.8–6.1) | 4.3 (3.7–5.0) | 4.8 (4.1–5.5) |
| Other raceb | 6.4 (5.8–7.1) | 5.1 (4.6–5.7) | 4.8 (4.2–5.3) | 4.2 (3.6–4.8) | 3.4 (2.9–4.1) | 3.8 (3.2–4.4) |
| White men | 4.8 (4.7–4.9) | 4.5 (4.3–4.6) | 4.0 (3.9–4.2) | 3.7 (3.5–3.8) | 3.2 (3.0–3.4) | 3.4 (3.3–3.6) |
| White women | 7.2 (7.0–7.4) | 6.6 (6.2–6.8) | 6.5 (6.2–6.7) | 5.7 (5.4–5.9) | 5.2 (4.9–5.5) | 5.5 (5.1–5.8) |
| Black men | 5.5 (4.7–6.3) | 4.8 (4.1–5.6) | 5.0 (4.3–5.8) | 5.0 (4.2–6.0) | 4.0 (3.2–5.0) | 3.9 (3.0–4.8) |
| Black women | 7.6 (6.7–8.5) | 6.8 (6.0–7.7) | 5.9 (5.1–6.8) | 5.9 (4.9–6.9) | 4.6 (3.7–5.6) | 5.9 (4.8–7.2) |
| 1‐y mortality | ||||||
| Overall | 4.8 (4.7–5.0) | 5.1 (5.0–5.2) | 5.7 (5.5–5.8) | 5.4 (5.2–5.5) | 5.0 (4.8–5.1) | 4.7 (4.5–4.8) |
| Sex | ||||||
| Men | 4.5 (4.4–4.6) | 4.7 (4.6–4.8) | 5.2 (5.1–5.4) | 5.0 (4.8–5.2) | 4.6 (4.4–4.8) | 4.3 (4.1–4.5) |
| Women | 5.5 (5.3–5.7) | 5.9 (5.7–6.1) | 6.6 (6.3–6.8) | 6.2 (5.9–6.4) | 5.9 (5.6–6.2) | 5.6 (5.3–5.9) |
| Race | ||||||
| White | 4.7 (4.6–4.9) | 5.0 (4.9–5.1) | 5.5 (5.4–5.7) | 5.3 (5.1–5.4) | 4.8 (4.7–5.0) | 4.7 (4.5–4.8) |
| Black | 6.9 (6.2–7.5) | 7.2 (6.6–7.8) | 7.7 (7.1–8.4) | 6.8 (6.1–7.6) | 7.5 (6.7–8.4) | 5.7 (4.9–6.5) |
| Other raceb | 5.3 (4.8–6.0) | 4.7 (4.2–5.2) | 6.0 (5.3–6.6) | 5.9 (5.2–6.6) | 5.1 (4.5–5.9) | 3.9 (3.3–4.6) |
| White men | 4.4 (4.3–4.6) | 4.6 (4.5–4.8) | 5.1 (4.9–5.3) | 4.9 (4.8–5.1) | 4.5 (4.3–4.7) | 4.3 (4.1–4.5) |
| White women | 5.4 (5.2–5.6) | 5.7 (5.5–5.9) | 6.4 (6.2–6.7) | 6.0 (5.7–6.3) | 5.6 (5.3–5.9) | 5.6 (5.3–6.0) |
| Black men | 6.9 (6.0–7.9) | 8.0 (7.1–9.0) | 8.3 (7.3–9.3) | 7.5 (6.4–8.7) | 8.8 (7.5–10.2) | 5.7 (4.7–6.8) |
| Black women | 7.6 (6.7–8.5) | 6.8 (6.0–7.7) | 5.9 (5.1–6.8) | 5.9 (4.9–6.9) | 4.6 (3.7–5.6) | 5.9 (4.8–7.2) |
CI indicates confidence interval.
To permit complete follow‐up, we restricted the 1‐year mortality model to 2013 discharges.
Other races include Asian, Hispanic, North American Native, or other not specified.
Figure 2.
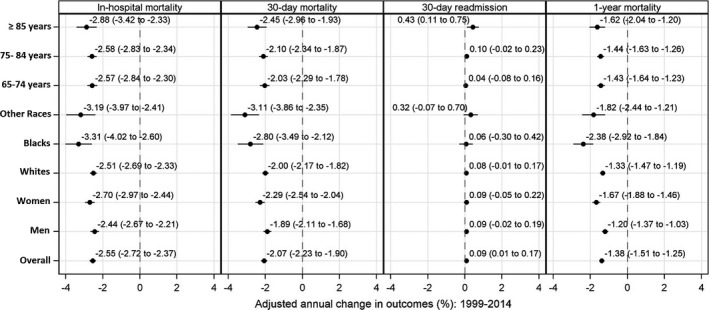
Adjusted annual change in coronary artery bypass grafting outcomes from 1999 to 2014.
We also found differences in temporal trends in 30‐day and 1‐year mortality for both sex and racial subgroups. Observed 30‐day mortality rates decreased in both men and women, and all racial subgroups, but mortality rates remained higher in women and black patients (Table 2; Figure S3). Adjusted 30‐day mortality showed a higher annual decline for women (−2.29%; 95% CI, −2.54 to −2.04) than men (−1.89%; 95% CI, −2.11 to −1.68), and for black patients (−2.80%; 95% CI, −3.49 to −2.12) than white patients (−2.00%; 95% CI, −2.17 to −1.82). For 1‐year mortality, there were higher rates within a year of undergoing CABG in women compared with men; 5.6% (95% CI, 5.3–5.9) versus 4.3% (95% CI, 4.1–4.5) in 2013, and in black patients compared with white patients; 5.7% (95% CI, 4.9−6.5) versus 4.7% (95% CI, 4.5–4.8) in 2013. However, in contrast with in‐hospital and 30‐day mortality, the observed rates of 1‐year mortality did not decline during the study period (Table 2; Figure S4). There were no differences in temporal trends in 1‐year mortality by sex. Observed 1‐year mortality also did not decrease among white patients, but there was a 17.4% decline in 1‐year mortality in black patients (6.9% [95% CI, 6.2–7.5] in 1999 to 5.7% [95% CI, 4.9–6.5] in 2013), predominantly after the year 2011. The adjusted 1‐year mortality showed a temporal decline and was different among the subgroups (Figure 2). After adjusting for changes in comorbidities over time, the annual decline in 1‐year mortality was higher in women (−1.67%; 95% CI, −1.88 to −1.46) compared with men (−1.20%; 95% CI, −1.37 to −1.03), and in black patients (−2.38%; 95% CI, −2.92 to −1.84) compared with white patients (−1.33%; 95% CI, −1.47 to −1.19). C‐indices for the in‐hospital, 30‐day, and 1‐year mortality models were 0.71, 0.72, and 0.72, respectively. For the outcome of in‐hospital mortality, the interaction term was significant for time and subgroup of men (P=0.02), as well as for time and white patients (P<0.001). Similarly, the interaction term for 30‐day and 1‐year mortality was statistically significant for time and men (P<0.001), and time and white patients (P<0.001).
Trends in Post‐CABG Readmissions
Observed 30‐day readmission rates also showed marked differences across subgroups of sex and race. The observed 30‐day readmission rate was higher in women than men, and in black patients than white patients, throughout the study period (Table 3; Figure S5). For women, it decreased by 22.0% (21.8% [95% CI, 21.5–22.2] in 1999 to 17.0% [95% CI, 16.5–17.5] in 2014), whereas for men it decreased by 24.6% (17.5% [95% CI, 17.3–17.7] to 13.2% [95% CI, 12.9–13.5]). For black patients, the observed 30‐day readmission rate decreased by 19.6% (21.4% [95% CI, 20.3–22.4] in 1999 to 17.2% [95% CI, 15.9–18.4] in 2014), whereas for white patients it decreased by 25.4% (18.9% [95% CI, 18.7–19.1] in 1999 to 14.1% [95% CI, 13.8–14.4] in 2014). Adjusted annual change in 30‐day readmission was insignificant for all the subgroups (Figure 2). The adjusted annual change of 30‐day readmission was similar for women (0.09% [95% CI, −0.05–0.22]) and men (0.09% [95% CI, −0.02–0.19]). Similarly, there was no significant change in the adjusted annual 30‐day readmission rates for black patients (0.06% per year; 95% CI, −0.30–0.42) and white patients (0.08% per year; 95% CI, −0.01–0.17). The C‐index for the readmission model was 0.58, with no significant interaction between subgroups.
Table 3.
Post–Coronary Artery Bypass Grafting 30‐Day Readmission Rates
| % (95% CI) | ||||||
|---|---|---|---|---|---|---|
| 1999 | 2002 | 2005 | 2008 | 2011 | 2014 | |
| No. of patients | 161 860 | 158 384 | 130 078 | 98 352 | 79 600 | 71 307 |
| Overall | 19.0 (18.8–19.2) | 19.3 (19.1–19.5) | 19.2 (19.0–19.4) | 18.7 (18.4–18.9) | 17.6 (17.3–17.9) | 14.3 (14.0–14.5) |
| Sex | ||||||
| Men | 17.5 (17.3–17.7) | 17.6 (17.4–17.8) | 17.6 (17.3–17.8) | 17.1 (16.8–17.4) | 15.9 (15.6–16.2) | 13.2 (12.9–13.5) |
| Women | 21.8 (21.5–22.2) | 22.5 (22.2–22.9) | 22.5 (22.1–22.9) | 22.0 (21.5–22.5) | 21.4 (20.9–22.0) | 17.0 (16.5–17.5) |
| Race | ||||||
| White | 18.9 (18.7–19.1) | 19.1 (18.9–19.3) | 19.0 (18.7–19.2) | 18.5 (18.2–18.7) | 17.4 (17.1–17.7) | 14.1 (13.8–14.4) |
| Black | 21.4 (20.3–22.4) | 22.0 (21.0–23.0) | 22.3 (21.3–23.4) | 22.0 (20.7–23.2) | 21.0 (19.7–22.4) | 17.2 (15.9–18.4) |
| Other racea | 20.7 (19.7–21.8) | 20.6 (19.6–21.6) | 20.4 (19.4–21.5) | 19.9 (18.7–21.1) | 17.9 (16.6–19.2) | 14.5 (13.4–15.6) |
| White men | 17.4 (17.2–17.6) | 17.5 (17.2–17.7) | 17.5 (17.2–17.7) | 17.0 (16.7–17.3) | 15.8 (15.5–16.1) | 13.1 (12.8–13.4) |
| White women | 21.7 (21.3–22.0) | 22.4 (22.0–22.8) | 22.2 (21.8–22.6) | 21.7 (21.2–22.2) | 21.2 (20.6–21.8) | 16.8 (16.2–17.3) |
| Black men | 19.3 (17.8–20.7) | 20.0 (18.6–21.4) | 19.2 (17.8–20.6) | 19.1 (17.5–20.7) | 18.2 (16.5–19.9) | 15.2 (13.6–16.8) |
| Black women | 23.4 (21.9–25.0) | 24.0 (22.5–25.4) | 25.6 (24.0–27.2) | 25.3 (23.4–27.2) | 24.2 (22.2–26.2) | 19.7 (17.7–21.7) |
CI indicates confidence interval.
Other races include Asian, Hispanic, North American Native, or other not specified.
Discussion
Between 1999 and 2014, overall CABG utilization in fee‐for‐service Medicare beneficiaries decreased by more than 50%, with concurrent decreases in post‐CABG mortality in all sex and race groups. Despite narrowing of the differences in post‐CABG mortality over the study period, women and black patients continued to have worse outcomes. Furthermore, the burden of hospitalizations in the post‐CABG period was high throughout the period, with 1 in 5 patients undergoing CABG readmitted within 30 days of discharge.
Previous studies evaluating trends of sex‐ and race‐related differences in outcomes are dated, focus on CABG utilization over a shorter period of time, and have not adequately addressed differences in outcomes between these subgroups.12, 13, 14 Furthermore, recent studies have not specifically evaluated sex‐ and race‐related differences in outcomes and utilization.15, 16 By using estimates spanning 2 decades, we report contemporary national patterns of CABG utilization, which can be used to adjudge the priority of post‐CABG care as a priority for health policy interventions. Furthermore, our study highlights the care needs of the fee‐for‐service Medicare community, especially for women and black patients, and can guide the restructuring of care delivery that is necessary for the shrinking patient population undergoing CABG.
Despite narrowing of sex differences in mortality over the past 2 decades, women continued to experience worse in‐hospital and 1‐year mortality relative to men. This is in the context of continued lower rates of CABG use in women relative to men, which may be attributed to fewer surgical referrals in women.20 Whereas the limited clinical detail captured in administrative data sets precludes the complete assessment of factors that underlie these differences, previous studies have demonstrated that women have a more challenging coronary anatomy than men,21, 22, 23, 24 are less likely to receive complete revascularization,24, 25 and have higher rates of graft failure,21, 22 resulting in higher mortality rates. Dedicated studies that can evaluate patterns of referral, treatment decisions, and surgical outcomes are essential to close the sex‐based gaps in post‐CABG mortality among women.
Similarly, racial differences in utilization and mortality narrowed over the study period, but disparities persisted at the end of the study period. In contrast to sex differences, previous studies have suggested that biological differences between racial groups contribute little to the differences in outcomes, which are driven largely by differences in socioeconomic well‐being and quality of care at hospitals where black patients seek care.6, 26, 27, 28, 29, 30, 31, 32 The continued high post‐CABG mortality in black patients merits further investments in targeting hospital‐level quality improvement interventions, as well as in strengthening systems for transitions of care outside the hospital and developing community support interventions that support this unique sociocultural group.
We made other important observations that merit consideration. First, after adjusting for changes in patient risk over time, rates of 30‐day readmission did not decrease over the past 2 decades across all patient groups. To date, the temporal trends in 30‐day readmission rate following CABG were largely unknown. Given that the improvements in mortality have not translated into improved readmission rates, it could be argued that measures to lower mortality may be insufficient in improving this outcome, and interventions would need to target specific outcomes. With the addition of 30‐day readmission rates following CABG into the Hospital Readmissions Reduction Program in 2015,33 future studies are warranted to assess the impact of this program on post‐CABG 30‐day readmissions. Second, we observed that the overall CABG utilization decreased throughout the study period. Given that the rate of percutaneous coronary intervention has remained relatively stable over the past few years,15 this declining trend of CABG may be attributed to better primary and secondary prevention in the older population.
The results of this study should be interpreted in light of the following limitations. First, it has an observational design and uses administrative claims data. Therefore, we cannot definitively identify factors that drive changes in CABG utilization and outcomes over time. However, the design of the study is consistent with its goal—to describe important sex and race differences in outcomes to appraise real‐world effects of quality improvement interventions on reducing disparities in post‐CABG outcomes. Second, the procedure and presence of comorbidities were identified from administrative codes and not clinical diagnoses, which can be prone to error. However, we used a combination of administrative codes that account for institutional and temporal variation in coding practices over time. In addition, the administrative codes have been shown to be highly specific for cardiovascular diagnosis and risk factors.34 Third, the study focused on fee‐for‐service Medicare beneficiaries aged ≥65 years and did not include the Medicare Advantage population; this may not reflect trends in other patient populations. However, all‐payer studies have also shown reduced use of CABG and improved outcomes,35 suggesting that our findings may be relevant outside of the fee‐for‐service population. Nevertheless, we cannot make a direct assessment of patients not enrolled in fee‐for‐service Medicare. Fourth, we did not account for observational stays in our study design. However, studies have shown that the observational stays do not correlate with change in readmission rates in Medicare beneficiaries for both targeted and nontargeted conditions under the Hospital Readmissions Reduction Program.36 Finally, we used claims data, which lack clinical detail. However, the claims‐based Centers for Medicare & Medicaid Services model for hospital‐level 30‐day all‐cause mortality following CABG has performed well with a C‐statistic of 0.74, which is similar to the model developed from New York Cardiac Surgery Reporting System Registry data (C‐statistic, 0.75).37 Both the claims‐based and clinical model for all‐cause CABG mortality have shown strong agreement with a correlation of 0.90.
Conclusion
During the past decade and a half, sex and racial differences in CABG utilization have narrowed over time. Concurrently, there have been improvements in mortality following CABG, with narrowing of sex and racial differences over time. However, women and black patients continue to experience higher mortality than men and white patients, respectively.
Sources of Funding
Dr Khera is supported by the National Heart, Lung, and Blood Institute (5T32HL125247‐02) and the National Center for Advancing Translational Sciences (UL1TR001105) of the National Institutes of Health. Dr Desai is supported by grant K12 HS023000‐04 from the Agency for Healthcare Research and Quality. The funders had no role in the design and conduct of the study.
Disclosures
Dr Desai and Dr Krumholz work under contract with the Centers for Medicare & Medicaid Services to develop and maintain performance measures that are publicly reported, and are recipients of research agreements from Johnson & Johnson (Janssen), through Yale, to develop methods of clinical trial data sharing. Dr Krumholz was a recipient of a grant from Medtronic and the US Food and Drug Administration, through Yale, to develop methods for post–market surveillance of medical devices; chairs a cardiac scientific advisory board for UnitedHealth; is a participant/participant representative of the IBM Watson Health Life Sciences Board; is a member of the advisory board for Element Science and the physician advisory board for Aetna; and is the founder of Hugo, a personal health information platform. The remaining authors have no disclosures to report.
Supporting information
Figure S1. Annual change in the baseline characteristics of women, men, black patients, white patients and patients of other races.
Figure S2. In‐hospital mortality rates in patients undergoing CABG by sex and race from 1999 to 2014.
Figure S3. 30‐day mortality rates in patients undergoing CABG by sex and race from 1999 to 2014.
Figure S4. 1‐year mortality rates in patients undergoing CABG by sex and race from 1999 to 2014.
Figure S5. 30‐day readmission rates in patients undergoing CABG by sex and race from 1999 to 2014.
(J Am Heart Assoc. 2018;7:e009014 DOI: 10.1161/JAHA.118.009014.)
References
- 1. Weiss A, Elixhauser A. Trends in operating room procedures in U.S. hospitals, 2001–2011: Statistical Brief #171. Healthcare Cost and Utilization Project (HCUP) Statistical Briefs: Agency for Healthcare Research and Quality (US); 2014.
- 2. Weiss A, Elixhauser A, Andrews R. Characteristics of operating room procedures in U.S. hospitals, 2011: Statistical Brief #170. Healthcare Cost and Utilization Project (HCUP) Statistical Briefs: Agency for Healthcare Research and Quality (US); 2014. [PubMed]
- 3. Bridges CR, Edwards FH, Peterson ED, Coombs LP. The effect of race on coronary bypass operative mortality. J Am Coll Cardiol. 2000;36:1870–1876. [DOI] [PubMed] [Google Scholar]
- 4. Castellanos LR, Li Z, Yeo KK, Young JN, Ayanian JZ, Amsterdam EA. Relation of race, ethnicity and cardiac surgeons to operative mortality rates in primary coronary artery bypass grafting in California. Am J Cardiol. 2011;107:1–5. [DOI] [PubMed] [Google Scholar]
- 5. Hartz RS, Rao AV, Plomondon ME, Grover FL, Shroyer AL. Effects of race, with or without gender, on operative mortality after coronary artery bypass grafting: a study using the Society of Thoracic Surgeons national database. Ann Thorac Surg. 2001;71:512–520. [DOI] [PubMed] [Google Scholar]
- 6. Khera R, Vaughan‐Sarrazin M, Rosenthal GE, Girotra S. Racial disparities in outcomes after cardiac surgery: the role of hospital quality. Curr Cardiol Rep. 2015;17:29. [DOI] [PMC free article] [PubMed] [Google Scholar]
- 7. Pollock B, Hamman BL, Sass DM, Da Graca B, Grayburn PA, Filardo G. Effect of gender and race on operative mortality after isolated coronary artery bypass grafting. Am J Cardiol. 2015;115:614–618. [DOI] [PubMed] [Google Scholar]
- 8. O'Connor GT, Plume SK, Olmstead EM, Morton JR, Maloney CT, Nugent WC, Hernandez F Jr, Clough R, Leavitt BJ, Coffin LH, Marrin CA, Wennberg D, Birkmeyer JD, Charlesworth DC, Malenka DJ, Quinton HB, Kasper JF. A regional intervention to improve the hospital mortality associated with coronary artery bypass graft surgery. The Northern New England Cardiovascular Disease Study Group. JAMA. 1996;275:841–846. [PubMed] [Google Scholar]
- 9. Siegel B, Sears V, Bretsch JK, Wilson M, Jones KC, Mead H, Hasnain‐Wynia R, Ayala RK, Bhalla R, Cornue CM, Emrich CM, Patel P, Setzer JR, Suitonu J, Velazquez EJ, Eagle KA, Winniford MD. A quality improvement framework for equity in cardiovascular care: results of a national collaborative. J Healthc Qual. 2012;34:32–42. [DOI] [PubMed] [Google Scholar]
- 10. National Conference of State Legislatures . Health Disparities: State Laws. 2014. Available at: http://www.ncsl.org/research/health/health-disparities-laws.aspx. Accessed February 21, 2018.
- 11. The Go Red for Women Campaign: American Heart Association . Available at: http://www.goredforwomen.org. Accessed February 21, 2018.
- 12. Basu J, Mobley LR. Trends in racial disparities among the elderly for selected procedures. Med Care Res Rev. 2008;65:617–637. [DOI] [PubMed] [Google Scholar]
- 13. Gillum RF. Coronary revascularization in older women and men in the United States: trends in ethnic differences. Am Heart J. 2004;147:418–424. [DOI] [PubMed] [Google Scholar]
- 14. Gillum RF, Gillum BS, Francis CK. Coronary revascularization and cardiac catheterization in the United States: trends in racial differences. J Am Coll Cardiol. 1997;29:1557–1562. [DOI] [PubMed] [Google Scholar]
- 15. Culler SD, Kugelmass AD, Brown PP, Reynolds MR, Simon AW. Trends in coronary revascularization procedures among Medicare beneficiaries between 2008 and 2012. Circulation. 2014;131:362–370. [DOI] [PubMed] [Google Scholar]
- 16. McNeely C, Markwell S, Vassileva C. Trends in patient characteristics and outcomes of coronary artery bypass grafting in the 2000 to 2012 Medicare population. Ann Thorac Surg. 2016;102:132–138. [DOI] [PubMed] [Google Scholar]
- 17. Krumholz HM, Wang Y, Mattera JA, Wang Y, Han LF, Ingber MJ, Roman S, Normand SL. An administrative claims model suitable for profiling hospital performance based on 30‐day mortality rates among patients with an acute myocardial infarction. Circulation. 2006;113:1683–1692. [DOI] [PubMed] [Google Scholar]
- 18. Krumholz HM, Wang Y, Mattera JA, Wang Y, Han LF, Ingber MJ, Roman S, Normand SL. An administrative claims model suitable for profiling hospital performance based on 30‐day mortality rates among patients with heart failure. Circulation. 2006;113:1693–1701. [DOI] [PubMed] [Google Scholar]
- 19. Lin DY, Wei LJ, Ying Z. Model‐checking techniques based on cumulative residuals. Biometrics. 2002;58:1–12. [DOI] [PubMed] [Google Scholar]
- 20. Khan SS, Nessim S, Gray R, Czer LS, Chaux A, Matloff J. Increased mortality of women in coronary artery bypass surgery: evidence for referral bias. Ann Intern Med. 1990;112:561–567. [DOI] [PubMed] [Google Scholar]
- 21. Loop FD, Golding LR, Macmillan JP, Cosgrove DM, Lytle BW, Sheldon WC. Coronary artery surgery in women compared with men: analyses of risks and long‐term results. J Am Coll Cardiol. 1983;1:383–390. [DOI] [PubMed] [Google Scholar]
- 22. Tyras DH, Barner HB, Kaiser GC, Codd JE, Laks H, Willman VL. Myocardial revascularization in women. Ann Thorac Surg. 1978;25:449–453. [DOI] [PubMed] [Google Scholar]
- 23. O'Connor NJ, Morton JR, Birkmeyer JD, Olmstead EM, O'Connor GT. Effect of coronary artery diameter in patients undergoing coronary bypass surgery. Circulation. 1996;93:652–655. [DOI] [PubMed] [Google Scholar]
- 24. Douglas JS Jr, King SB III, Jones EL, Craver JM, Bradford JM, Hatcher CR Jr. Reduced efficacy of coronary bypass surgery in women. Circulation. 1981;64:II11–II16. [PubMed] [Google Scholar]
- 25. Jabagi H, Tran DT, Hessian R, Glineur D, Rubens FD. Impact of gender on arterial revascularization strategies for coronary artery bypass grafting. Ann Thorac Surg. 2018;105:62–68. [DOI] [PubMed] [Google Scholar]
- 26. Kressin NR, Petersen LA. Racial differences in the use of invasive cardiovascular procedures: review of the literature and prescription for future research. Ann Intern Med. 2001;135:352–366. [DOI] [PubMed] [Google Scholar]
- 27. Conigliaro J, Whittle J, Good CB, Hanusa BH, Passman LJ, Lofgren RP, Allman R, Ubel PA, O'Connor M, Macpherson DS. Understanding racial variation in the use of coronary revascularization procedures: the role of clinical factors. Arch Intern Med. 2000;160:1329–1335. [DOI] [PubMed] [Google Scholar]
- 28. McGee D, Cooper R, Liao Y, Durazo‐Arvizu R. Patterns of comorbidity and mortality risk in blacks and whites. Ann Epidemiol. 1996;6:381–385. [DOI] [PubMed] [Google Scholar]
- 29. Phelan JC, Link BG, Tehranifar P. Social conditions as fundamental causes of health inequalities: theory, evidence, and policy implications. J Health Soc Behav. 2010;51(suppl):S28–S40. [DOI] [PubMed] [Google Scholar]
- 30. Kramer MR, Valderrama AL, Casper ML. Decomposing black‐white disparities in heart disease mortality in the United States, 1973–2010: an age‐period‐cohort analysis. Am J Epidemiol. 2015;182:302–312. [DOI] [PMC free article] [PubMed] [Google Scholar]
- 31. Lindblad‐Goldberg M, Dukes JL. Social support in black, low‐income, single‐parent families: normative and dysfunctional patterns. Am J Orthopsychiatry. 1985;55:42–58. [DOI] [PubMed] [Google Scholar]
- 32. Rangrass G, Ghaferi AA, Dimick JB. Explaining racial disparities in outcomes after cardiac surgery: the role of hospital quality. JAMA Surg. 2014;149:223–227. [DOI] [PubMed] [Google Scholar]
- 33. Centers for Medicare & Medicaid Services . Readmissions Reduction Program (HRRP). Available at: https://www.cms.gov/medicare/medicare-fee-for-service-payment/acuteinpatientpps/readmissions-reduction-program.html. Accessed February 21, 2018.
- 34. Birman‐Deych E, Waterman AD, Yan Y, Nilasena DS, Radford MJ, Gage BF. Accuracy of ICD‐9‐CM codes for identifying cardiovascular and stroke risk factors. Med Care. 2005;43:480–485. [DOI] [PubMed] [Google Scholar]
- 35. Epstein AJ, Polsky D, Yang F, Yang L, Groeneveld PW. Coronary revascularization trends in the United States, 2001–2008. JAMA. 2011;305:1769–1776. [DOI] [PMC free article] [PubMed] [Google Scholar]
- 36. Zuckerman RB, Sheingold SH, Orav EJ, Ruhter J, Epstein AM. Readmissions, observation, and the Hospital Readmissions Reduction Program. N Engl J Med. 2016;374:1543–1551. [DOI] [PubMed] [Google Scholar]
- 37. Centers for Medicare & Medicaid Services . Hospital‐level 30‐day All‐Cause Mortality Following Coronary Artery Bypass Graft Surgery. 2014. Available at: https://www.cms.gov/Medicare/Quality-Initiatives-Patient-Assessment-Instruments/HospitalQualityInits/Downloads/Coronary-Artery-Bypass-Graft-CABG-Mortality.zip. Accessed February 21, 2018.
Associated Data
This section collects any data citations, data availability statements, or supplementary materials included in this article.
Supplementary Materials
Figure S1. Annual change in the baseline characteristics of women, men, black patients, white patients and patients of other races.
Figure S2. In‐hospital mortality rates in patients undergoing CABG by sex and race from 1999 to 2014.
Figure S3. 30‐day mortality rates in patients undergoing CABG by sex and race from 1999 to 2014.
Figure S4. 1‐year mortality rates in patients undergoing CABG by sex and race from 1999 to 2014.
Figure S5. 30‐day readmission rates in patients undergoing CABG by sex and race from 1999 to 2014.