Abstract
Background
Slow conduction zone in a verapamil‐sensitive reentrant atrial tachycardia originating from atrioventricular annulus is composed of calcium channel–dependent tissue. We examined whether there was a slow potential (SP) at the entrance of the slow conduction zone.
Methods and Results
We first identified the pacing site from where manifest entrainment and orthodromic capture of the earliest atrial activation site were demonstrated in 40 atrioventricular annulus patients with atrioventricular annulus. Radiofrequency energy was then delivered 2 cm proximal to the earliest atrial activation site in the direction of entrainment pacing site and gradually advanced toward the earliest atrial activation site until atrial tachycardia termination to localize the entrance of the slow conduction zone. Electrogram characteristics were analyzed at successful and unsuccessful ablation sites. During sinus rhythm, SP was observed at all 40 successful sites, but was observed at only 12 unsuccessful sites (P<0.0001). During sinus rhythm, there was no significant difference in electrogram amplitude nor width of atrial electrogram between successful and unsuccessful sites (0.407±0.281 versus 0.487±0.447 mV [P=0.1989] and 37.0±9.2 versus 38.9±8.0 ms [P=0.1773]); however, SP amplitude and width at successful sites were significantly greater than those at unsuccessful sites (0.110±0.049 versus 0.025±0.046 mV [P<0.0001] and 38.8±13.4 versus 8.1±13.2 ms [P<0.0001]). During atrial tachycardia, SP amplitude was significantly attenuated (0.088±0.042 versus 0.110±0.049 mV, P<0.001) and SP width was significantly prolonged (47.8±14.1 versus 38.8±13.4 ms, P<0.0001) at successful sites.
Conclusions
SP was observed during sinus rhythm at the entrance of the slow conduction zone; however, SP amplitude was attenuated and SP width was prolonged during atrial tachycardia, suggesting that SP reflects the characteristics of calcium channel–dependent tissue involved in atrioventricular annulus reentry circuit.
Keywords: atrial tachycardia, catheter ablation, mapping
Subject Categories: Arrhythmias, Electrophysiology
Clinical Perspective
What Is New?
The underlying mechanism of verapamil‐sensitive atrial tachycardia (AT) arising from the atrioventricular annulus is reentry.
Calcium channel–dependent tissue is involved in the slow conduction zone of the AT reentry circuit.
This form of AT is distributed not only in the atrioventricular node vicinity but also along the atrioventricular annulus with common tachycardia features.
Slow potential was observed at the entrance of the slow conduction zone of the AT reentry circuit during sinus rhythm.
What Are the Clinical Implications?
Slow potential amplitude was attenuated and its electrogram width was prolonged during AT.
Slow potential reflects the characteristics of calcium channel–dependent tissue involved in the AT reentry circuit.
Introduction
Slow potential (SP) has been found to be helpful in identifying target sites for radiofrequency catheter ablation of the slow pathway in patients with atrioventricular nodal reentrant tachycardia.1, 2, 3 These SPs, which were observed in the region along the septal tricuspid annulus close to the coronary sinus (CS) ostium, can be a marker for successful slow pathway ablation, suggesting that the SP reflects a substrate of slow pathway composed of calcium channel–dependent tissue. Meanwhile, it has also been shown that calcium channel–dependent tissue is involved in the tachycardia circuit of verapamil‐sensitive atrial tachycardia (AT) arising from the atrioventricular annulus.4, 5 We have recently shown that the underlying mechanism of the verapamil‐sensitive AT arising from the atrioventricular annulus is caused by reentry with a slow conduction zone (SCZ) involved in the circuit.6, 7 We have also shown that radiofrequency energy delivery at the entrance site of the SCZ, which is comprised of calcium channel–dependent tissue, is effective in eliminating the tachycardia.6, 7 Since calcium channel–dependent tissue is involved in the SCZ of the verapamil‐sensitive reentrant AT originating from the atrioventricular annulus, we examined whether there was an SP at the entrance of the SCZ, which specifically reflects calcium channel–dependent tissue.
Methods
Written informed consent was obtained from each patient. The protocol was approved by the Hospital Human Research Committee. The data, analytic methods, and study materials will not be made available to other researchers for purposes of reproducing the results or replicating the procedure.
Electrophysiological Study
Two 6‐F quadripolar electrode catheters (St. Jude Medical) were positioned in the His bundle (HB) region and at the right ventricular apex. A 6‐F 20‐pole electrode catheter (St. Jude Medical) was introduced into the CS. Two 7‐F 4‐mm tip, deflectable quadripolar electrode catheters with a 2‐mm interelectrode distance (Biosense Webster, Inc, or Japan Lifeline) were advanced into the right atrium (RA) for atrial mapping, pacing, and ablation. Bipolar electrograms were filtered between 50 and 600 Hz and recorded along with the surface ECG using a polygraph (EP‐workmate; EP Med. Systems, Inc). Atrial and ventricular pacing were performed using a cardiac stimulator (SEC‐4103; Nihon Kohden). AT was diagnosed using the standard criteria.5, 6, 7, 8
Identification of the Entrance of the SCZ
After right atriography in a biplane view, the RA was mapped during AT using a noncontact mapping system (EnSite 3000; St. Jude Medical) or contact mapping system (EnSite NavX; St. Jude Medical) to identify the earliest atrial activation site (EAAS). The electrogram at the EAAS was validated by contact bipolar and unipolar electrograms in all patients. The location of the EAAS was expressed relative to the location of the HB site in the verapamil‐sensitive AT arising from the vicinity of the atrioventricular node (AVN‐AT),6, 9 while the location of the EAAS in the verapamil‐sensitive AT arising from the atrioventricular annulus other than the atrioventricular node vicinity (AVA‐AT) was expressed in a clockwise direction around the atrioventricular annulus.7 During noncontact mapping, a 9‐F multielectrode array catheter was introduced from the right femoral 10‐F sheath into the RA, deployed over a 0.032‐inch guide wire, and its distal tip was fixed in the right ventricular outflow. Details of the EnSite 3000 system have been previously described.10 The proximity of the SCZ in the reentry circuit was identified utilizing an entrainment technique.11 While recording the contact atrial electrogram at the EAAS, rapid atrial pacing at a rate 5 beats per minute faster than the tachycardia rate was delivered to demonstrate manifest entrainment and orthodromic capture of the EAAS12 (Figure 1). When manifest entrainment with orthodromic capture of the EAAS was demonstrated, the pacing site was considered to be proximal to the SCZ of the reentry circuit13 (entrainment pacing site; Figure 1). Rapid pacing was delivered from 8 sites on the RA: high anterolateral RA; high posterolateral RA; high anteroseptal RA; high posteroseptal RA; low anterolateral RA; low posterolateral RA; low posteroseptal RA; and CS ostium. After identification of a site proximal to the SCZ (entrainment pacing site; Figure 1), radiofrequency energy was delivered to a site 2 cm away from the EAAS in the direction of the entrainment pacing site (Figure 1), based on the size of the SCZ in the reentry circuit of the atrioventricular nodal reentrant tachycardia, being 1 to 2 cm in length.14 A current of 15 to 20 W was delivered with the temperature limit set at 55°C using a radiofrequency energy generator (CABL‐IT; Central Inc). When AT was not terminated, the energy application site was advanced in a stepwise fashion by 2 to 3 mm toward the EAAS until tachycardia termination to define the entrance of the SCZ of the reentry circuit (Figure 1).
Figure 1.
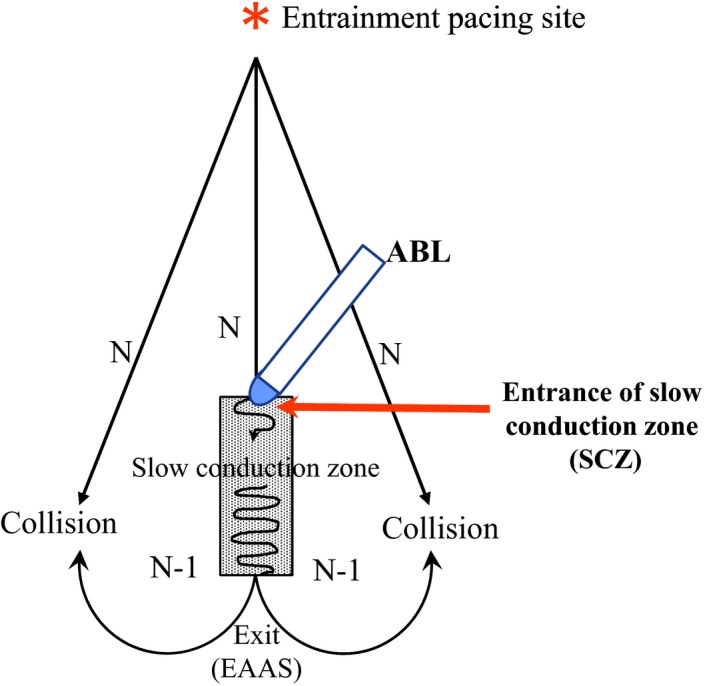
Schematic drawing of the method for the identification of the entrance of the slow conduction zone (SCZ) using entrainment and ablation techniques. ABL indicates ablation catheter; EAAS, earliest atrial activation site.
Analysis of the Local Electrogram
The morphology and electrophysiologic characteristics of the local electrograms at both the successful and unsuccessful ablation sites were analyzed. The SP was defined as a discrete and low amplitude deflection with a slow rate of rise occupying the interval between the atrial and ventricular potentials.1, 3 The electrogram amplitude and width of the atrial electrogram and the SP were measured during sinus rhythm and compared between the successful and unsuccessful ablation sites. The electrogram amplitude and width of SP at the successful site during sinus rhythm in AVN‐AT were compared with those in AVA‐AT. To define the change in the electrogram morphology following the change in heart rate, the electrogram amplitude and the width of the atrial electrogram and the SP at the successful ablation sites during sinus rhythm were compared with those during AT.
Statistical Analysis
Values are expressed as mean±SD. Differences between clinical variables and electrophysiologic parameters were analyzed using either a paired or an unpaired Student t test for quantitative data or chi‐square analysis for qualitative data. A value of P<0.05 was considered significant.
Statement of Responsibility
The authors had full access to the data and take full responsibility for its integrity. All authors have read and agree with the article as written.
Results
Patients
Forty consecutive patients with verapamil‐sensitive AT arising from the atrioventricular annulus who were referred for electrophysiologic study and radiofrequency catheter ablation (17 men and 23 women; mean age 64 years, range 14–83 years) were included in this study. There were 18 patients with AVN‐AT and 22 patients with AVA‐AT.
In all patients, AT was induced and terminated by atrial rapid and extrastimulus pacing and an inverse relationship between A1A2 and A2Ae was observed during the induction of AT by atrial extrastimulus pacing. AT was terminated by intravenous verapamil (2.5 mg in 28 patients and 5 mg in 12 patients) before the electrophysiological study and by intravenous 5 mg adenosine triphosphate during the electrophysiological study in all patients. The mean tachycardia cycle length was 433.5±82.1 ms. The EAAS was observed in the vicinity of the EAAS in the AVN‐AT group and along the tricuspid annulus in the AVA‐AT group in all patients.
Manifest Entrainment and Catheter Ablation
Manifest entrainment was demonstrated by the rapid atrial pacing delivered from 1 specific site in each patient, being associated with the orthodromic capture of the earliest atrial electrogram. In all patients, AT was terminated by the application of radiofrequency energy, which was delivered to the site proximal to the EAAS in the direction of the rapid pacing site from where the manifest entrainment was observed. The distance between the EAAS and the successful energy application site was 9.5±2.3 mm (7–17 mm). The onset of atrial electrogram at the successful radiofrequency energy application site occurred 12.9±5.7 ms later than that of the EAAS. AT was terminated immediately after the onset of radiofrequency energy delivery (3.0±1.0 seconds). The mean number of radiofrequency applications required for successful ablation was 4±2. Ablation was not associated with any complications.
There were no significant differences in the tachycardia cycle length (437.5±92.1 versus 426.3±75.7 ms, P=0.6714), the distance between the EAAS and the successful ablation site (9.1±2.5 versus 9.8±2.1 mm, P=0.3372), the interval from the onset of atrial electrogram at the EAAS to that at the successful ablation site (13.9±6.5 versus 12.1±5.0 ms, P=0.3382), or the interval from the onset of radiofrequency energy delivery to the tachycardia termination (2.9±1.1 versus 3.1±1.0 seconds, P=0.522) between the AVN‐AT and AVA‐AT groups. In the AVN‐AT group, the distance between the HB site and the successful ablation site was significantly longer than that between the HB site and the EAAS (13.7±3.3 versus 6.8±1.8 mm, P<0.0001). Therefore, the successful ablation site was located more distantly from the HB site than the EAAS.
Characteristics of the Local Electrograms at the Successful and Unsuccessful Sites During Sinus Rhythm
The amplitude and width of the atrial electrograms during sinus rhythm at the successful ablation site were not different from those at the unsuccessful ablation site (0.407±0.281 versus 0.487±0.447 mV [P=0.1989] and 37.0±9.2 versus 38.9±8.0 ms [P=0.1773], respectively) (Table). The SP was observed at the successful ablation site in all 40 patients during sinus rhythm but was observed in only 12 patients at the unsuccessful ablation site during sinus rhythm (P<0.0001) (Table). The electrogram amplitude of the SP during sinus rhythm at the successful ablation site was significantly higher than that at the unsuccessful ablation site (0.110±0.049 versus 0.025±0.046 mV, P<0.0001) (Table). The electrogram width of the SP during sinus rhythm at the successful ablation site was significantly wider than that at the unsuccessful ablation site (38.8±13.4 versus 8.1±13.2 ms, P<0.0001) (Table). The distance between the EAAS and the unsuccessful ablation site was significantly longer than that between the EAAS and the successful ablation site (15.1±3.4 versus 9.5±2.3 mm, P<0.0001) (Table).
Table 1.
Local Electrogram Characteristics at the Successful and Unsuccessful Sites
| Successful RF Site During SR | Successful RF Site During AT | Unsuccessful RF Site During SR | |
|---|---|---|---|
| Atrial electrogram | |||
| Amplitude, mV | 0.407±0.281 | 0.430±0.304 | 0.487±0.447 |
| Width, mm | 37.0±9.2 | 39.2±8.0 | 38.9±8.0 |
| Slow potential | 40/40 Patients | 40/40 Patients | 12/40 Patientsa |
| Amplitude, mV | 0.110±0.049 | 0.088±0.042b | 0.025±0.046a |
| Width, mm | 38.8±13.4 | 47.8±14.1a | 8.1±13.2a |
| Distance between EAAS and RF site, mm | 9.5±2.3 | 15.1±3.4a | |
AT indicates atrial tachycardia; EAAS, earliest atrial activation site during AT; SR, sinus rhythm.
P<0.0001 vs successful radiofrequency energy (RF) ablation site during sinus rhythm.
P<0.001 vs successful RF site during sinus rhythm.
Comparison of the SP at the Successful Site Between AVN‐AT and AVA‐AT
There were no significant differences in the electrogram amplitude of the SP and the electrogram width of the SP between the AVN‐AT and AVA‐AT both during sinus rhythm (0.094±0.047 versus 0.163±0.175 mV [P=0.1126] and 39.4±15.2 versus 35.9±16.1 ms [P=0.4913], respectively) and during AT (0.086±0.037 versus 0.089±0.046 mV [P=0.8519] and 45.7±14.2 versus 49.5±14.1 ms [P=0.4038], respectively).
Changes in the Local Electrogram Morphology at the Successful Site During AT
There were no significant differences between the atrial electrogram amplitude and width during AT and those during sinus rhythm (0.430±0.304 versus 0.407±0.281 mV [P=0.5856] and 39.2±8.0 versus 37.0±9.2 ms [P=0.0953], respectively) (Table). However, the electrogram amplitude of the SP during AT was significantly lower than that during sinus rhythm (0.088±0.042 versus 0.110±0.049 mV, P<0.001) (Table). The electrogram width of the SP during AT was significantly longer than that during sinus rhythm (47.8±14.1 versus 38.8±13.4 ms, P<0.0001) (Table).
Figure 2 shows the tracing during manifest entrainment in a patient with AVN‐AT. The EAAS was observed at the lateral side of the HB site. The atrial electrogram of the EAAS was observed 5 ms earlier than that at the HB site. During pacing from the high anterolateral RA, the EAAS, CS, and HB recording sites were orthodromically captured via the long conduction interval (solid arrows). On the other hand, the atrial electrograms at the high RA 9‐10 were captured antidromically during pacing (dashed arrows). The atrial electrograms at the high RA 9‐10 occurred 40 ms earlier than those at the CS 9‐10 during pacing, but they were observed 10 ms later during AT. Furthermore, the electrogram morphologies at high RA 9‐10 during pacing were different from those during AT, indicating the antidromic capture of the high RA 9‐10. In addition, fusion of the surface P wave was observed in lead V1 during pacing (open arrows).
Figure 2.
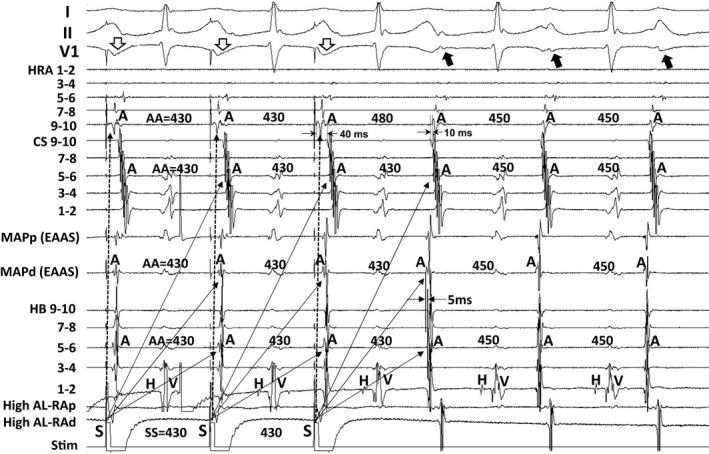
Tracing during manifest entrainment by pacing from the high anterolateral right atrium in a patient with atrial tachycardia arising from the vicinity of the atrioventricular node. The electrocardiographic leads I, II, and V1, and electrograms recorded at the high right atrium (HRA), coronary sinus (CS), earliest atrial activation site (EAAS), and His bundle (HB) position are shown. AA indicates atrial electrogram interval; AL‐RAp, proximal site of anterolateral right atrium; AL‐RAd, distal site of anterolateral right atrium; MAPd, distal site of mapping catheter; MAPp, proximal site of mapping catheter; Stim, stimulation.
Figure 3A shows the locations of the EAAS, ablation sites, and the entrainment pacing site in the same patient as in Figure 2. The EAAS was observed at the lateral side of the HB site. AT was not terminated by energy application delivered to the site 15 mm proximal to the EAAS in the direction of the entrainment pacing site (unsuccessful ablation site), but it was terminated at the site 11 mm proximal to the EAAS (successful ablation site) (Figure 3A). The distance between the HB site and the successful ablation site (15 mm) was longer than that between the HB site and the EAAS (5 mm) (Figure 3A). Figure 3B shows the tracings during sinus rhythm. The SP was not observed at the unsuccessful ablation site (Figure 3B, left tracing), but it was observed at the successful ablation site followed by the atrial electrogram (Figure 3B, right tracing).
Figure 3.
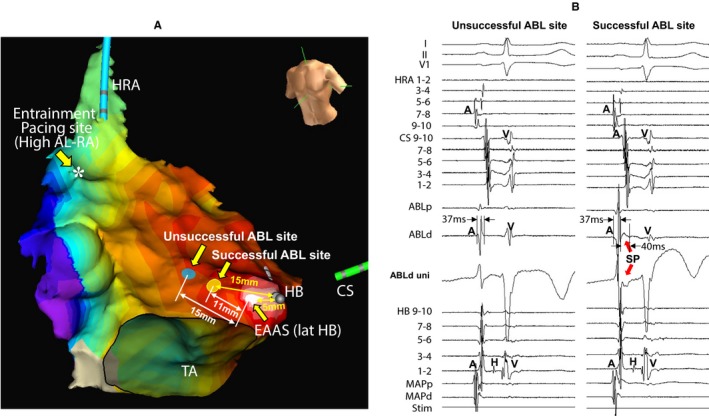
Isochronal map during atrial tachycardia showing the locations of the earliest atrial activation site (EAAS), ablation (ABL) sites, and the entrainment pacing site (A) and tracing during sinus rhythm (B) in the same patient as in Figure 2. Slow potential (SP) was recorded at the successful ABL site (B, right tracing) but not at the unsuccessful site (B, left tracing). The electrocardiographic leads I, II, and V1, and electrograms recorded at the high right atrium (HRA), coronary sinus (CS), ablation catheter (ABL), and His bundle (HB) position are shown. Asterisk: entrainment pacing site at the high anterolateral right atrium (AL‐RA). MAPd indicates distal site of mapping catheter; MAPp, proximal site of mapping catheter; Stim, stimulation; TA, tricuspid annulus; uni, unipolar electrogram.
Figure 4 shows the tracing during radiofrequency energy application delivered at a site 11 mm proximal to the EAAS in the same patient as in Figure 2. The SP was observed at the successful ablation site during AT (Figure 4A). The atrial electrogram of the successful ablation site appeared 15 ms later than that of the HB site during AT (Figure 4A); however, the AT was terminated immediately after the onset of radiofrequency energy delivery (3.1 seconds) (Figure 4B), suggesting that the energy application site is located at the entrance of the SCZ.
Figure 4.
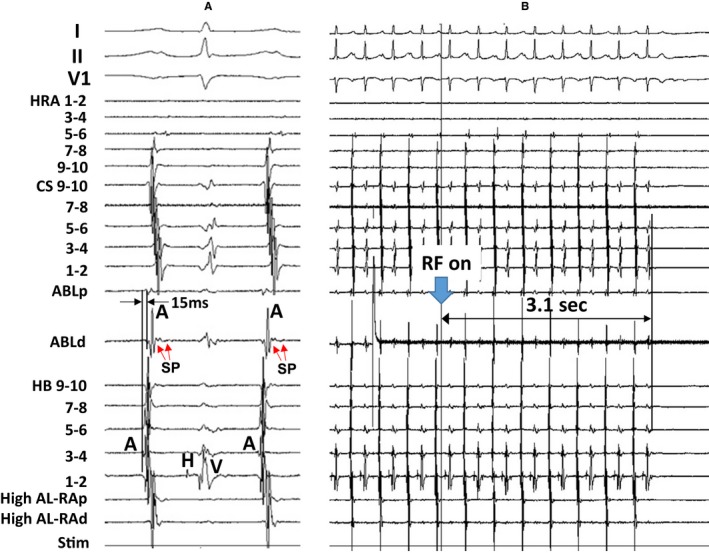
Tracing during atrial tachycardia (A) and during radiofrequency energy (RF) application (B) in the same patient as in Figure 2. The electrocardiographic leads I, II, and V1, and electrograms recorded at the high right atrium (HRA), coronary sinus (CS), ablation catheter (ABL), and His bundle (HB) position are shown. ABLd indicates distal site of ablation catheter; ABLp, proximal site of ablation catheter; AL‐RAd, distal site of anterolateral right atrium; AL‐RAp, proximal site of anterolateral right atrium; SP, slow potential; Stim, stimulation.
Figure 5 shows the electrogram at the successful ablation site (ie, entrance site of the SCZ) during sinus rhythm (Figure 5A) and during AT (Figure 5B) in the same patient as in Figure 2. The SP was observed both during sinus rhythm (Figure 5A) and during AT (Figure 5B), but the electrogram amplitude of the SP was attenuated and the electrogram width of the SP was prolonged during AT (Figure 5B) compared with the SP observed during sinus rhythm (Figure 5A).
Figure 5.
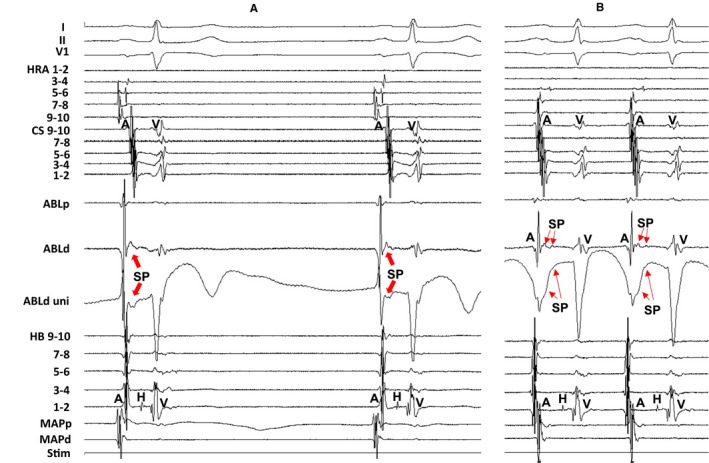
Tracing during sinus rhythm (A) and during atrial tachycardia (B) at the successful ablation site in the same patient as in Figure 2. The amplitude of the slow potential (SP) was attenuated and the electrogram width of the SP was prolonged during atrial tachycardia (B) compared with the SP during sinus rhythm (A). The electrocardiographic leads I, II, and V1, and electrograms recorded at the high right atrium (HRA), coronary sinus (CS), ablation catheter (ABL), and His bundle (HB) position are shown. ABLd indicates distal site of ablation catheter; ABLp, proximal site of ablation catheter; MAPd, distal site of mapping catheter; MAPp, proximal site of mapping catheter; Stim, stimulation; uni, unipolar electrogram.
Figure 6 shows the tracing during manifest entrainment in a patient with AVA‐AT. The EAAS was observed at the 8‐o'clock position of the tricuspid annulus. During pacing from the high anterolateral RA, the EAAS and CS recording sites were orthodromically captured via the long conduction interval (solid arrows). On the other hand, the atrial electrograms at the high RA 3‐4 were captured antidromically during pacing (dashed arrows). The atrial electrograms at the high RA 3‐4 occurred 50 ms earlier than those at the CS 9‐10 during pacing, but they were observed 40 ms later during AT. Furthermore, the electrogram morphologies at high RA 3‐4 during pacing were different from those during AT, indicating the antidromic capture of the high RA 3‐4. In addition, fusion of the surface P wave was observed in lead V1 during pacing (open arrows).
Figure 6.
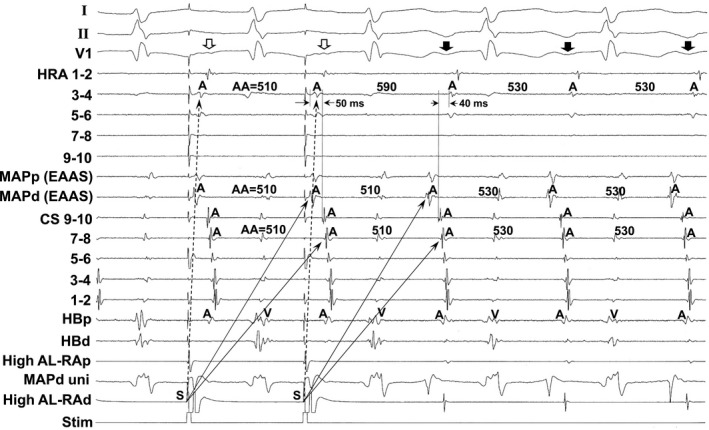
Tracing during manifest entrainment by rapid atrial pacing delivered during tachycardia from the high anterolateral right atrium in a patient with atrial tachycardia arising from the atrioventricular annulus other than the atrioventricular node vicinity. The electrocardiographic leads I, II, and V1, and electrograms recorded at the high right atrium (HRA), the earliest atrial activation site (EAAS), coronary sinus (CS), and His bundle (HB) position are shown. AA indicates atrial electrogram interval; AL‐RAd, distal site of anterolateral right atrium; AL‐RAp, proximal site of anterolateral right atrium; HBd, distal site of His bundle; HBp, proximal site of His bundle; MAPd, distal site of mapping catheter; MAPp, proximal site of mapping catheter; Stim, stimulation; uni, unipolar electrogram.
Figure 7A shows the locations of the EAAS, ablation sites, and the entrainment pacing site in the same patient as in Figure 6. The EAAS was observed at the 8‐o'clock position of the tricuspid annulus. AT was not terminated by the energy application delivered to the site 16 mm proximal to the EAAS in the direction of the entrainment pacing site (unsuccessful ablation site), but it was terminated at the site 12 mm proximal to the EAAS (successful ablation site; entrance of SCZ). Figure 7B shows the tracings during sinus rhythm. The SP was not observed at the unsuccessful site (Figure 7B, left tracing), but it was observed at the successful ablation site followed by the atrial electrogram (Figure 7B, right tracing).
Figure 7.
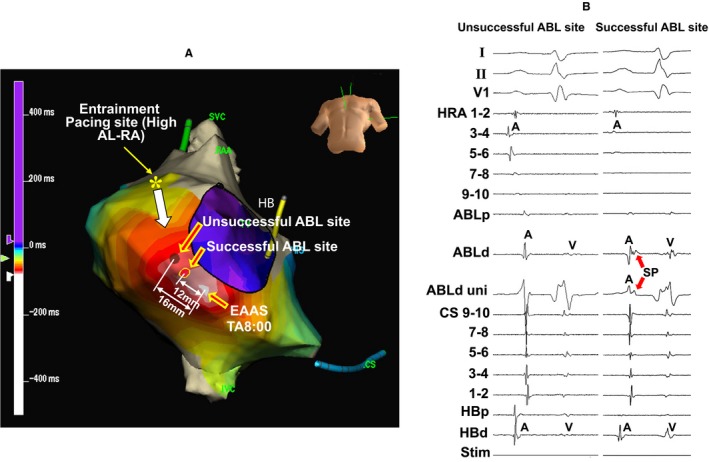
Isochronal map during atrial tachycardia showing the locations of the earliest atrial activation site (EAAS), ablation (ABL) sites, and the entrainment pacing site (A) and tracing at the successful and unsuccessful ABL sites during sinus rhythm (B) in the same patient as in Figure 6. The electrocardiographic leads I, II, and V1, and electrograms recorded at the high right atrium (HRA), ABL site, coronary sinus (CS), and His bundle (HB) position are shown. Asterisk: entrainment pacing site at the high anterolateral right atrium (AL‐RA). ABLd indicates distal site of ablation catheter; ABLp, proximal site of ablation catheter; HBd, distal site of His bundle; HBp, proximal site of His bundle; RAA, right atrial appendage; SP, slow potential; Stim, stimulation, SVC, superior vena cava; TA, tricuspid annulus; uni, unipolar electrogram.
Figure 8 shows the tracing during sinus rhythm (Figure 8A) and during AT (Figure 8B) at the successful ablation site in the same patient as in Figure 6. The SP was clearly observed at the successful ablation site during sinus rhythm (Figure 8A), but the electrogram amplitude of the SP was attenuated and the electrogram width of the SP was prolonged during AT (Figure 8B).
Figure 8.
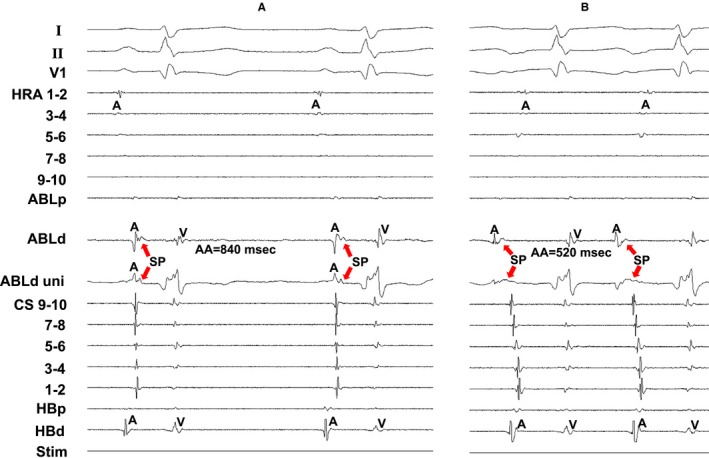
Tracing during sinus rhythm (A) and during atrial tachycardia (B) at the successful ablation site in the same patient as in Figure 6. The electrocardiographic leads I, II, and V1, and electrograms recorded at the high right atrium (HRA), ablation catheter (ABL), coronary sinus (CS), and His bundle position are shown. AA indicates atrial electrogram interval; ABLd, distal site of ablation catheter; ABLp, proximal site of ablation catheter; HBd, distal site of His bundle; HBp, proximal site of His bundle; SP, slow potential; Stim, stimulation; uni, unipolar electrogram.
Discussion
Mechanism and Tachycardia Circuit of AT Arising From the Atrioventricular Annulus
In the present study, manifest entrainment was demonstrated in all patients both in the AVN‐AT and AVA‐AT, suggesting that the underlying mechanism is reentry. Furthermore, the EAAS was orthodromically captured during manifest entrainment. Orthodromic capture of the EAAS during manifest entrainment implies that there is an area of slow conduction within the reentry circuit between the entrance and exit sites.11, 12 Satoh et al15 clearly demonstrated that orthodromic capture of the EAAS implies the presence of an entrance and an exit to the atrium located at distinct different locations. Indeed, AT was successfully terminated by the energy delivery to the site proximal to the EAAS in the direction of the pacing site from where the manifest entrainment was demonstrated both in the patients with AVN‐AT and those with AVA‐AT. This suggests the presence of an entrance of the reentry circuit distinct from the exit of the circuit (ie, EAAS) of AT. Interestingly, there were no significant differences in the tachycardia cycle lengths, distances between the EAAS and the successful ablation sites or the activation times between EAAS and the successful ablation sites between the patients with AVN‐AT and AVA‐AT. This indicates that verapamil‐sensitive AT, which is organized as reentry, is distributed not only at the vicinity of the atrioventricular node but also along the atrioventricular annulus with similar anatomical and electrophysiological features.
Previously, catheter ablation was performed targeting the EAAS, because this form of AT was regarded as focal origin. However, catheter ablation targeting the EAAS has a potential risk of atrioventricular block in the AVN‐AT. Whereas we showed that the entrance of SCZ was located more distantly from the HB site than the EAAS, suggesting that entrance site ablation is a safe therapeutic option than targeting the EAAS in the AVN‐AT.
Substrate of SCZ of the AT Reentry Circuit
Since this form of AT was sensitive to adenosine and verapamil, a calcium channel–dependent tissue has been suggested to be involved in the reentry circuit.4, 5, 6, 7, 8, 9 Indeed, cells with atrioventricular nodal or transitional‐type action potentials have been shown to be present in the atrioventricular valve.16, 17, 18 Anderson et al19 also have demonstrated atrioventricular node–like structures in normal adult hearts and suggested that they were remnants of specialized atrioventricular ring tissue. These remnants were identified along the tricuspid annulus. McGuire et al20, 21 noted that a sleeve of atrioventricular nodal–type tissue, which responds to adenosine, was present around the tricuspid annulus. Recently, Yanni et al22 reported that atrioventricular specialized tissues take their origin from inferior extensions of the atrioventricular node, passing rightward and leftward to encircle the orifices the tricuspid and mitral valves and reuniting to form an extensive retroaortic node. Bohora et al23 also showed that possible involvement of a retroaortic node in the AT circuit arising from the atrioventricular node vicinity and ablated from the noncoronary aortic sinus. They indicated that a retroaortic node is in potential continuity with the transitional cells of a regular atrioventricular node but that it is separate from the compact node itself.23 These histologic findings are consistent with the results of the present study and suggest the preferential location of a calcium channel–dependent SCZ of AT along the tricuspid annulus.
Origin and Significance of the SP
In the present study, the SP was recorded at the successful ablation site (ie, entrance of the SCZ) in all 40 patients. These SPs showed a low amplitude with a slow rate of rise morphology and they were observed along the tricuspid annulus. McGuire et al20, 21 previously reported that high‐frequency deflection followed by a low‐frequency deflection, which is similar to that described by Haissaguerre et al,1 were found during sinus rhythm along the tricuspid annulus. These potentials were caused by asynchronous activation of 2 cell layers, a high‐frequency component was caused by depolarization of atrial‐type cells in the deep subendocardial layer and the low‐frequency component was caused by depolarization of cells with nodal characteristics close to the endocardium.20, 21 They also showed that pacing at increased rates leads to a marked slowing of the action potential upstroke and a decreased size of the action potential in the low‐frequency component. They also showed that these nodal‐type cells observed along the atrioventricular annulus responded to adenosine.21 In the present study, as regards AT arising from the atrioventricular annulus, AT is also sensitive to adenosine. In addition, the SP amplitude was attenuated and the SP width was prolonged during AT. These findings are consistent with the characteristics of a low‐frequency component consisting of nodal‐type cells observed along the tricuspid annulus as reported by McGuire et al.20, 21 All of these above findings serve to corroborate that the SP can be observed at the entrance of the SCZ and that it represents a calcium channel–dependent tissue involved in the SCZ of the reentry circuit in verapamil‐sensitive AT arising from the atrioventricular annulus.
Conclusions
The underlying mechanism of the verapamil‐sensitive AT originating from the atrioventricular annulus is reentry, which is observed not only in the vicinity of the atrioventricular node, but also along the atrioventricular annulus with common anatomical and electrophysiological characteristics. The SP is observed during sinus rhythm at the entrance site of the SCZ of the reentry circuit of verapamil‐sensitive AT arising from the atrioventricular annulus. The amplitude of SP was attenuated and its width was prolonged during AT. These findings suggest that this low amplitude, with a slow rate of rise potential, reflects the characteristics of the calcium channel–dependent tissue involved in the reentry circuit.
Sources of Funding
This study was supported in part by Grants‐in‐Aid for Scientific Research (#16K09444) from the Japan Society for Promotion of Science.
Disclosures
None.
(J Am Heart Assoc. 2018;7:e009223 DOI: 10.1161/JAHA.118.009223.)
References
- 1. Haissaguerre M, Gaito F, Fischer B, Commenges D, Montserrat P, d'Ivernois C, Lemetayer P, Warin JF. Elimination of atrioventricular nodal reentrant tachycardia using discrete slow potentials to guide application of radiofrequency energy. Circulation. 1992;85:2162–2175. [DOI] [PubMed] [Google Scholar]
- 2. de Bakker JM, Coronel R, McGuire MA, Vermeulen JT, Opthof T, Tasseron S, van Hemel NM, Defauw JJ. Slow potentials in the atrioventricular junctional area of patients operated on for atrioventricular node tachycardias and in isolated porcine hearts. J Am Coll Cardiol. 1994;23:709–715. [DOI] [PubMed] [Google Scholar]
- 3. Yamabe H, Okumura K, Tsuchiya T, Tabuchi T, Iwasa A, Yasue H. Slow potential‐guided radiofrequency catheter ablation in atrioventricular nodal reentrant tachycardia: characteristics of the potential associated with successful ablation. Pacing Clin Electrophysiol. 1998;21:2631–2640. [DOI] [PubMed] [Google Scholar]
- 4. Iesaka Y, Takahashi A, Goya M, Soejima Y, Okamoto Y, Fujiwara H, Aonuma K, Nogami A, Hiroe M, Marumo F, Hiraoka M. Adenosine‐sensitive atrial reentrant tachycardia originating from the atrioventricular nodal transitional area. J Cardiovasc Electrophysiol. 1997;8:854–864. [DOI] [PubMed] [Google Scholar]
- 5. Yamabe H, Tanaka Y, Okumura K, Morikami Y, Kimura Y, Hokamura Y, Ogawa H. Electrophysiologic characteristics of verapamil‐sensitive atrial tachycardia originating from the atrioventricular annulus. Am J Cardiol. 2005;95:1425–1430. [DOI] [PubMed] [Google Scholar]
- 6. Yamabe H, Okumura K, Morihisa K, Koyama J, Kanazawa H, Hoshiyama T, Ogawa H. Demonstration of anatomical reentrant tachycardia circuit in verapamil‐sensitive atrial tachycardia originating from the vicinity of the atrioventricular node. Heart Rhythm. 2012;9:1475–1483. [DOI] [PubMed] [Google Scholar]
- 7. Yamabe H, Okumura K, Koyama J, Kanazawa H, Hoshiyama T, Ogawa H. Demonstration of anatomic reentrant circuit in verapamil‐sensitive atrial tachycardia originating from the atrioventricular annulus other than the vicinity of the atrioventricular node. Am J Cardiol. 2014;113:1822–1828. [DOI] [PubMed] [Google Scholar]
- 8. Yamabe H, Tanaka Y, Morihisa K, Uemura T, Enomoto K, Kawano H, Ogawa H. Analysis of the anatomical tachycardia circuit in verapamil‐sensitive atrial tachycardia originating from the vicinity of the atrioventricular node. Circ Arrhythm Electrophysiol. 2010;3:54–62. [DOI] [PubMed] [Google Scholar]
- 9. Koyama J, Yamabe H, Tanaka Y, Morihisa K, Uemura T, Kawano H, Ogawa H, Odagawa Y, Honda T, Honda T. Spatial and topologic distribution of verapamil‐sensitive atrial tachycardia originating from the vicinity of the atrioventricular node. Pacing Clin Electrophysiol. 2007;30:1511–1521. [DOI] [PubMed] [Google Scholar]
- 10. Yamabe H, Morihisa K, Tanaka Y, Uemura T, Enomoto K, Kawano H, Ogawa H. Mechanisms of the maintenance of atrial fibrillation: role of the complex fractionated atrial electrogram region assessed by noncontact mapping. Heart Rhythm. 2009;6:1120–1128. [DOI] [PubMed] [Google Scholar]
- 11. Okumura K, Henthorn RW, Epstein AE, Plumb VJ, Waldo AL. Further observations on transient entrainment: importance of pacing site and properties of the components of the reentry circuit. Circulation. 1985;72:1293–1307. [DOI] [PubMed] [Google Scholar]
- 12. Mann DE, Lawrie GM, Luck JC, Griffin JC, Magro SA, Wyndhan CR. Importance of pacing site in entrainment of ventricular tachycardia. J Am Coll Cardiol. 1985;5:781–787. [DOI] [PubMed] [Google Scholar]
- 13. Waldo AL, Plumb VJ, Arciniegas JG, MacLean WA, Cooper TB, Priest MF, James TN. Transient entrainment and interruption of the atrioventricular bypass pathway type of paroxysmal atrial tachycardia. A model for understanding and identifying reentrant arrhythmias. Circulation. 1983;67:73–83. [DOI] [PubMed] [Google Scholar]
- 14. Heidbüchel H. How to ablate typical ‘slow/fast’ AV nodal reentry tachycardia. Europace. 2000;2:15–19. [DOI] [PubMed] [Google Scholar]
- 15. Satoh M, Miyajima S, Koyama S, Ishiguro J, Okabe M. Orthodromic capture of the atrial electrogram during transient entrainment of atrioventricular nodal reentrant tachycardia. Circulation. 1993;88:2329–2336. [DOI] [PubMed] [Google Scholar]
- 16. Paes de Carvallo A, de Almeida F. Spread of activity through the atrioventricular node. Circ Res. 1960;8:801–809. [DOI] [PubMed] [Google Scholar]
- 17. Wit AL, Fenoglio JJ Jr, Wagner BM, Bassett AL. Electrophysiological properties of cardiac muscle in the anterior mitral valve leaflet and the adjacent atrium in the dog. Possible implications for the genesis of atrial dysrhythmias. Circ Res. 1973;32:731–745. [DOI] [PubMed] [Google Scholar]
- 18. Wit AL, Fenoglio JJ Jr, Hordof AJ, Reemtsma K. Ultrastructure and transmembrane potentials of cardiac muscle in the human anterior mitral valve leaflet. Circulation. 1979;59:1284–1292. [DOI] [PubMed] [Google Scholar]
- 19. Anderson RH, Davies MJ, Becker AE. Atrioventricular ring specialized tissue in the normal heart. Eur J Cardiol. 1974;2:219–230. [Google Scholar]
- 20. McGuire MA, de Bakker JM, Vermeulen JT, Opthof T, Becker AE, Janse MJ. Origin and significance of double potentials near the atrioventricular node. Correlation of extracellular potentials, intracellular potentials, and histology. Circulation. 1994;89:2351–2360. [DOI] [PubMed] [Google Scholar]
- 21. McGuire MA, de Bakker JM, Vermeulen JT, Moorman AF, Loh P, Thibault B, Vermeulen JL, Becker AE, Janse MJ. Atrioventricular junctional tissue. Discrepancy between histological and electrophysiological characteristics. Circulation. 1996;94:571–577. [DOI] [PubMed] [Google Scholar]
- 22. Yanni J, Boyett MR, Anderson RH, Dobrzynski H. The extent of the specialized atrioventricular ring tissues. Heart Rhythm. 2009;6:672–680. [DOI] [PubMed] [Google Scholar]
- 23. Bohora S, Lokhandwala Y, Sternick EB, Anderson RH, Wellens HJ. Reappraisal and new observations on atrial tachycardia ablated from the non‐coronary aortic sinus of Valsalva. Europace. 2018;20:124–133. [DOI] [PubMed] [Google Scholar]


