

Abstract
Background
Brain microvascular endothelial cells form a highly selective blood brain barrier regulated by the endothelial tight junctions. Cerebral ischemia selectively targets tight junction protein complexes, which leads to significant damage to cerebral microvasculature. Short noncoding molecules called microRNAs are implicated in the regulation of various pathological states, including endothelial barrier dysfunction. In the present study, we investigated the influence of microRNA‐155 (miR‐155) on the barrier characteristics of human primary brain microvascular endothelial cells (HBMECs).
Methods and Results
Oxygen‐glucose deprivation was used as an in vitro model of ischemic stroke. HBMECs were subjected to 3 hours of oxygen‐glucose deprivation, followed by transfections with miR‐155 inhibitor, mimic, or appropriate control oligonucleotides. Intact normoxia control HBMECs and 4 oxygen‐glucose deprivation–treated groups of cells transfected with appropriate nucleotide were subjected to endothelial monolayer electrical resistance and permeability assays, cell viability assay, assessment of NO and human cytokine/chemokine release, immunofluorescence microscopy, Western blot, and polymerase chain reaction analyses. Assessment of endothelial resistance and permeability demonstrated that miR‐155 inhibition improved HBMECs monolayer integrity. In addition, miR‐155 inhibition significantly increased the levels of major tight junction proteins claudin‐1 and zonula occludens protein‐1, while its overexpression reduced these levels. Immunoprecipitation and colocalization analyses detected that miR‐155 inhibition supported the association between zonula occludens protein‐1 and claudin‐1 and their stabilization at the HBMEC membrane. Luciferase reporter assay verified that claudin‐1 is directly targeted by miR‐155.
Conclusions
Based on these results, we conclude that miR‐155 inhibition–induced strengthening of endothelial tight junctions after oxygen‐glucose deprivation is mediated via its direct target protein claudin‐1.
Keywords: brain microvascular endothelial cells, endothelial barrier, microRNA, oxygen‐glucose deprivation, tight junctions
Subject Categories: Ischemia, Endothelium/Vascular Type/Nitric Oxide, Vascular Biology, Ischemic Stroke, Cell Biology/Structural Biology
Clinical Perspective
What Is New?
MicroRNA‐155 (miR‐155) inhibition improves the monolayer integrity of human primary brain microvascular endothelial cells following oxygen‐glucose deprivation.
miR‐155 silencing after oxygen‐glucose deprivation results in increased levels of major tight junction proteins claudin‐1 and zonula occludens protein‐1.
miR‐155 inhibition supports the interaction between zonula occludens protein‐1 and claudin‐1 and leads to their stabilization at the endothelial cell membrane.
miR‐155 inhibition–induced improvement of the endothelial barrier function is mediated via its direct target protein claudin‐1.
What Are the Clinical Implications?
Based on our results, we propose that blood brain barrier integrity after stroke can be improved by the modulation of miR‐155 activity.
The obtained in vitro data support our in vivo studies and demonstrate the applicability of our prior findings to human stroke.
Our research promotes a novel approach to cerebral regeneration: regulation of postischemic recovery via directed targeting of a specific miRNA.
Introduction
The blood brain barrier (BBB) formed by the endothelial cells of cerebral capillaries provides a highly selective vascular permeability and maintains brain homeostasis. Passive diffusion through the BBB is regulated by brain endothelial tight junctions (TJs), which are composed of transmembrane and cytosolic TJ‐associated protein complexes.1, 2 Among major TJ proteins, which play a critical role in the formation and integrity of vascular barrier are occludin, claudins (claudin‐5 [CLDN5] and claudin‐1 [CLDN1], among other family members), and a major scaffolding protein ZO‐1 (member of the zonula occludens protein family).3, 4 Expression, cellular distribution, and interaction of these proteins with each other are critical for paracellular permeability and TJ‐mediated signaling.5 BBB integrity is disrupted during various neuropathological conditions, including cerebral ischemia/stroke. Stroke results in the breakdown of the BBB, with subsequent damage to cerebral vasculature and nonvascular brain elements, including neurons, astrocytes, and microglia. Hypoxia‐induced vascular damage is associated with disruption of paracellular cell junctions, with selective targeting of brain microvascular endothelial TJ complexes.6, 7, 8
MicroRNAs (miRNAs) are recently identified short mRNA‐interfering molecules, implicated in the regulation of gene expression and, thus, modulation of major cellular functions.9, 10, 11 Recent studies show that TJ integrity is regulated and fine‐tuned by various mirRNAs, which directly influence expression of TJ and adaptor proteins, and other regulatory molecules.12
Multifunctional miR‐155 is regarded as a mediator of various physiological and pathological processes, including immunity, inflammation, cancer, and cardiovascular diseases.13, 14 miR‐155 expression is limited to hematopoietic cells and cells involved in vascular remodeling, including endothelial cells.15, 16 Our previous studies demonstrated that miR‐155 negatively regulates proangiogenic signaling pathways in mouse brain endothelial cells: inhibition of miR‐155 significantly enhanced while overexpression significantly inhibited the in vitro endothelial morphogenesis.17 In addition to these findings, we also demonstrated that in vivo inhibition of miR‐155 following experimental cerebral ischemia results in preservation of microvascular integrity in the peri‐infarct area of the mouse brain. Improved TJ integrity in the inhibitor‐injected animals was accompanied by increased levels of the TJ protein ZO‐1 in brain tissue extracts.18 In addition, we proposed that miR‐155 inhibition–induced stabilization of TJs could be associated with altered poststroke inflammatory response.19 Our in vivo studies involving systemic anti–miR‐155 injections did not precisely determine whether miR‐155 inhibition directly influenced the vascular endothelium.
Based on the existing literature and our previous findings, we hypothesized that miR‐155 inhibition could support the barrier functions of the cultured endothelial cells. The present study aimed to establish whether the miR‐155 silencing could strengthen the endothelial TJs after the experimental ischemia. In addition, it was our intention to determine the relevance of our prior animal studies to human stroke. To accomplish these goals, we investigated the effects of changes in miR‐155 expression on the endothelial monolayer integrity and expression of TJ proteins in human primary endothelial cells subjected to experimental hypoxia/ischemia.
Materials and Methods
The data, analytic methods, and study materials will be made available to other researchers upon request for purposes of reproducing the results or replicating the procedure.
Cell Culture
The experiments were performed using human primary brain microvascular endothelial cells (HBMECs) from Cell Biologics (Cat# H‐6023). According to the company's documentation, immunofluorescence staining and fluorescence‐activated cell sorter confirmed that these cells isolated from the human brain tissue express endothelial cell markers CD31/platelet endothelial cell adhesion molecule 1 and vascular endothelial (VE)–cadherin. Cells were expanded in complete cell growth medium provided by Cell Biologics (Cat# H1168). The cells were received at passage 3, and passage 4 was used for the experiments. HBMECs were seeded in precoated 24‐well and 6‐well cell culture inserts (2×10⁵ and 8×10⁵ cells per insert, respectively). Cells grown in 24‐well inserts were used for the multiwell assays, while 6‐well inserts were more convenient for harvesting the cells for Western blot and RNA isolation analyses. Transparent PET membrane 3‐μm pore size Falcon cell culture inserts and cell culture dishes were purchased from VWR.
Oxygen‐Glucose Deprivation
At 48 hours after seeding, HBMECs were subjected to 3 hours of oxygen‐glucose deprivation (OGD) as previously described.20 Complete growth medium was replaced by glucose‐ and phenol red–free Endothelial Cell Basal Medium (Cell Biologics, Cat# GPF1168b), preequilibrated with 95% N2, and 5% CO2. Cells were then incubated in a humidified airtight chamber (Billups‐Rothberg Inc) equipped with an air lock and flushed with 5% CO2/95% N2 for 15 minutes. The chamber was sealed and kept at 37°C for 3 hours. The oxygen concentration was below 0.2% as monitored by an oxygen analyzer (Sable Systems). Upon OGD termination, the cells were removed from the hypoxic chamber, the medium was replaced with complete growth medium, and the cells were placed back into the incubator. Control cultures were kept in complete growth medium at 37°C in 5% CO2/95% air.
HBMEC Transfection
At 24 hours after OGD, human miRNA miR‐155 (hsa‐miR‐155) was inhibited or overexpressed in HBMECs, using specialized miRCURY LNA oligonucleotides from Exiqon. Transfection was performed according to the manufacturer's manuals, using X‐tremeGENE siRNA Transfection Reagent (Sigma, Cat# XTG9‐RO). Specific hsa‐miR‐155‐5p antisense inhibitor (Cat# 4101510‐002) and miRNA inhibitor control (scrambled oligonucleotide, Cat# 199006‐002) were used in concentration of 25 pmol per 24‐well cell culture insert and 150 pmol per 6‐well insert. The amount of transfection reagent used was 1.5 μL per insert per well. The effect of miR‐155 overexpression was studied using hsa‐miR‐155‐5p mimic (Cat# 472490‐001) and miRNA mimic negative control (Cat# 479903‐001) nucleotides. Following the manufacturer's instructions, miR‐155 mimic was used in concentrations of 2.5 pmol per 24‐well cell culture insert and 15 pmol per 6‐well insert. The amount of X‐tremeGENE siRNA transfection reagent used was 3 times less than concentration used for miR‐155 inhibition. Oligonucleotide and transfection reagent mixture was prepared in Opti‐MEM reduced serum medium, mixed with the appropriate amount of complete growth medium, and added to cells for 24 hours. After this, the transfection medium was replaced with complete growth medium only, and the cells were left to grow for another 24 hours. At 48 hours after cell transfection, the cells were used for analyses and assays described below.
Monolayer Resistance
Endothelial monolayer resistance was assessed to evaluate the effect of miR‐155 inhibition and overexpression on endothelial integrity. HBMECs, grown on cell culture inserts, were used for analysis. The measurements were performed at 48 hours after cell transfection (at day 5 after cell seeding, and accordingly, day 4 after OGD). Transendothelial electrical resistance was measured using the Millicell ERS‐2 electrical resistance system (Millipore), according to the manufacturer's recommendations. The blank resistance was determined by measurements across the blank (no cells) insert. For final calculations, measured resistances were corrected by subtracting blank resistance and multiplying by the area of the insert membrane (0.3 cm2). The measurements obtained from 4 independent experiments, each with 24 wells (96 measurements), were used for statistical analysis.
Endothelial Permeability Assay
The same HBMECs, grown on cell culture inserts and used for electrical resistance assessment, were subsequently used to assess endothelial permeability. The assay was performed as previously described in detail,21 with slight modifications specific for brain endothelium. Fluorescein‐labeled 3 kDa Dextran (Thermo Fisher, Cat# D3306) was added to the upper chamber of the cell culture insert, at a final concentration of 30 μg/mL. Three hours later, 100‐μL aliquots were collected from the lower chamber of the insert and transferred to a 96‐well plate. Fluorescence intensity was measured on the Fluoroscan Ascent microplate fluorometer (Thermo Fisher), with excitation at 485 nm and emission at 535 nm. The amount of fluorescent dextran diffusing through the endothelial monolayer from the upper chamber to the lower chamber is indicative of increased permeability. The measurements from 4 independent experiments, each with 24 wells (96 measurements), were collected for statistical analysis.
Methylthiazolyldiphenyl‐Tetrazolium Bromide (MTT) Colorimetric Cell Viability Assay
Cell viability assay was performed as previously described.17 Briefly, the cells were incubated with 0.5 mg/mL of methylthiazolyldiphenyl‐tetrazolium bromide (Sigma, Cat# M5655) for 4 hours at 37°C, and treated with 1:1 ethanol:dimethyl sulfoxide for 20 minutes at room temperature. The ability of cells to convert methylthiazolyldiphenyl‐tetrazolium bromide into purple formazan provides an indication of the mitochondrial integrity and activity, interpreted as a degree of cell viability. The optical density was measured at 570 nm (with background subtraction at 630 nm) using the Multiskan Ascent microplate reader (Thermo Fisher). Abs570 nm is directly proportional to the number of viable cells.
NO and Cytokine/Chemokine Assays
ECs were subjected to OGD and miR‐155 inhibitor or mimic transfections, as described above. At 48 hours after transfections, cell‐conditioned medium (cells were grown in this medium for 24 hours) was collected and analyzed for NO and human cytokine expression. Plain cell culture growth medium (unconditioned) was used as a negative control.
NO release was assessed using Total Nitric Oxide and Nitrate/Nitrite Parameter Assay Kit (R&D, Cat# KGE001), according to the manufacturer's instructions. Endogenous nitrite was measured via colorimetric detection of optical density in each well using a Multiskan Ascent microplate reader set at 540 nm.
Human cytokine expression was assessed using the Proteome Profiler Array from R&D (Cat# ARY005B). This membrane‐based sandwich immunoassay allows detection of 36 human cytokines, chemokines, and acute‐phase proteins simultaneously in the same sample. The procedure was performed according to the manufacturer's instructions. Profiles of mean spot pixel density for all cytokines were quantified using ImageJ software (National Institutes of Health).
RNA Isolation and Reverse Transcription qPCR
Total RNA was isolated using the mirVana miRNA (Ambion/Thermo Fisher) isolation kit, according to the manufacturer's recommendations. To evaluate miR‐155 expression in the samples, miR‐155 quantitative polymerase chain reaction (qPCR) was performed using miRCURY LNA Universal RT miRNA polymerase chain reaction (PCR) primer sets from Exiqon. The primers included hsa‐miR‐155‐5p LNA (Cat# 204308) and U6 snRNA reference primer set (Cat# 203907). ExiLENT SYBR Green master mix and Universal cDNA Synthesis Kit were from the same company. CLDN1 qPCR was performed using PCR products from GeneCopoeia, including All‐in‐One qPCR primers for human CLDN1 (Cat# HQP022026), and GAPDH as a reference gene. All‐in‐One First‐Strand cDNA Synthesis Kit and All‐in‐One qPCR Mix were from the same company. qPCR reactions were performed on an Applied Biosystems ABI 7300 real‐time PCR system (Thermo Fisher).
Western Blot Analysis
The cells were scraped from 6‐well cell culture inserts with lysis buffer containing 1% (vol/vol) TX‐100, 150 mmol/L NaCl, 10 mmol/L Tris‐HCl pH 7.4, and a protease inhibitor cocktail. Total protein concentration was determined for each sample using a DC protein assay kit from Bio‐Rad. The proteins were separated on 4% to 20% gradient Criterion precast gels (Bio‐Rad). SMAD‐1 and Rictor proteins were detected using SMAD proteins (Cat# 12656) and mTOR pathway (Cat# 9964) antibody sampler kits (Cell Signaling). The expression levels of cell junction proteins were detected using anti–ZO‐1, anti–VE‐cadherin, anti‐occludin, anti–CLDN5 (Thermo Fisher, Cat# PA5‐28869, PA5‐19612, 33‐1500, and 35‐2500, respectively), and anti‐CLDN1 (Cell Signaling, Cat# 4933) antibodies. Anti‐RoA (Cat# 2117) and anti–Ras homolog enriched in brain (Rheb) (Cat# 13879) were from Cell Signaling. Horseradish peroxidase–labeled secondary antibodies were from Cell Signaling and Amersham Biosciences. The density of the protein bands was determined using Image J software, normalized by actin or GAPDH (Millipore, Cat# MAB374) expression, and quantified using Microsoft Excel software. The samples were collected from 3 to 6 independent experiments.
Immunoprecipitation was performed using TrueBlot anti‐rabbit Ig IP agarose beads from Rockland Company (Cat# 00‐8800‐25), according to manufacturer's recommendations. Cell lysates were prepared as described above (≈3×10⁶ cells were used for each immunoprecipitation). ZO‐1 was immunoprecipitated and detected with rabbit polyclonal anti–ZO‐1 antibody from Thermo Fisher. Horseradish peroxidase–conjugated TrueBlot anti‐rabbit IgG (Rockland, Cat# 18‐8816‐31) was used as a secondary antibody. The TrueBlot system was efficient in eliminating an IgG heavy chain signal; however, it had no effect on the IgG light chain, which interfered with detection of CLDN1 (MW ≈23 kDa) in the immunoprecipitates. To overcome this problem, CLDN1 was detected using Human Claudin‐1 Alexa Fluor 700‐conjugated antibody (R&D, Cat# FAB4618N), using an Odyssey Infrared Imaging system for Western blot analysis. 4G10 Platinum anti‐phosphotyrosine and anti‐phosphoserine antibodies (Millipore, Cat# 05‐1050 and AB1603) were used to detect ZO‐1 phosphorylation levels in the immunoprecipitates.
Immunofluorescence Staining
The cells were fixed with 4% paraformaldehyde solution and quenched with 50 mmol/L of ammonium chloride. Following permeabilization with 0.1% (v/v) Triton X‐100 and blocking with 1% horse serum, the samples were incubated with specific primary antibody (4°C overnight, using dilution suggested by the manufacturer). Acetone fixation was used for CLDN1 staining. The following primary antibodies were purchased from Thermo Fisher: Alexa Fluor 647‐conjugated anti–ZO‐1 (Cat# MA3‐39100‐A647), Alexa Fluor 488 conjugated anti‐CLDN1 (Cat# 374988), Alexa‐Fluor 488‐conjugated anti–human CD144/VE‐cadherin (Cat# 53‐1449‐41), anti‐occludin (Cat# 33‐1500), and anti–CLDN5 (Cat# 35‐2500). Acti‐stain 488 (Cat# PHDG1) and rhodamine‐labeled (Cat# PHDR1) fluorescent phalloidin probes were purchased from Cytoskeleton. Antobodies against von Willebrand factor (Cat# AB7356), and fluorescein isothiocyanate–conjugated antihuman CD31 (Cat# CBL468F) were from Millipore. Detection of the unconjugated antibodies was followed by the incubation with fluorescein isothiocyanate– and rhodamine‐labeled secondary antibodies (Jackson ImmunoResearch Laboratories). 4′,6‐Diamidino‐2‐phenylindole staining was used to visualize nuclei. All samples were imaged on a Zeiss LSM800 confocal imaging system.
Colocalization analysis for ZO‐1 and CLDN1 immunofluorescence staining was performed using ImageJ‐based Fiji software. Quantification was performed either using the entire cell area or region of interest selection for cell membranes. Costes auto threshold method was applied to generate correlation scatterplots (between the intensities of the 2 color channels) and automatically define a proper intensity threshold for both channels. Coloc 2 software automatically calculated Pearson correlation and Mander co‐occurance coefficients. Finally, Costes colocalization test was performed to verify the accuracy of the analysis.
Luciferase reporter assay was performed using Luc‐Pair Duo‐Luciferase HS Assay Kit (GeneCopoeia). The assay was performed in HeLa cells, which demonstrate a high efficiency for DNA plasmid transfection. HeLa cells were seeded in 96‐well assay plates at a density of 4×10⁴ cells per well. At 24 hours after seeding, the cells were cotransfected using the following combinations: (1) 50 ng per well miRNA 3′UTR target expression clone for human CLDN1 pEZX‐MT06 vector (Firefly CLDN1, Cat# HmiT088484‐MT06) and 0.5 ng per well Renilla luciferase expression vector; (2) 50 ng per well Firefly CLDN1, 0.5 ng per well Renilla, and 0.5 pmol/L miR‐155 mimic; and (3) 50 ng per well Firefly CLDN1, 0.5 ng per well Renilla, 0.5 pmol/L per well miR‐155 mimic, and 50 pmol/L per well miR‐155 inhibitor. Lipofectamine 2000 was used as a transfection reagent according to the manufacturer's recommendations. Cotransfections with Renilla and miRNA Target clone control vector for pEZX‐MT06 (Cat# CmiT000001‐MT06) alone and in combination with miR‐155 mimic were used as controls. At 48 hours after cotransfections, cells were lysed and luminescent substrates added according to the manufacturer's recommendations. Luminescence was measured on the Infinite 200 microplate reader (Tecan).
CLDN1 Overexpression
Expression/transfection‐ready open reading frame clone was purchased from GeneScript (Clone ID OHu20823). The plasmid sequences represent the protein‐coding region of the CLDN1 cDNA open reading frame, which is encoded by the open reading frame sequence. Open reading frame sequences are delivered in pcDNA3.1+/C‐(K)DYK standard vector. Transfection was performed using Lipofectamine 3000 reagent (Thermo Fisher) according to the manufacturer's recommendations. The assays and analyses were performed at 48 hours after transfection.
Statistical Analysis
For the reverse transcription qPCR, NO release, cytokine assay, Western blot, and luciferase assay analyses, pairwise or multiple‐group comparison was performed using nonparametric Mann–Whitney test or Kruskal test, respectively. The normalized values obtained from the measurements performed in each independent experiment were used for statistical analysis, using software R version 3.4.1 (R Foundation) and GraphPad Prism version 6.05. For quantification of the data obtained from the endothelial monolayer resistance and permeability multiwell assays, we employed linear mixed effects models for analysis of well‐level data. The models control for between‐well correlation among the 24 wells in the same experiment as well as between‐experiment variation. The method assigns a “random effect” to each replicated experiment and is capable of quantifying the intraclass correlation among wells from the same experiment and at the same time compares among experimental groups. The method entails ANOVA and regression models as special cases when clustering among well‐level data are negligible. It encompasses simultaneously pairwise group comparison and overall comparison under a unifying model setting.
Results
HBMECs were isolated and extensively characterized by the Cell Biologics Company. In addition to information provided by the vendor, we performed further characterization of HBMECs, using endothelial cell phenotypic markers. We confirm that the cells are characterized by “cobblestone” morphology and express endothelial markers CD31 and VE‐cadherin (Figure S1A and S1B). The cells also express von Willebrand factor, exhibiting characteristic intracellular rod‐like staining (Figure S1C). Endothelial morphogenesis assay, performed to check for the HBMEC's ability to form capillary‐like tubes in vitro, demonstrated that HBMECs formed capillary‐like structures characteristic of the endothelial cells (Figure S1D). These additional tests confirmed the vascular endothelial cell phenotype of HBMECs used in our experiments.
Figure 1A demonstrates the general experimental setup: HBMECs were seeded in the precoated cell culture inserts. Oxygen‐glucose deprivation was utilized as an in vitro model of cerebral ischemia: at 48 hours after seeding, the cells were subjected to 3 hours of OGD. At 24 hours after the OGD, the cells were transfected with miR‐155 inhibitor, mimic, or appropriate scrambled oligonucleotides. At 48 hours after transfection, the cells were subjected to different assays and analyses. We believe that this setup mimics our in vivo studies, where miR‐155 was inhibited after the experimental stroke, and testing was performed at 48 hours after the last anti–miR‐155 injection.18
Figure 1.
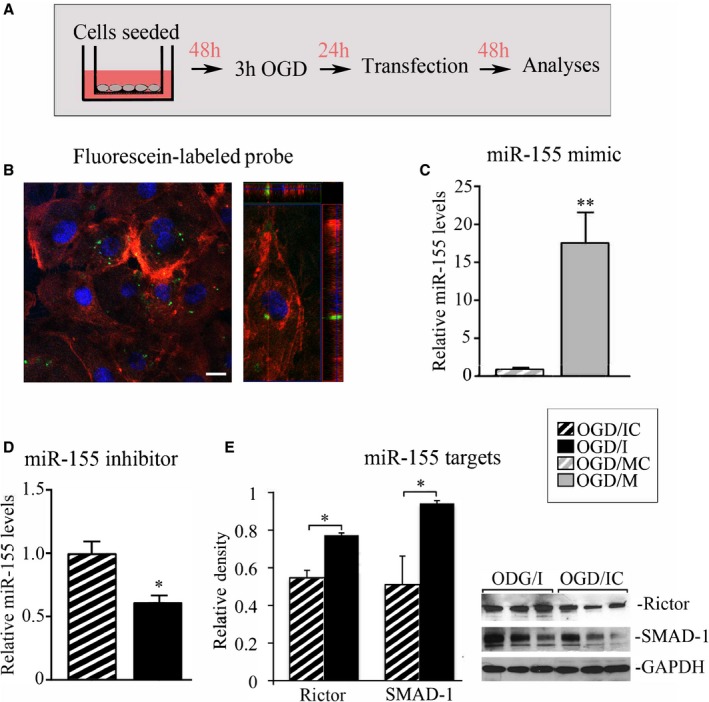
Efficiency of microRNA‐155 (miR‐155) inhibition and overexpression. A, Diagram describing the experimental setup. Human primary brain microvascular endothelial cells (HBMECs) seeded in cell culture inserts were subjected to 3 hours of oxygen‐glucose deprivation (OGD) and returned back to the normal cell culture conditions; 24 hours later, the cells were transfected with miR‐155 inhibitor, mimic, or appropriate scrambled oligonucleotide. Cells were analyzed at 48 hours after the transfection. B, Fluorescence confocal microscopy of HBMECs transfected with fluorescein‐labeled miR‐155 inhibitor control (green dots) and stained for actin with rhodamine‐conjugated fluorescent phalloidin. Left panel: orthogonal image projection verifies that fluorescent probes were incorporated within the cell. Bar: 10 μm. C and D, miR‐155 PCR analysis. Total RNA was isolated from the cells subjected to OGD and transfected with the following oligonucleotides: miR‐155 mimic (OGD/M; grey bar); mimic control (OGD/MC; grey bar with white stripes); specific miR‐155 inhibitor (OGD/I; black bar); and control inhibitor (OGD/IC; black bar with white stripes). C, P=0.002, (D) P=0.029, Mann–Whitney (Wilcoxon) test. n=3 (for OGD/MC and OGD/IC groups) and n=4 (for OGD/I and OGD/M groups) independent experiments. E, Validation of miR‐155 inhibition by the quantitative assessment of miR‐155 direct target proteins Rictor and SMAD‐1. Optical density of the protein bands was measured using ImageJ software, normalized to GAPDH density in every sample, and expressed as average relative density values. Protein levels were compared between OGD/I (black bars) and OGD/IC (black bars with white stripes) cell lysates. P=0.029, Mann–Whitney (Wilcoxon) test, n=3 independent experiments per group. Representative immunoblots demonstrate Rictor and SMAD‐1 protein expression (3 bands per group); GAPDH was used as a loading control. Error bars: SEM; *P<0.05; **P<0.01.
Efficiency of miR‐155 Inhibition and Overexpression
miR‐155 inhibition or overexpression in HBMECs (subjected to prior OGD) was achieved by transfections with specific miR‐155 inhibitor (OGD/I group of cells), mimic (OGD/M), or appropriate control inhibitor or mimic oligonucleotides (OGD/IC and OGD/MC, respectively). Quantification of the OGD‐treated cells at 48 hours after transfection with fluorescein‐conjugated control oligonucleotide (Figure 1B, green dots) detected ≈48% transfection efficiency in HBMECs. The expression level of miR‐155 in non–OGD normoxic controls (NCs) was not different from the OGD/MC and OGD/IC samples. This observation is similar to our in vivo findings and could be related to the fact that the samples were analyzed at the later time point (3 days) after the OGD. PCR analysis showed that miR‐155 mimic induced 16‐fold overexpression of miR‐155, as compared with mimic control (Figure 1C), while transfection with antisense inhibitor resulted in 1.6‐fold inhibition of miR‐155 (Figure 1D). Since miRNA inhibitors do not degrade their targets, miRNA qPCR is not efficient for measuring the level of miRNA knockdown. For more accurate monitoring of the inhibition efficiency, we checked the expression levels of miR‐155 direct target proteins Rictor and SMAD‐1. These proteins were upregulated following the in vivo inhibition of miR‐155 in our previous studies.18 Accordingly, Western blot analysis of OGD/I cell lysates revealed statistically significant upregulation of Rictor (by 40%) and SMAD‐1 (by 84%), as compared with control OGD/IC samples (Figure 1E).
Endothelial Monolayer Integrity is Improved After miR‐155 Inhibition Following OGD
Changes in HBMEC morphology following OGD were observed using fluorescence staining for the adherens junction protein VE‐cadherin (Figure 2A) and actin (Figure 2B). There was a visible disruption of HBMEC monolayer following OGD, as compared with intact HBMECs grown under normoxic conditions (NC panels, Figure 2). There were noticeable changes in the morphology of ODG/IC cells (similar to another OGD/MC control group, not shown), with disorganized actin filaments and disaggregated monolayer. Visibly improved intercellular adhesion was observed in OGD/I cells, as compared with OGD/IC and OGD/M cells (note the immunofluorescence staining in the corresponding images of Figure 2A and 2B).
Figure 2.
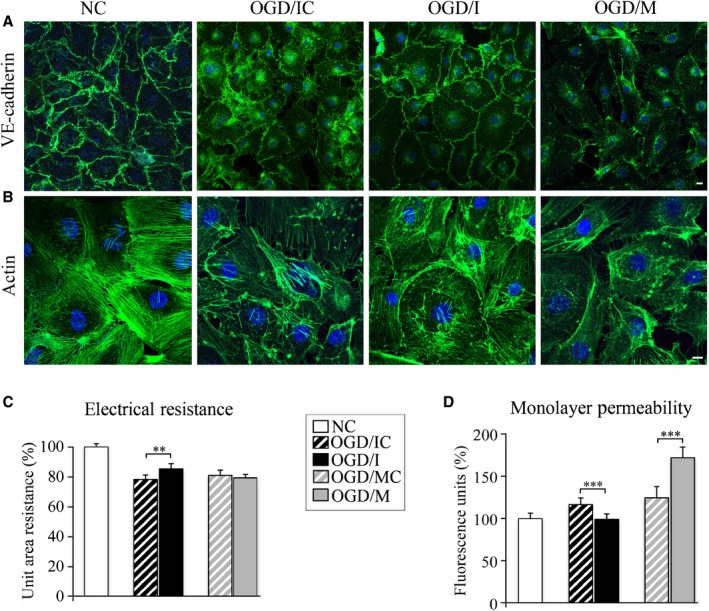
Endothelial monolayer integrity is improved after microRNA‐155 (miR‐155) inhibition in the oxygen‐glucose deprivation (OGD)–subjected cells. Human primary brain microvascular endothelial cell (HBMEC) morphology following OGD was evaluated in the normoxic control (NC), control inhibitor (OGD/IC), specific miR‐155 inhibitor (OGD/I), and mimic (OGD/M) group of cells using fluorescence staining for vascular endothelial (VE)–cadherin (A, green) and actin (B; Acti‐stain 488 phalloidin, green). Imaging was performed with a Zeiss LSM800 confocal microscope, using tile scan and Z stack image acquisitions. Bars: 10 μm. C, Endothelial monolayer resistance was assessed at 48 hours after the cell transfection. Measurements were performed in NC (white bars), OGD/IC (black bar with white stripes), OGD/I (black bar), mimic control (OGD/MC; grey bar with white stripes), and OGD/M (grey bar) cells. Measured resistances were corrected by subtracting blank resistance and multiplying by the area of the insert membrane. Final unit area resistance data are expressed as percentage of the measurements in NC cells (graph). n=4 independent experiments, each with 24‐well measurements (unit of analysis) per group. Tests based on the linear mixed effects models revealed a significant overall across‐group difference (P<0.0001) and significant difference between OGD/IC and OGD/I (P=0.002); the difference between OGD/MC and OGD/M was not significant (P=0.44). D, Following the monolayer resistance measurements, the same cells were subjected to endothelial monolayer permeability assay. The amount of fluorescent dextran diffusing through the monolayer from the upper chamber to the lower chamber was measured with microplate fluorometer. n=4 independent experiments each with 24 well measurements (unit of analysis) per group. Tests based on linear mixed effects models revealed a significant overall difference among the 5 groups (P<0.0001), a significant difference between OGD/IC and OGD/I (P<0.00001), and a significant difference between OGD/MC and OGD/M (P<0.00001). Error bars: SEM; **P<0.01, ***P<0.001.
Electrical monolayer resistance (EMR) was measured to evaluate the effect of miR‐155 inhibition and overexpression on the HBMEC monolayer integrity. Quantification showed that 3 hours of OGD (Figure 2C, striped bars) resulted in an ≈20% (P<0.01) decrease of the endothelial monolayer resistance, as compared with NCs. miR‐155 inhibition resulted in a significant increase of the monolayer resistance in OGD/I cells (black bar), as compared with the appropriate control OGD/IC cells (black striped bar). Resistance of the cell monolayer was slightly decreased after miR‐155 overexpression; however, no statistical significance was detected between OGD/M (grey bar) and the appropriate control OGD/MC (grey striped bar) cells (Figure 2C).
Endothelial permeability assay evaluating the paracellular diffusion of fluorescent dextran was performed as an additional verification of the monolayer resistance measurements. The obtained data confirmed the monolayer resistance measurements: endothelial permeability significantly (by ≈20% as compared with NCs, P<0.05) increased after the OGD (Figure 2D, striped bars); miR‐155 inhibition resulted in a significant (≈16%) decrease, while its overexpression significantly increased (by 38%) the endothelial permeability, as compared with the appropriate OGD/I and OGD/M controls (Figure 2D). A different degree of changes between the electrical resistance and permeability of the OGD/M cells could be explained by a different sensitivity of the 2 methods to the molecular composition of the TJs in these cells (see Discussion).
miR‐155 Inhibition Does Not Affect Viability and NO/Cytokine Release in HBMECs
In order to explore molecular mechanisms underlying the stabilization of HBMECs monolayer in OGD/I cells, we assessed several cellular functions, which could possibly be affected by miR‐155 inhibition after the OGD. Using MTT viability assay, we determined that 3 hours of OGD decreased the average HBMEC viability by ≈12% (Figure 3A, striped bars). No significant differences in cell viability were detected between OGD/I, OGD/IC, OGD/M, and OGD/MC samples. Another possible regulator of the endothelial integrity, endothelial NO synthase, is directly targeted by miR‐155.16, 18 NO is involved in protection of the BBB from hypoxia/reoxygenation‐mediated injury.22 We, therefore, assessed the NO release in all HBMEC experimental groups, but found no significant differences at 48 hours after the oligonucleotide transfections (Figure 3B). As a major inflammatory miRNA, miR‐155 regulates cytokine expression, which could significantly influence the endothelial TJs.19 It is also known, that OGD triggers the endothelial cell activation leading to increased cytokine release. To check whether miR‐155 inhibition has an effect on cytokine production by HBMECs, we assessed the expression of 36 different human cytokines in the HBMEC‐conditioned medium at 48 hours after transfection. We detected that following the OGD, HBMECs release 5 human cytokines/hemokines including macrophage migration inhibitory factor, interleukin 8, chemokine (C‐C motif) ligand 2, and chemokine (C‐X‐C motif) ligand 1. Serpin E1/plasminogen activator inhibitor‐1, a cytokine response modifier serine protease inhibitor that functions as a principal inhibitor of tissue plasminogen activator, was also identified in HBMEC‐conditioned medium, which is in agreement with findings that serpins are released by stimulated endothelial cells.23, 24 Human cytokine/chemokine assay did not reveal any significant differences between OGD/I, OGD/IC, OGD/M, and OGD/MC samples. The NC group had a somewhat higher expression of macrophage migration inhibitory factor, serpin, and interleukin 8; however, these differences were not statistically significant (Figure 3C and 3D). Another miR‐155 target hypoxia‐inducible factor 1α, the mediator of cellular response to hypoxia and regulator of TJ integrity,25, 26 was undetectable in the cell lysates from all analyzed cell groups (neither by ELISA nor Western blot, data not shown).
Figure 3.
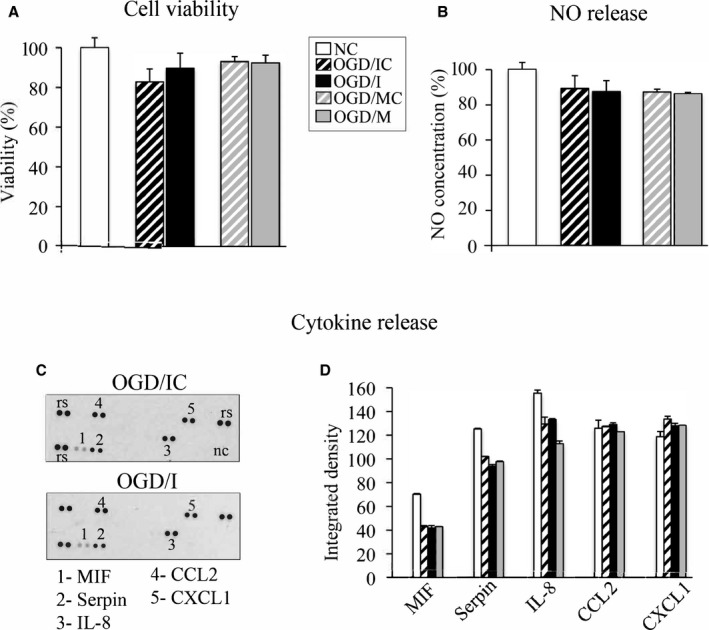
MicroRNA‐155 (miR‐155) inhibition does not affect viability and NO/cytokine release in human primary brain microvascular endothelial cells (HBMECs). A, MTT cell viability assay was performed in normoxic controls (NC; white bar) and oxygen‐glucose deprivation (OGD)–subjected cells transfected with specific miR‐155 inhibitor (OGD/I; black bar), control inhibitor (OGD/IC; black bar with white stripes), mimic (OGD/M; grey bar), and mimic control (OGD/MC; grey bar with white stripes). Cell viability in all groups was expressed as a percentage of measurements in NC cells. B through D, HBMEC‐conditioned medium was collected in all groups of cells (described in A) at 48 hours after cell transfection and analyzed for NO and human cytokine/chemokine expression. B, NO levels in all groups were measured with total NO and nitrate/nitrite ELISA, and expressed as a percentage of the measurements in NC cells. C, Human cytokine expression was assessed using the Proteome Profiler Array. Analysis detected that HBMECs released 5 human cytokines/hemokines including macrophage migration inhibitory factor (MIF), interleukin 8 (IL‐8), chemokine (C‐C motif) ligand 2 (CCL 2), and chemokine (C‐X‐C motif) ligand 1 (CXCL1) as well as Serpin E1/plasminogen activator inhibitor‐1 protein. Representative images demonstrate cytokine expression profiling in OGD/IC and OGD/I samples. D, Profiles of mean spot pixel density for all cytokines were quantified using ImageJ software. Average measurements in NC cells are shown as white bars. Nonparametric 1‐way ANOVA (Kruskal test) was conducted, followed by Mann–Whitney test for pairwise comparison. Results were nonsignificant. n=3 independent experiments per group.
Effect of miR‐155 Inhibition and Overexpression on the Endothelial Cell Junction Proteins
Immunofluorescence microscopy (Figure 4A) and Western blot analyses (Figure 4B and 4C) were utilized to check whether the changes in miR‐155 expression influence the cellular distribution and expression levels of the endothelial junction proteins. Cellular distribution of TJ proteins occludin and CLDN5 was not visibly different within the treatment groups (Figure 4A, occludin and CLDN5 staining, red). Immunofluorescence staining for the TJ core protein ZO‐1 clearly demonstrated well‐defined membrane localization in OGD/I cells and a weak membrane and mostly intracellular distribution in OGD/IC and OGD/M cells (Figure 4A, ZO‐1 panels). Confocal microscopy images on Figure S2 also demonstrated ZO‐1 distribution in the large population of cells from control (NC) and different treatment groups. In contrast to the NC group, the OGD‐subjected cells were characterized by the intracellular distribution of ZO‐1. However, there was a prominent presence of ZO‐1 on the OGD/I cell borders (Figure S2). Representative immunoblots (Figure 4B) and Western blot quantification results (Figure 4C) demonstrated that there were no prominent differences in the expression levels of occludin, CLDN5, and VE‐cadherin proteins within the treatment groups. ZO‐1 levels were significantly higher in the OGD/I group, as compared with OGD/IC and OGD/M cells. These data demonstrate that inhibition of miR‐155 in HBMECs considerably influenced both cellular distribution and expression levels of ZO‐1 protein. ZO‐1 upregulation was also reported after the in vivo inhibition of miR‐155. In these studies, we proposed that ZO‐1 stabilization was mediated by miR‐155 direct target protein Ras homolog enriched in brain (Rheb).18, 27 However, in the present study, Rheb levels were not affected by miR‐155 inhibition or overexpression (which probably means that in vivo experiments detected the combined Rheb levels in the endothelial cells, as well as microglia and astrocytes). Another miR‐155 direct target Rho GTPase Ras homolog gene family, member A (RhoA),28 which could also influence cell adhesion, was not affected by miR‐155 inhibition, but was somewhat (not consistently) decreased in OGD/M cells (Figure 4B and 4C). These data suggest that stabilization of ZO‐1 in the OGD/I group of cells was not mediated via miR‐155 direct targets Rheb and RhoA. Taken together, analyses of the cell junction proteins revealed that miR‐155 inhibition in the OGD‐subjected HBMECs led to ZO‐1 stabilization, which is in agreement with previous studies on neuroinflammation and experimental ischemia.18, 29
Figure 4.
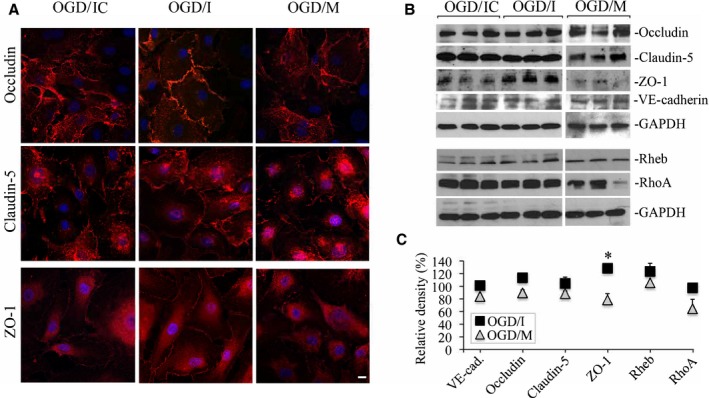
Effect of microRNA‐155 (miR‐155) inhibition and overexpression on the endothelial cell junction proteins. Immunofluorescence microscopy (A) and Western blot analysis (B) were performed to detect the cellular distribution and expression levels of cell junction proteins in oxygen‐glucose deprivation (OGD)/control inhibitor (OGD/IC), specific miR‐155 inhibitor (OGD/I), and mimic (OGD/M) cells. A, Immunofluorescence staining for occludin, claudin‐5, and zonula occludens protein‐1 (ZO‐1; red). Confocal microscopy images were acquired using a Zeiss LSM800 confocal microscope. Bar: 10 μm. B, Representative immunoblots demonstrate the levels of occludin, claudin‐5, ZO‐1, and vascular endothelial (VE)–cadherin. In addition to cell junction proteins, Western blots were performed to assess expression of miR‐155 direct target Rheb and RhoA bands. C, Graph demonstrates quantification of Western blot data obtained in OGD/I (black squares) and OGD/M (grey triangles) samples. Optical density of the protein bands was measured using ImageJ software, normalized to GAPDH density in every sample, and expressed as a percentage of the optical density calculated in the appropriate control OGD/IC and mimic control (OGD/MC) samples, respectively. n=4 (for OGD/IC and OGD/MC groups) and 6 (for OGD/I and OGD/M groups) independent experiments. Mann–Whitney (Wilcoxon) test was used to compare the relative protein levels between OGD/I and OGD/IC groups (P=0.029). Error bars: SEM; *P<0.05.
miR‐155 Inhibition Results in Stabilization of CLDN1
In order to explain the mechanism of ZO‐1 stabilization in the OGD cells following miR‐155 inhibition, we assessed the cellular distribution and protein levels of another miR‐155 target CLDN1. This major TJ protein that plays an important role in TJ integrity has a low expression in cerebrovascular endothelium. In agreement with other studies,30, 31 protein expression of CLDN1 in the intact control (NC) HBMECs was extremely low and almost undetectable either with immunofluorescence staining or Western blot. Similar to NC samples, in the OGD cells transfected with control oligonucleotides (CLDN1 distribution and expression was similar in OGD/IC and OGD/MC control samples), CLDN1 distribution was mostly cytoplasmic and the expression was weak (Figure 5A, OGD/IC panel). In the OGD/I group of cells, there was a visible change in CLDN1 distribution: while still weakly expressed, CLDN1 exhibited the well‐defined membrane localization (Figure 5A, arrows on OGD/I panels). Similar to OGD/IC (and OGD/MC) cells, CLDN1 immunoreactivity in OGD/M cells was low and the cellular distribution was mostly cytoplasmic (Figure 5A, OGD/M panels). These observations were supported by Western blot analysis, which demonstrated an increased expression of CLDN1 in OGD/I samples, as compared with the NC and OGD/IC groups (Figure 5B). miR‐155 overexpression resulted in significantly decreased CLDN1 levels, as compared with the relevant control (Figure 5B, note a visible reduction of CLDN1 expression in OGD/M samples). These results demonstrate that miR‐155 inhibition in HBMECs results in stabilization of its direct target protein CLDN1. Our data are in agreement with earlier reports demonstrating that miR‐155 inhibition leads to stabilization of both ZO‐1 and CLDN1 in the microvascular endothelium.29 CLDN1 reverse transcription qPCR revealed that miR‐155 inhibition or overexpression did not affect mRNA levels of CLDN1, which suggests that miR‐155 regulates CLDN1 protein levels, with no immediate influence on CLDN1 mRNA integrity. In agreement with the previous reports, CLDN1 mRNA levels in all samples, including NC, were extremely low, as compared with CLDN1‐positive control (Figure 5C). A luciferase reporter assay was performed to confirm that human CLDN1 is directly targeted by hsa–miR‐155. As shown in Figure 5D, the miR‐155 mimic significantly reduced luciferase activity of the reporter containing the 3′‐UTR of human CLDN1 (Figure 5D, Firefly CLDN1+M), but not when miR‐155 activity was inhibited by a specific miR‐155 inhibitor (Figure 5D, Firefly CLDN1+M+I). These results confirmed that human CLDN1 is directly targeted by miR‐155.
Figure 5.
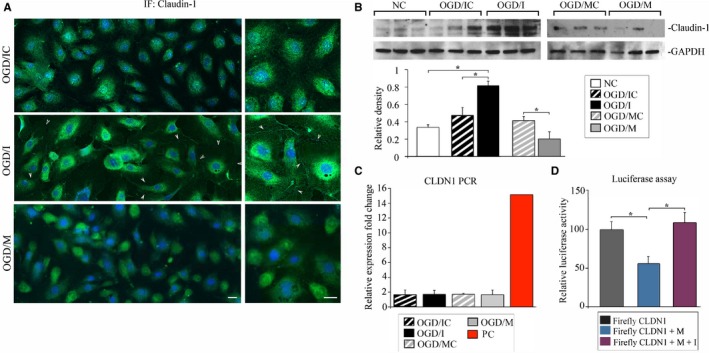
MicroRNA‐155 (miR‐155) inhibition results in stabilization of claudin‐1 (CLDN1). A, Immunofluorescence (IF) staining of CLDN1 in oxygen‐glucose deprivation (OGD)/control inhibitor (OGD/IC), specific miR‐155 inhibitor (OGD/I), and mimic (OGD/M) cells. Arrows demonstrate cell membrane localization of CLDN1 in OGD/I cells. Imaging was performed with a Zeiss LSM800 confocal microscope using tile scan and Z stack image acquisitions. Bar: 20 μm. B, Western blot analysis of CLDN1 protein expression in normoxic control (NC), OGD/IC, OGD/I, mimic control (OGD/MC), and OGD/M samples. Graph: optical density of the protein bands was measured using ImageJ software, normalized to GAPDH density in every sample, and expressed as the average relative density values. Mann–Whitney (Wilcoxon) test and Kruskal test were used to compare pairwise difference and overall difference, respectively. Overall differences were highly significant (P=0.0095); the pairwise difference between NC and OGD/I, OGD/IC, and OGD/I, and between OGD/MC and OGD/M was also significant (P=0.029). n=4 (for NC) and n=6 (for other groups) independent experiments. C, CLDN1 (CLDN1) quantitative polymerase chain reaction was performed in all samples (4 samples per group) and expressed as the relative fold change compared with CLDN1 expression in NC samples. Red bar demonstrates CLDN1 expression in the positive control sample (a mix of cDNAs synthesized from total RNA from 18 different human tissues; supplied by the manufacturer). D, Luciferase reporter assay, using Luc‐Pair Duo‐Luciferase HS Assay System, performed in HeLa cells. Cells were cotransfected with reporter plasmids carrying a fragment of the 3′‐UTR region of CLDN1 (Firefly CLDN1, grey bar), miR‐155 mimic (Firefly CLDN1+M, blue bar), and a combination of miR‐155 mimic and inhibitor (Firefly CLDN1+M+I, purple bar). Kruskal test showed a significant overall difference P=0.023). Mann–Whitney test showed a difference between Firefly CLDN1 and Firefly CLDN1+M (P=0.029), and between CLDN1+M and CLDN1+M+I (P=0.029). n=4 samples per group. Error bars: SEM; *P<0.05.
ZO‐1 and CLDN1 Colocalize and Bind to Each Other in OGD/I Cells
Based on the data described above, we hypothesized that stabilization of both CLDN1 and ZO‐1 in the OGD/I cells improves TJ integrity after miR‐155 inhibition. The 2 proteins can bind and interact with each other, and these interactions are critical for TJ assembly and maintenance.32, 33 Double immunofluorescence staining for CLDN1 and ZO‐1 is demonstrated in Figure 6A and 6B. To check for possible colocalization/co‐occurance of the 2 proteins in OGD/I cells, we performed a quantification of the immunofluorescence images and assessed the degree of overlap between 2 channels in the series of confocal microscopy images. ZO‐1/CLDN1 colocalization maps are shown in Figure 6C, with high magnification in Figure 6D, where yellow indicates full colocalization and red indicates no colocalization areas. In some cases, ZO‐1 and CLDN1 were coexpressed in the intracellular vesicles, as demonstrated in the representative orthogonal projection image in Figure 6E. Applied automated analysis detected Pearson colocalization coefficient r=0.88 (for the entire cell quantification) and r=0.66 for cell membrane localization. Mander co‐occurrence coefficients for both channels (M1 and M2) had a value of 0.99. Since the values of both coefficients were >0 and closer to 1, we conclude that CLDN1 and ZO‐1 are localized together in OGD/I cells, and, with high probability, interact with each other both in the cytoplasm and within the TJ plaque.
Figure 6.
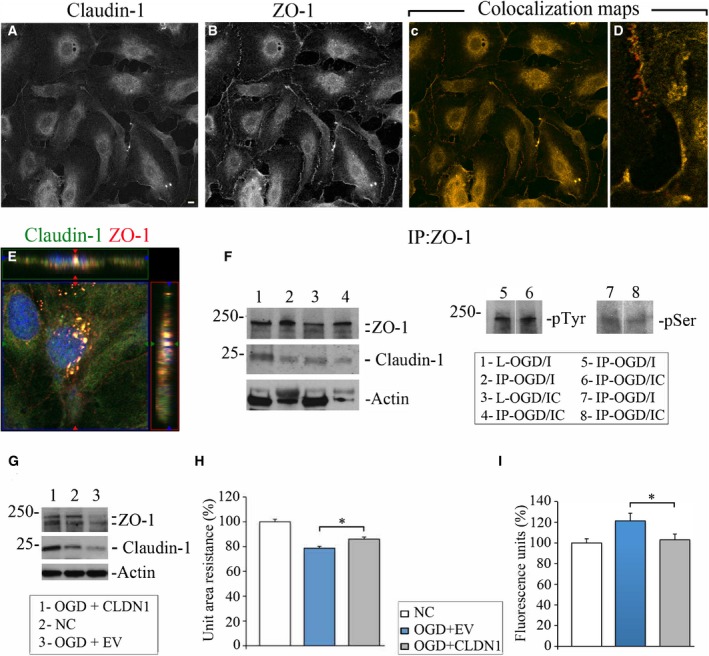
Claudin‐1 (CLDN1) and zonula occludens protein‐1 (ZO‐1) colocalize and interact in oxygen‐glucose deprivation (OGD)/specific miR‐155 inhibitor (OGD/I) cells. Double immunofluorescence staining of OGD/I cells with anti‐CLDN1 (A) and anti–ZO‐1 (B) antibodies. C and D, Colocalization maps automatically generated using Fiji software demonstrate colocalization (yellow) and no colocalization (red pixels) of 2 channels in the cells (C); enlarged details in (D) depict the degree of colocalization on the cell borders. Bar: 10 μm. E, Orthogonal projection of human primary brain microvascular endothelial cells from the OGD/I group, coimmunostained with anti‐CLDN1 (green) and anti–ZO‐1 (red) antibodies. 4′,6‐Diamidino‐2‐phenylindole staining was used to visualize nuclei (blue). Imaging was performed with a Zeiss LSM800 confocal microscope using tile scan and Z stack image acquisitions. F, Cell lysates from the OGD/I and OGD/control inhibitor (OGD/IC) groups (L‐OGD/I and L‐OGD/IC) were immunoprecipitated with anti–ZO‐1 antibody. Immunoprecipitates (IP‐OGD/I and IP‐OGD/IC) were probed with antibodies against ZO‐1, CLDN1, actin, phosphotyrosine (pTyr), and phosphoserine (pSer). G through I, OGD‐subjected cells were transfected with CLDN1 cDNA‐containing vector (OGD+CLDN1) or empty vector (OGD+EV). G, expression of ZO‐1 and CLDN1 was detected in OGD+CLDN1 (lane 1), normoxic control (NC; lane 2), and OGD+EV (lane 3) samples. Actin was used as a loading control. H, Endothelial monolayer resistance was assessed at 48 hours after the cell transfection. Measurements were performed in NC (white bar), OGD+EV (blue bar), and OGD+CLDN1 (grey bar) cells. Measured resistances were corrected by subtracting blank resistance and multiplying by the area of the insert membrane. Final unit area resistance data are expressed as percentage of the measurements in NC cells (graph). n=3 (for OGD+EV and NC) and n=4 (for OGD+CLDN1) independent experiments, and each experiment had 24 wells (unit of analysis). Tests based on linear mixed effects models show an overall difference (P<0.001) and a difference between OGD+EV and OGD+CLDN1 (P=0.029). I, Following the monolayer resistance measurements, the same cells were subjected to endothelial monolayer permeability assay. The amount of fluorescent dextran diffusing through the monolayer from the upper chamber to the lower chamber was measured with a microplate fluorometer. Data on the graph are expressed as a percentage of the fluorescence intensity measured in NC cells. n=3 independent experiments each with 24 wells per group (unit of analysis). Tests based on linear mixed effects models revealed a significant overall difference (P=0.001), and a difference between EV and CLDN1 (P=0.018). Error bars: SEM; *P<0.05.
Immunoprecipitation with ZO‐1 antibody confirmed our immunofluorescence data, showing that CLDN1 coimmunoprecipitated with ZO‐1 in HBMECs (Figure 6F, ZO‐1 and CLDN1 immunoblots). Levels of CLDN1 and ZO‐1 were visually greater in the immunoprecipitates from OGD/I samples (IP‐OGD/I), as compared with OGD/IC controls. The amount of coprecipitated actin (ZO‐1 is an actin‐associated protein) was also higher in the OGD/I samples (Figure 6F, actin immunoblot). Since the expression of both ZO‐1 and CLDN1 was initially lower in OGD/IC cell lysates, the comparative analysis of the immunoprecipitation results between OGD/IC and OGD/I groups is irrelevant. Nonetheless, the immunoprecipitation experiments demonstrate that despite the low expression, CLDN1 directly binds to ZO‐1 in HBMECs, and this association becomes more efficient after the miR‐155 downregulation. ZO‐1 levels and localization are influenced by its phosphorylation.8, 34 Therefore, we compared the ZO‐1 phosphorylation state in anti–ZO‐1 immunoprecipitates from OGD/I and OGD/IC cells. Immunoblot with phosphotyrosine antibody detected that ZO‐1 was phosphorylated both in OGD/I and OGD/IC samples (Figure 6F, pTyr immunoblot, lanes 5 and 6). Weak phosphorylation of ZO‐1 on serine residue was detected in both immunoprecipitates (Figure 6F, pSer immunoblot, lanes 7 and 8). Overall, no prominent differences in ZO‐1 phosphorylation (both on Tyr and Ser residues) were found between OGD/I and OGD/IC samples. Based on these data we conclude that CLDN1/ZO‐1 interaction in OGD/I cells is not associated with the changes in ZO‐1 phosphorylation.
In order to confirm that the miR‐155 inhibition–induced effect on ZO‐1 expression and TJ strengthening was mediated via CLDN1, we transfected human CLDN1 cDNA into HBMECs subjected to OGD. The increased expression of CLDN1 resulted in ZO‐1 stabilization following OGD (Figure 6G, lane 1; representative OGD+CLDN1 sample). In addition, stabilization of CLDN1 and ZO‐1 was associated with a significant increase in the electrical resistance and decrease in permeability of the endothelial monolayer (Figure 6H and 6I). Together, these data demonstrate that CLDN1 overexpression and miR‐155 inhibition had similar effects on HBMEC TJ integrity.
Discussion
The mechanisms that drive BBB dysfunction after ischemia/hypoxia remain elusive, and a probable involvement of miR‐155 in these processes is still unclear. Several studies report an induction of miR‐155 expression after hypoxia35, 36 and following stroke.37, 38 Similar to our in vivo studies, the expression of miR‐155 was not significantly altered in HBMECs at 3 days after the in vitro hypoxia. Nevertheless, based on our previous and present investigations, we propose that the inhibition of this miRNA has a positive effect on the processes associated with postischemic recovery.
Our present study discloses a beneficial effect of miR‐155 inhibition on the endothelial barrier function. We utilized the OGD (to mimic ischemia/reperfusion conditions) and an in vitro cell culture transwell model. Primary HBMECs used in our study are highly relevant for this investigation, as the BBB‐forming microvascular endothelium is extremely vulnerable to stroke‐related injury. The in vitro experimental setup imitated our in vivo studies (miR‐155 inhibitor was applied after the OGD, and its effect was studied 48 hours later), with slight modifications specific to cell culture experiments. We believe that our experimental setup bears a resemblance to hypoxia/ischemia and reperfusion processes after stroke. Our data reflect a disruption of cell adhesion after the OGD, as well as HBMECs ability to recover, assemble TJs, and form a monolayer after the restoration of oxygen and nutrient supply.
In agreement with our previous in vivo studies, miR‐155 inhibition supported the endothelial barrier function, which was reflected in the increased electrical resistance and decreased monolayer permeability. In contrast to the inhibition of miR‐155, its overexpression did not have a significant effect on the electrical resistance. The electrical resistance of the monolayer is mostly sensitive to the composition of claudins in the TJs.39 Therefore, we suppose that the electrical resistance in OGD/M and OGD/C control cells was similar because of the absence of CLDN1 on the cell membranes in both groups. A stronger effect of miR‐155 overexpression on the HBMEC permeability could be associated with the additional factors influencing solute penetration including possible direct effect of miR‐155 inhibition on the actin cytoskeleton and the transcellular flow.
In order to explain the possible mechanisms underlying the anti–miR‐155–induced support of the endothelial integrity, we checked several cellular processes associated both with the endothelial barrier functions and miR‐155. Our analyses showed no prominent effect of miR‐155 inhibition or overexpression (after OGD) on HBMEC viability, and no difference in NO or cytokine production was detected between treatment groups. Based on our in vivo studies demonstrating the increase in endothelial NO synthase expression following miR‐155 inhibition, we expected that miR‐155 silencing would stimulate NO production. These expectations were not supported by our in vitro results. We therefore presume that in the in vitro setting, hypoxia induces endothelial dysfunction, which inhibits NO release from the HBMECs.40, 41 This could be associated with: (1) NO trapping by free radicals, and (2) reduced endothelial NO synthase activity (even with its elevated expression).
In pathological states involving the barrier dysfunction, the levels of cell junction proteins present in the microvessels are altered, contributing to the barrier breakdown. miR‐155 inhibition or overexpression after the OGD did not have a prominent effect on occludin and CLDN5, but significantly influenced the expression levels and cellular localization of major TJ scaffolding protein ZO‐1. Interestingly, similar effect on ZO‐1 was observed in our in vivo miR‐155 inhibition experiments. As ZO‐1 is not a direct target of miR‐155, we looked at the possible mediators of ZO‐1 stabilization among the direct targets, including Rheb and RhoA. These factors, however, were not affected by the changes in miR‐155 levels.
CLDN1, one of the major components of TJs, is among the direct targets of miR‐155.42, 43 While CLDN5 is highly expressed in the brain endothelium, CLDN1 expression in cerebral capillaries is low and was only confirmed to be present in human, rat, and sheep BBB.3, 30, 31 Regardless of the low expression, CLDN1 function in human brain capillaries is critical for the maintenance of the BBB integrity during neuroinflammation and brain tumor.29, 44 In the experimental model of EAE, the induced expression of CLDN1 in only 30% to 50% of brain vasculature was sufficient for BBB strengthening and significant amelioration of the disease.45 Based on these studies and our own data, we propose that increased expression of CLDN1 and ZO‐1 after miR‐155 inhibition significantly contribute to the stabilization of HBMECs monolayer after OGD. Overexpression of miR‐155 resulted in prominent reduction of both CLDN1 and ZO‐1 in the HBMECs, which confirms that miR‐155 influences both the levels and cellular localization of these proteins. Based on our results, we hypothesize that ZO‐1 stabilization in the OGD/I cells is mediated via CLDN1. The claudin–ZO‐1 interaction results in recruitment of ZO‐1 to claudin‐based cellular networks on cell‐cell borders, which is critical for TJ assembly and maintenance.32, 33 Thus, we concluded that the increased expression of these 2 major TJ proteins following miR‐155 downregulation, and their translocation to the cell membranes, make this interaction more efficient. The observed co‐occurrence of the 2 proteins in the intracellular vesicles points to a possibility that they are transported together as the components of vesicular membrane traffic, which is critical for TJ assembly.46 Interestingly, CLDN1/ZO‐1 interaction is required for trafficking of claudins and formation of the TJ complex.47
Based on our results, miR‐155 inhibition and overexpression have strong effects of the actin cytoskeleton. Such cytoskeletal modulation is likely to play a significant role in the described effects of miR‐155 on the endothelial barrier. Apart from ZO‐1/CLDN1 interactions, other cell signaling pathways involving VE‐cadherin (showing stronger membrane expression), and direct miR‐155 targets SMAD‐1 and Rictor (significantly increased after miR‐155 inhibition) could also contribute to the barrier strengthening in the OGD/I cells. SMAD‐1 is a member of the bone morphogenetic protein pathway, implicated in vascular stabilization.48 Increased expression of Rictor, a major component of the mTORC2 complex, could activate mTOR signaling, which plays an important role in endothelial cell function.49, 50
Conclusions
Our investigation demonstrates that inhibition of miR‐155 supports the integrity and barrier properties of HBMECs after the OGD. This support is associated with the membrane localization and increased expression levels of major TJ proteins ZO‐1 and CLDN1. We propose that miRNA inhibition–induced stabilization of ZO‐1 and the overall improvement of the endothelial barrier function are mediated via miR‐155 direct target protein CLDN1. The present investigation supports our hypothesis that cerebral regeneration after stroke can be improved by the modulation of miR‐155 activity.
Author Contributions
Pena‐Philippides performed all experiments, contributed to the experimental design, and performed data analyses. Gardiner performed miRNA PCR, luciferase reporter assay, and data analyses. Caballero‐Garrido participated in the experiments involving endothelial permeability and resistance assays and immunofluorescence staining. Pan performed an oxygen‐glucose deprivation. Zhu designed and performed in‐depth statistical analysis, ensured the overall approach to data analysis and interpretation, and participated in the writing of the data analysis section. Roitbak contributed to the experimental design, performed experiments and data analyses, and wrote the article.
Sources of Funding
This work was supported by the National Institutes of Health/National Institute of Neurological Disorders and Stroke grant R01NS082225. Biostatistical support was received in part through the University of New Mexico Clinical & Translational Science Center funded through National Institutes of Health grant UL1TR001449.
Disclosures
None.
Supporting information
Figure S1. Human primary brain microvascular endothelial cell (HBMEC) characterization. Immunofluorescence staining of HBMECs with anti‐CD31 (A, green), anti–vascular endothelial (VE)–cadherin (B, green), and anti–von Willebrand factor (vWF) (C, red; costained with Acti‐stain 488 phalloidin, green). D, HBMECs were seeded on Matrigel matrix (BD Biosci) for 24 hours to induce capillary‐like tube formation. The formed tubes were stained with Actistain 488 phalloidin, green. All images were acquired using a Zeiss LSM800 confocal microscope. Bars: (A through C) 10 μm, (D) 50 μm.
Figure S2. Zonula occludens protein‐1 (ZO‐1) cellular distribution in the different treatment groups. ZO‐1 expression and cellular distribution were evaluated in normoxic control (NC), oxygen‐glucose deprivation (OGD)/control inhibitor (OGD/IC), specific miR‐155 inhibitor (OGD/I), and mimic (OGD/M) cells using immunofluorescence staining for ZO‐1 (red). Imaging was performed with a Zeiss LSM800 confocal microscope using tile scan and Z stack image acquisitions. Bar: 20 μm.
Acknowledgments
Confocal microscopy was performed in the University of New Mexico Cancer Center Fluorescence Microscopy Facility. We thank Dr Nora Bizzozero for her valuable input and critical suggestions.
(J Am Heart Assoc. 2018;7:e009244 DOI: 10.1161/JAHA.118.009244.)
References
- 1. Ballabh P, Braun A, Nedergaard M. The blood‐brain barrier: an overview: structure, regulation, and clinical implications. Neurobiol Dis. 2004;16:1–13. [DOI] [PubMed] [Google Scholar]
- 2. Zhao Z, Nelson AR, Betsholtz C, Zlokovic BV. Establishment and dysfunction of the blood‐brain barrier. Cell. 2015;163:1064–1078. [DOI] [PMC free article] [PubMed] [Google Scholar]
- 3. Haseloff RF, Dithmer S, Winkler L, Wolburg H, Blasig IE. Transmembrane proteins of the tight junctions at the blood‐brain barrier: structural and functional aspects. Semin Cell Dev Biol. 2015;38:16–25. [DOI] [PubMed] [Google Scholar]
- 4. Krause G, Winkler L, Mueller SL, Haseloff RF, Piontek J, Blasig IE. Structure and function of claudins. Biochim Biophys Acta. 2008;1778:631–645. [DOI] [PubMed] [Google Scholar]
- 5. Van Itallie CM, Anderson JM. Claudin interactions in and out of the tight junction. Tissue Barriers. 2013;1:e25247. [DOI] [PMC free article] [PubMed] [Google Scholar]
- 6. del Zoppo GJ, Mabuchi T. Cerebral microvessel responses to focal ischemia. J Cereb Blood Flow Metab. 2003;23:879–894. [DOI] [PubMed] [Google Scholar]
- 7. Engelhardt S, Al‐Ahmad AJ, Gassmann M, Ogunshola OO. Hypoxia selectively disrupts brain microvascular endothelial tight junction complexes through a hypoxia‐inducible factor‐1 (HIF‐1) dependent mechanism. J Cell Physiol. 2014;229:1096–1105. [DOI] [PubMed] [Google Scholar]
- 8. Fischer S, Wobben M, Marti HH, Renz D, Schaper W. Hypoxia‐induced hyperpermeability in brain microvessel endothelial cells involves VEGF‐mediated changes in the expression of zonula occludens‐1. Microvasc Res. 2002;63:70–80. [DOI] [PubMed] [Google Scholar]
- 9. Fabian MR, Sonenberg N, Filipowicz W. Regulation of mRNA translation and stability by microRNAs. Annu Rev Biochem. 2010;79:351–379. [DOI] [PubMed] [Google Scholar]
- 10. Kato M, Slack FJ. MicroRNAs: small molecules with big roles—C. elegans to human cancer. Biol Cell. 2008;100:71–81. [DOI] [PubMed] [Google Scholar]
- 11. Sun W, Julie Li YS, Huang HD, Shyy JY, Chien S. MicroRNA: a master regulator of cellular processes for bioengineering systems. Annu Rev Biomed Eng. 2010;12:1–27. [DOI] [PubMed] [Google Scholar]
- 12. Cichon C, Sabharwal H, Ruter C, Schmidt MA. MicroRNAs regulate tight junction proteins and modulate epithelial/endothelial barrier functions. Tissue Barriers. 2014;2:e944446. [DOI] [PMC free article] [PubMed] [Google Scholar]
- 13. Faraoni I, Antonetti FR, Cardone J, Bonmassar E. miR‐155 gene: a typical multifunctional microRNA. Biochim Biophys Acta. 2009;1792:497–505. [DOI] [PubMed] [Google Scholar]
- 14. O'Connell RM, Kahn D, Gibson WS, Round JL, Scholz RL, Chaudhuri AA, Kahn ME, Rao DS, Baltimore D. MicroRNA‐155 promotes autoimmune inflammation by enhancing inflammatory T cell development. Immunity. 2010;33:607–619. [DOI] [PMC free article] [PubMed] [Google Scholar]
- 15. Landgraf P, Rusu M, Sheridan R, Sewer A, Iovino N, Aravin A, Pfeffer S, Rice A, Kamphorst AO, Landthaler M, Lin C, Socci ND, Hermida L, Fulci V, Chiaretti S, Foa R, Schliwka J, Fuchs U, Novosel A, Muller RU, Schermer B, Bissels U, Inman J, Phan Q, Chien M, Weir DB, Choksi R, De Vita G, Frezzetti D, Trompeter HI, Hornung V, Teng G, Hartmann G, Palkovits M, Di Lauro R, Wernet P, Macino G, Rogler CE, Nagle JW, Ju J, Papavasiliou FN, Benzing T, Lichter P, Tam W, Brownstein MJ, Bosio A, Borkhardt A, Russo JJ, Sander C, Zavolan M, Tuschl T. A mammalian microRNA expression atlas based on small RNA library sequencing. Cell. 2007;129:1401–1414. [DOI] [PMC free article] [PubMed] [Google Scholar]
- 16. Sun HX, Zeng DY, Li RT, Pang RP, Yang H, Hu YL, Zhang Q, Jiang Y, Huang LY, Tang YB, Yan GJ, Zhou JG. Essential role of microRNA‐155 in regulating endothelium‐dependent vasorelaxation by targeting endothelial nitric oxide synthase. Hypertension. 2012;60:1407–1414. [DOI] [PubMed] [Google Scholar]
- 17. Roitbak T, Bragina O, Padilla JL, Pickett GG. The role of microRNAs in neural stem cell‐supported endothelial morphogenesis. Vasc Cell. 2011;3:25. [DOI] [PMC free article] [PubMed] [Google Scholar]
- 18. Caballero‐Garrido E, Pena‐Philippides JC, Lordkipanidze T, Bragin D, Yang Y, Erhardt EB, Roitbak T. In vivo inhibition of miR‐155 promotes recovery after experimental mouse stroke. J Neurosci. 2015;35:12446–12464. [DOI] [PMC free article] [PubMed] [Google Scholar]
- 19. Pena‐Philippides JC, Caballero‐Garrido E, Lordkipanidze T, Roitbak T. In vivo inhibition of miR‐155 significantly alters post‐stroke inflammatory response. J Neuroinflammation. 2016;13:287. [DOI] [PMC free article] [PubMed] [Google Scholar]
- 20. Li YN, Pan R, Qin XJ, Yang WL, Qi Z, Liu W, Liu KJ. Ischemic neurons activate astrocytes to disrupt endothelial barrier via increasing VEGF expression. J Neurochem. 2014;129:120–129. [DOI] [PMC free article] [PubMed] [Google Scholar]
- 21. Martins‐Green M, Petreaca M, Yao M. An assay system for in vitro detection of permeability in human “endothelium”. Methods Enzymol. 2008;443:137–153. [DOI] [PubMed] [Google Scholar]
- 22. Utepbergenov DI, Mertsch K, Sporbert A, Tenz K, Paul M, Haseloff RF, Blasig IE. Nitric oxide protects blood‐brain barrier in vitro from hypoxia/reoxygenation‐mediated injury. FEBS Lett. 1998;424:197–201. [DOI] [PubMed] [Google Scholar]
- 23. Forsyth KD, Talbot V, Beckman I. Endothelial serpins‐protectors of the vasculature? Clin Exp Immunol. 1994;95:277–282. [DOI] [PMC free article] [PubMed] [Google Scholar]
- 24. Freese C, Hanada S, Fallier‐Becker P, Kirkpatrick CJ, Unger RE. Identification of neuronal and angiogenic growth factors in an in vitro blood‐brain barrier model system: relevance in barrier integrity and tight junction formation and complexity. Microvasc Res. 2017;111:1–11. [DOI] [PubMed] [Google Scholar]
- 25. Yang D, Wang J, Xiao M, Zhou T, Shi X. Role of miR‐155 in controlling HIF‐1alpha level and promoting endothelial cell maturation. Sci Rep. 2016;6:35316. [DOI] [PMC free article] [PubMed] [Google Scholar]
- 26. Saeedi BJ, Kao DJ, Kitzenberg DA, Dobrinskikh E, Schwisow KD, Masterson JC, Kendrick AA, Kelly CJ, Bayless AJ, Kominsky DJ, Campbell EL, Kuhn KA, Furuta GT, Colgan SP, Glover LE. HIF‐dependent regulation of claudin‐1 is central to intestinal epithelial tight junction integrity. Mol Biol Cell. 2015;26:2252–2262. [DOI] [PMC free article] [PubMed] [Google Scholar]
- 27. Wang J, Yang K, Zhou L, Minhaowu , Wu Y, Zhu M, Lai X, Chen T, Feng L, Li M, Huang C, Zhong Q, Huang X. MicroRNA‐155 promotes autophagy to eliminate intracellular mycobacteria by targeting Rheb. PLoS Pathog. 2013;9:e1003697. [DOI] [PMC free article] [PubMed] [Google Scholar]
- 28. Bijkerk R, de Bruin RG, van Solingen C, Duijs JM, Kobayashi K, van der Veer EP, ten Dijke P, Rabelink TJ, Goumans MJ, van Zonneveld AJ. MicroRNA‐155 functions as a negative regulator of RhoA signaling in TGF‐beta‐induced endothelial to mesenchymal transition. Microrna. 2012;1:2–10. [DOI] [PubMed] [Google Scholar]
- 29. Lopez‐Ramirez MA, Wu D, Pryce G, Simpson JE, Reijerkerk A, King‐Robson J, Kay O, de Vries HE, Hirst MC, Sharrack B, Baker D, Male DK, Michael GJ, Romero IA. MicroRNA‐155 negatively affects blood‐brain barrier function during neuroinflammation. FASEB J. 2014;28:2551–2565. [DOI] [PubMed] [Google Scholar]
- 30. Fletcher NF, Wilson GK, Murray J, Hu K, Lewis A, Reynolds GM, Stamataki Z, Meredith LW, Rowe IA, Luo G, Lopez‐Ramirez MA, Baumert TF, Weksler B, Couraud PO, Kim KS, Romero IA, Jopling C, Morgello S, Balfe P, McKeating JA. Hepatitis C virus infects the endothelial cells of the blood‐brain barrier. Gastroenterology. 2012;142:634–643.e636. [DOI] [PMC free article] [PubMed] [Google Scholar]
- 31. Willis CL, Camire RB, Brule SA, Ray DE. Partial recovery of the damaged rat blood‐brain barrier is mediated by adherens junction complexes, extracellular matrix remodeling and macrophage infiltration following focal astrocyte loss. Neuroscience. 2013;250:773–785. [DOI] [PMC free article] [PubMed] [Google Scholar]
- 32. Itoh M, Furuse M, Morita K, Kubota K, Saitou M, Tsukita S. Direct binding of three tight junction‐associated MAGUKs, ZO‐1, ZO‐2, and ZO‐3, with the COOH termini of claudins. J Cell Biol. 1999;147:1351–1363. [DOI] [PMC free article] [PubMed] [Google Scholar]
- 33. Krause G, Protze J, Piontek J. Assembly and function of claudins: structure‐function relationships based on homology models and crystal structures. Semin Cell Dev Biol. 2015;42:3–12. [DOI] [PubMed] [Google Scholar]
- 34. Nunbhakdi‐Craig V, Machleidt T, Ogris E, Bellotto D, White CL III, Sontag E. Protein phosphatase 2A associates with and regulates atypical PKC and the epithelial tight junction complex. J Cell Biol. 2002;158:967–978. [DOI] [PMC free article] [PubMed] [Google Scholar]
- 35. Bruning U, Cerone L, Neufeld Z, Fitzpatrick SF, Cheong A, Scholz CC, Simpson DA, Leonard MO, Tambuwala MM, Cummins EP, Taylor CT. MicroRNA‐155 promotes resolution of hypoxia‐inducible factor 1alpha activity during prolonged hypoxia. Mol Cell Biol. 2011;31:4087–4096. [DOI] [PMC free article] [PubMed] [Google Scholar]
- 36. Wan G, Xie W, Liu Z, Xu W, Lao Y, Huang N, Cui K, Liao M, He J, Jiang Y, Yang BB, Xu H, Xu N, Zhang Y. Hypoxia‐induced MIR155 is a potent autophagy inducer by targeting multiple players in the MTOR pathway. Autophagy. 2014;10:70–79. [DOI] [PMC free article] [PubMed] [Google Scholar]
- 37. Xing G, Luo Z, Zhong C, Pan X, Xu X. Influence of miR‐155 on cell apoptosis in rats with ischemic stroke: role of the Ras homolog enriched in brain (Rheb)/mTOR pathway. Med Sci Monit. 2016;22:5141–5153. [DOI] [PMC free article] [PubMed] [Google Scholar]
- 38. Meng YC, Ding ZY, Wang HQ, Ning LP, Wang C. Effect of microRNA‐155 on angiogenesis after cerebral infarction of rats through AT1R/VEGFR2 pathway. Asian Pac J Trop Med. 2015;8:829–835. [DOI] [PubMed] [Google Scholar]
- 39. Anderson JM, Van Itallie CM. Physiology and function of the tight junction. Cold Spring Harb Perspect Biol. 2009;1:a002584. [DOI] [PMC free article] [PubMed] [Google Scholar]
- 40. Huang PL. Endothelial nitric oxide synthase and endothelial dysfunction. Curr Hypertens Rep. 2003;5:473–480. [DOI] [PubMed] [Google Scholar]
- 41. McQuillan LP, Leung GK, Marsden PA, Kostyk SK, Kourembanas S. Hypoxia inhibits expression of eNOS via transcriptional and posttranscriptional mechanisms. Am J Physiol. 1994;267:H1921–H1927. [DOI] [PubMed] [Google Scholar]
- 42. Qin W, Ren Q, Liu T, Huang Y, Wang J. MicroRNA‐155 is a novel suppressor of ovarian cancer‐initiating cells that targets CLDN1. FEBS Lett. 2013;587:1434–1439. [DOI] [PubMed] [Google Scholar]
- 43. Zhang GJ, Xiao HX, Tian HP, Liu ZL, Xia SS, Zhou T. Upregulation of microRNA‐155 promotes the migration and invasion of colorectal cancer cells through the regulation of claudin‐1 expression. Int J Mol Med. 2013;31:1375–1380. [DOI] [PubMed] [Google Scholar]
- 44. Liebner S, Fischmann A, Rascher G, Duffner F, Grote EH, Kalbacher H, Wolburg H. Claudin‐1 and claudin‐5 expression and tight junction morphology are altered in blood vessels of human glioblastoma multiforme. Acta Neuropathol. 2000;100:323–331. [DOI] [PubMed] [Google Scholar]
- 45. Pfeiffer F, Schafer J, Lyck R, Makrides V, Brunner S, Schaeren‐Wiemers N, Deutsch U, Engelhardt B. Claudin‐1 induced sealing of blood‐brain barrier tight junctions ameliorates chronic experimental autoimmune encephalomyelitis. Acta Neuropathol. 2011;122:601–614. [DOI] [PMC free article] [PubMed] [Google Scholar]
- 46. Yu D, Turner JR. Stimulus‐induced reorganization of tight junction structure: the role of membrane traffic. Biochim Biophys Acta. 2008;1778:709–716. [DOI] [PMC free article] [PubMed] [Google Scholar]
- 47. Umeda K, Ikenouchi J, Katahira‐Tayama S, Furuse K, Sasaki H, Nakayama M, Matsui T, Tsukita S, Furuse M, Tsukita S. ZO‐1 and ZO‐2 independently determine where claudins are polymerized in tight‐junction strand formation. Cell. 2006;126:741–754. [DOI] [PubMed] [Google Scholar]
- 48. Pardali E, Goumans MJ, ten Dijke P. Signaling by members of the TGF‐beta family in vascular morphogenesis and disease. Trends Cell Biol. 2010;20:556–567. [DOI] [PubMed] [Google Scholar]
- 49. Karar J, Maity A. PI3K/AKT/mTOR pathway in angiogenesis. Front Mol Neurosci. 2011;4:51. [DOI] [PMC free article] [PubMed] [Google Scholar]
- 50. Wang S, Amato KR, Song W, Youngblood V, Lee K, Boothby M, Brantley‐Sieders DM, Chen J. Regulation of endothelial cell proliferation and vascular assembly through distinct mTORC2 signaling pathways. Mol Cell Biol. 2015;35:1299–1313. [DOI] [PMC free article] [PubMed] [Google Scholar]
Associated Data
This section collects any data citations, data availability statements, or supplementary materials included in this article.
Supplementary Materials
Figure S1. Human primary brain microvascular endothelial cell (HBMEC) characterization. Immunofluorescence staining of HBMECs with anti‐CD31 (A, green), anti–vascular endothelial (VE)–cadherin (B, green), and anti–von Willebrand factor (vWF) (C, red; costained with Acti‐stain 488 phalloidin, green). D, HBMECs were seeded on Matrigel matrix (BD Biosci) for 24 hours to induce capillary‐like tube formation. The formed tubes were stained with Actistain 488 phalloidin, green. All images were acquired using a Zeiss LSM800 confocal microscope. Bars: (A through C) 10 μm, (D) 50 μm.
Figure S2. Zonula occludens protein‐1 (ZO‐1) cellular distribution in the different treatment groups. ZO‐1 expression and cellular distribution were evaluated in normoxic control (NC), oxygen‐glucose deprivation (OGD)/control inhibitor (OGD/IC), specific miR‐155 inhibitor (OGD/I), and mimic (OGD/M) cells using immunofluorescence staining for ZO‐1 (red). Imaging was performed with a Zeiss LSM800 confocal microscope using tile scan and Z stack image acquisitions. Bar: 20 μm.