

Abstract
Background
Postural tachycardia syndrome (POTS) is a heterogeneous condition. We stratified patients previously evaluated for POTS on the basis of supine resting cardiac output (CO) or with the complaint of platypnea or “shortness of breath” during orthostasis. We hypothesize that postural hyperventilation is one cause of POTS and that hyperventilation‐associated POTS occurs when initial reduction in CO is sufficiently large. We also propose that circulatory abnormalities normalize with restoration of CO 2.
Methods and Results
Fifty‐eight enrollees with POTS were compared with 16 healthy volunteer controls. Low CO in POTS was defined by a resting supine CO <4 L/min. Patients with shortness of breath had hyperventilation with end tidal CO 2 <30 Torr during head‐up tilt table testing. There were no differences in height or weight between control patients and patients with POTS or differences between the POTS groups. Beat‐to‐beat blood pressure was measured by photoplethysmography, and CO was measured by ModelFlow. Systemic vascular resistance was defined as mean arterial blood pressure/CO. End tidal CO 2 and cerebral blood flow velocity of the middle cerebral artery were only reduced during head‐up tilt in the hyperventilation group, whereas blood pressure was increased compared with control. We corrected the reduced end tidal CO 2 in hyperventilation by addition of exogenous CO 2 into a rebreathing apparatus. With added CO 2, heart rate, blood pressure, CO, and systemic vascular resistance in hyperventilation became similar to control.
Conclusions
We conclude that all POTS is related to decreased CO, decreased central blood volume, and increased systemic vascular resistance and that a variant of POTS is consequent to postural hyperventilation.
Keywords: blood flow regulation, blood volume, hyperventilation, orthostatic intolerance, tachycardia, vasoconstriction, ventilation
Subject Categories: Physiology, Vascular Disease
Clinical Perspective
What Is New?
We describe a subset of patients with postural tachycardia syndrome who, as a consequence of an imposed orthostatic challenge, exhibit postural hyperventilation in the form of hypocapnic hyperpnea, causing reduced cerebral blood flow velocity, consequent lightheadedness, and increased blood pressure; the hemodynamic deficits of this postural tachycardia syndrome group can be corrected by supplemental CO2.
What Are the Clinical Implications?
Hypocapnic hyperventilation is known to produce tachycardia and symptoms often associated with orthostatic intolerance; therefore, postural hyperventilation causes a form of postural tachycardia syndrome.
Standing upright (orthostasis) translocates central blood volume (CBV) to the dependent body and can precipitate orthostatic intolerance (OI). Symptoms of OI generally begin within 5 minutes of orthostatic stress. OI is defined by signs, such as changes in heart rate (HR), blood pressure (BP), or respiration; and symptoms, such as lightheadedness, headache, nausea, fatigue, cognitive deficits, and exercise intolerance starting while upright and relieved by recumbency.1, 2 Postural tachycardia syndrome (POTS), a common form of chronic OI, is associated with excess upright tachycardia in the absence of hypotension.3, 4, 5
Dyspnea, hyperventilation, and hypocapnia have been reported in association with POTS and also in other forms of OI, including neurogenic orthostatic hypotension and vasovagal syncope.6, 7, 8 Circulatory collapse9 and milder perturbations, such as induction of hypotension in healthy volunteers, result in hyperventilation and hypocapnia.10, 11 Hypotension and reduced cardiac output (CO) precedes hyperventilation in these OI variants and may act by causing ischemia of the carotid body (“stagnant hypoxia”),12 in part related to sympathetic vasoconstriction of the artery to the carotid body.13
Systemic hypotension, however, does not cause hyperventilation in POTS because, by definition, hypotension is absent in POTS.3, 4, 5 Nevertheless, intermittent hyperventilation, presenting as postural hypocapnic hyperpnea, has been reported.14, 15, 16, 17 We observed hypocapnic hyperpnea in POTS in response to a rapid initial orthostatic decrease in CO and CBV.15 In contrast, hyperventilation has not been observed during past experiments using graded incremental upright tilt.18
Hyperventilation produces sinus tachycardia, whereas resultant hypocapnia reduces cerebral blood flow, and results in symptoms and maladaptive effects, including impaired neuronal activation.19 Hypocapnia can be eliminated or diminished by artificial CO2 rebreathing or by adding CO2 to inhaled gas sufficient to produce eucapnia while maintaining oxygen concentration constant.20
We hypothesize that postural hyperventilation is a cause of POTS with normal CO supine, but decreased CO, decreased CBV, and increased systemic vascular resistance (SVR) common to all with POTS when upright. We further propose that hyperventilation‐associated POTS occurs when initial reduction in CO is sufficiently large and that circulatory abnormalities normalize with restoration of CO2.21, 22
Methods
The data, study materials, and analytic methods beyond those described in this article will be made available to other researchers by the authors for purposes of reproducing the results or replicating the procedure on reasonable request and Institutional Review Board approval.
Subjects
We enrolled 58 consecutive subjects previously diagnosed with POTS. Subjects with POTS were 13 to 26 years old (mean age, 18.1±1.2 years; 54 women and 4 men), with POTS defined by standard criteria.3, 23 All patients had symptoms for ≥6 months of chronic day‐to‐day symptoms of OI and symptom relief when once again supine. POTS was identified during tilt table testing by signs and symptoms of OI and an excessive increase in HR without hypotension within 10 minutes of head‐up tilt.4, 24, 25 Excessive tachycardia is defined in adolescents by an increase in HR of at least 40 beats per minute or an HR >120 beats per minute in the absence of postural hypotension and defined in patients >19 years by an HR increase of 30 beats per minute, during a 10‐minute upright tilt table test.3, 6 Other medical problems that could explain these signs or symptoms had been ruled out. We excluded potential enrollees with a history of respiratory disease, sleep apnea, or obesity. Patients with diagnosed panic disorder were also excluded.
Sixteen healthy volunteers were enrolled as control subjects, aged 14 to 24 years old (mean age, 19.4±2.4 years; 15 women and 1 man). Healthy control subjects recruited from the local community were nonsmokers, with no previously known medical conditions, free of systemic illness, taking no medications, with a normal physical examination and ECG. Healthy control subjects were included only if free of OI of any type, including orthostatic hypotension, POTS, or syncope.
We stratified subjects with POTS on the basis of supine resting CO measured by inert gas rebreathing technique (Innocor‐Innovision, Denmark). The lowest supine resting CO in control subjects was 4.2 L/min; therefore, low CO in POTS was defined a priori by a supine resting CO <4.0 L/min. In addition, we identified patients with POTS who complained of shortness of breath while upright. All of these patients had normal pulmonary function test results and no discernible cardiopulmonary or systemic illness. We regarded these dyspneic patients as a distinct subgroup of patients with POTS.
Patients were required to refrain from use of all medications for at least 2 weeks before study, with the exception of contraceptive or thyroid medications. Potential enrollees who could not wean off vasoactive or neuroactive medications were excluded. Enrollees were required to stop ingestion of xanthine‐, caffeine‐, or alcohol‐containing substances 72 hours before study. A light breakfast was permitted on testing day if eaten ≥2 hours before testing.
The Institutional Review Board of New York Medical College reviewed and approved this protocol. Each subject received a detailed description of all protocols and was given an opportunity to have his or her questions answered. Signed informed consent was obtained from all participants or their parents.
Instrumentation
All subjects were instrumented in a similar manner by the same operator. Height and weight were measured, and body mass index was calculated. During instrumentation, all subjects lay supine on an electronic motorized tilt table (Colin Medical Instruments Corp, San Antonio, TX) with a footboard. An electrocardiograph measured HR from the beat‐to‐beat cardiac electrical interval. Beat‐to‐beat BP was monitored using finger arterial plethysmography (Finometer; FMS, Amsterdam, the Netherlands) on the right middle or index finger and corrected for tilt angle, using ModelFlow software.26 Finometer data were calibrated to brachial artery pressure and intermittently checked against oscillometric BP measurements.
The Finometer uses the ModelFlow algorithm to estimate beat‐to‐beat CO by pulse‐wave analysis. Before experiments began, ModelFlow CO was calibrated against an Innocor inert gas rebreathing CO measurement (Innovision, Denmark) while supine. We computed SVR by dividing the time average arterial pressure (AP; mean AP [MAP]) by the ModelFlow CO averaged over each cardiac cycle. The first value of SVR was calculated by measuring a manual BP, calculating the estimated MAP from the formula MAP=(systolic BP+2 diastolic BP)/3, and dividing that result by the Innocor‐measured CO. Thereafter, continuous SVR was calculated from ModelFlow data.
We placed paired electrodes using anatomic landmarks to estimate thoracic, splanchnic, pelvic, and calf segmental blood volumes, by high‐frequency impedance plethysmography.27 Changes in electrical impedance were used to calculate changes in segmental or regional blood volumes. We estimated the change in blood volume in each segment after upright tilt using the following formula:
Δsegmental blood volume (mL)=ρ(L2/R0R1)ΔR, where ρ is electrical conductivity of blood estimated as 53.2·exp(hematocrit·0.022).27 R0 is the initial impedance, R1 is its final value, and ΔR=R1−R0 and L is the distance between the electrode pairs.
Impedance plethysmography was measured using a tetrapolar, high‐resolution, 4‐channel digital impedance plethysmograph, as previously described.14, 27 These quantities were obtained within 4 anatomic segments, defined by electrode placement on anatomic landmarks that delimit respective regional circulations, designated the thoracic segment or CBV (supraclavicular area to xyphoid process), the splanchnic segment (xyphoid process to iliac crest), the pelvic segment, including lower pelvis to the knee (iliac crest to knee), and the leg or calf segment (upper calf just below the knee to the ankle).
Forearm and calf volume were also measured continuously using mercury in silastic Whitney‐type strain gauges (Hokanson, Bellevue, WA). This allowed us to detect and counsel subjects against limb movements/muscle contractions that could influence study results. This also allowed us to avoid using data collected during times when limb movement was recorded.
Respiratory plethysmography (Respitrace; NIMS Scientific, Miami Beach, FL) normalized to pneumotachogram (Hans Rudolph, Shawnee, KS) and nasal cannula capnography with a pulse oximeter (Smith Medical PM, Waukesha, WI) measured changes in respiration, end tidal CO2 (ETCO2), and oxygen saturation. Transcranial Doppler (Neurovision; Multigon, Yonkers, NY) measured cerebral blood flow velocity (CBFv) of the left middle cerebral artery using a 2‐MHz probe fixed to the subject's head by a custom‐made headband. Signals were acquired at 200 samples/second, multiplexed, and A/D converted using custom software. These measurements are routine during our tilt table studies.
Protocol
Subjects arrived at 9:30 am. After instrumentation, subjects remained awake and supine for 30 minutes to acclimate. Baseline data comprised continuously measured HR, BP, respiratory rate, tidal volume (TV), expiratory minute volume (VE), ETCO2, CO, SVR, and CBFv. For purposes of comparison, we used averaged data for the 10 minutes immediately preceding tilt to determine baseline supine values. Mean ETCO2 over the last 10 minutes of the rest period was defined as baseline eucapnia for each subject throughout the protocol.
After supine data collections were complete, all subjects were tilted upright over 8 seconds to 70° for 10 minutes. Continuously measured HR, BP, ETCO2, respiratory data, CO, SVR, CBFv, and impedance data were recorded for off‐line analysis.
Spontaneous Hyperventilation (Hypocapnic Hyperpnea) and Restoration of Eucapnia
Supine healthy volunteers had ETCO2 values that ranged between 38 and 40 Torr. In all, ETCO2 decreased modestly with upright tilt, but was never <33 Torr. We, therefore, defined hyperventilation by an upright ETCO2 consistently <30 Torr that persisted during the tilt test. Patients who hyperventilated received supplemental CO2 near the end of tilt using the “dynamic end tidal forcing” technique,20 to return their ETCO2 to eucapnic levels. This allowed for the manipulation of the end‐tidal concentration of one gas while maintaining the end‐tidal concentration of the other gases constant. Eucapnia was restored using 21% O2 balanced with N2 while maintaining CO2 near 40 Torr by adding CO2 to the breathing circuit as needed, as we have previously described.28 The patients maintained spontaneous breathing frequency and TV throughout. A rebreathing apparatus was used to control inspired gases. Subjects were not aware of what, if any, intervention was being performed, because they were not told when or if the gases that they were breathing were altered. Subjects were not aware of what their ETCO2 values were.
We used a 30‐L breathing bag (Rusch, Research Triangle Park, NC). The gas in the bag was constantly replenished from cylinders of O2, CO2, and N2, and they were mixed to the desired composition using a gas rotometer flowmeter (model FL‐6GP; Omega Engineering, Stamford, CT). The breathing bag was always fully inflated at the start of inspiration to ensure a constant flow. Two‐stage gas flow regulators (Western Medica, Westlake, OH) connected to each of the 3 air cylinders (O2, CO2, and N2) were used to achieve constant gas flow at the desired concentration of the air mixture balanced with N2. The inhaled O2 concentration was measured continuously and directly by an oxygen sensor (S‐3A/I Oxygen Analyzer with N‐22M Sensor; AEI Technologies, Naperville, IL) attached to gas conducting tubing, leading to the patient. The oxygen sensor was calibrated using known concentrations of O2 before each experiment. Normalized respiratory impedance data were used to calculate respiratory rate and estimate TV and VE. Data were detrended to remove artifact, and TV was obtained as peak to trough volume per breath. VE was determined by averaging TV over 1 minute and multiplying by respiratory rate.
Data Analysis
All data were continuously sampled at 200 Hz, converted with an analog‐to‐digital converter (DI‐720 DataQ Ind, Milwaukee, WI), connected to a personal computer, and analyzed offline.
Baseline data were recorded for 10 minutes before upright tilt. The first minute of tilt after a prolonged supine rest often includes a period of hemodynamic instability known as “initial orthostatic hypotension” (IOH),28 caused by the translocation of blood from the upper body to the lower body while a lag in compensatory adrenergic vasoconstriction allows a decrease in CBV and BP and a concomitant increase in HR. For that reason, the first minute of tilt is often not used for analysis. However, our prior data showed that this time period may be critical to initiating hypocapnic hyperpnea.15 Therefore, we retained all early physiological measurements following tilt, and graphically displayed the nadir for BP, CO, and CBV and the zenith for HR and SVR during this early tilt epoch, which is designated as “initial.” Thereafter, upright measurements were divided into 5 additional stages of “early” (2–4 minutes), “middle” (4–6 minutes), “late” (6–8 minutes), “end” (8–10 minutes), and “CO2.” Only hyperventilating patients with POTS received CO2, and this additional epoch denoted CO2 is included in the graphic results. Data were time averaged during these time periods.
We defined 3 groups of POTS on the basis of a priori criteria: (1) decreased CO without hyperventilation (designated “POTS‐↓CO”), defined by CO <4 L/min; (2) normal CO without hyperventilation (designated “POTS–normal CO”), defined by CO >4 L/min; and (3) hyperventilation (designated “POTS‐hyperventilation”). All POTS‐hyperventilation had supine CO >4 L/min at rest.
Data Presentation and Statistical Analysis
There were 3 POTS groups and 1 control group or 4 groups in all.
Graphic data are predominantly shown as percentage of baseline expressed as mean±SEM. Thus, we are showing percentage changes from baseline over time as a result of the imposed orthostatic challenge, head‐up tilt. Data were obtained from original time series averaged over 15‐second intervals centered at the time markers. Data were collected and analyzed by the same investigator throughout.
To assess the magnitude of difference in the heights and weights of the 3 study groups, we computed ω2. ω2 Can be interpreted as the proportion of the total variance that is associated with the study groups. Values around 0.01 indicate small differences among the study groups, whereas values ≥0.10 indicate large group differences.
We used repeated‐measures ANOVA to compare study groups on outcomes over time intervals. To address our hypotheses, we were interested in how the study groups differed in outcome measures over time during the tilt. As such, we focused on the “group×time interaction” in the repeated‐measures ANOVA. We assumed a covariance structure of compound symmetry. Reported P values reflect the interaction term using the Greenhouse‐Geisser correction. To control for multiple comparisons, pairwise comparisons among groups following a significant omnibus repeated‐measures ANOVA test were conducted using Scheffe's test. Statistical significance was set at P≤0.05. Results were calculated by using GraphPad Prism, version 4.0. All tabular results are reported as mean±SEM.
Results
There were 12 patients with POTS‐↓CO, 32 patients with POTS–normal CO, 14 patients with POTS‐ hyperventilation and 16 healthy control subjects. For the patient groups, height was 162±4, 168±4, 166±3 cm, respectively, and weight was 58±2, 60±2, and 61±4 kg, respectively. Height was 169±3 cm and weight was 67±2 kg for control subjects. There were no differences in these parameters, either within or between groups. In addition, the ω2 values for height and weight represent small effect sizes, indicating little difference in height and weight among the 3 study groups.
Supine Baseline Data
Baseline supine data for BP, HR, CO, SVR, CBFv, VE, and ETCO2 are shown in the Table. There was no significant difference in MAP, ETCO2, or mean CBFv between subjects with POTS and control subjects. Systolic BP was decreased compared with control in POTS‐↓CO, whereas diastolic BP was increased in POTS–normal CO. There was a significantly higher supine HR and SVR, and lower supine CO and pulse pressure, in POTS‐↓CO compared with control subjects (P<0.05). Oxygen saturation was always >96%.
Table 1.
Supine Hemodynamic and Neurocardiopulmonary Data
| Variable | Control Group (n=16) | POTS‐↓CO Group (n=12) | POTS–Normal CO Group (n=32) | POTS‐Hyperventilation Group (n=14) |
|---|---|---|---|---|
| Heart rate, bpm | 64±3 | 83±5a | 74±5 | 74±5 |
| Systolic BP, mm Hg | 115±3 | 103±2a | 114±3 | 118±5 |
| Diastolic BP, mm Hg | 60±2 | 63±4 | 68±2a | 62±2 |
| MAP, mm Hg | 79±4 | 77±4 | 81±4 | 81±3 |
| Pulse pressure, mm Hg | 54±3 | 42±4a | 47±3 | 56±4 |
| Respiratory rate, breaths/min | 14±1 | 15±1 | 14±1 | 15±1 |
| VE, L/min | 6.8±0.7 | 7.4±0.7 | 6.7±0.7 | 7.9±0.9 |
| Tidal volume, L | 0.49±0.03 | 0.50±0.08 | 0.51±0.05 | 0.54±0.04 |
| ETCO2, Torr | 41.4±0.6 | 40.2±0.8 | 41.9±0.5 | 39.4±1.2 |
| Cardiac output, L/min | 5.7±0.4 | 3.4±0.2a | 5.8±0.4 | 5.6±0.7 |
| SVR, mm Hg/L per min | 16.3±1.5 | 21.6±1.5a | 15.1±1.0 | 15.6±1.4 |
| Mean CBFv, cm/s | 72±3 | 73±6 | 75±3 | 79±4 |
Data are given as mean±SEM. The 3 groups were as follows: (1) POTS‐↓CO, decreased CO without hyperventilation, defined by CO <4 L/min; (2) POTS–normal CO, normal CO without hyperventilation, defined by CO >4 L/min; and (3) POTS‐hyperventilation, hyperventilation. BP indicates blood pressure; bpm, beats per minute; CBFv, cerebral blood flow velocity; CO, cardiac output; ETCO2, end tidal CO2; MAP, mean arterial pressure; POTS, postural tachycardia syndrome; SVR, systemic vascular resistance; VE, minute ventilation.
Different from control, P<0.05.
Upright Tilt Data
Respiratory responses and CBFv
Respiratory data for all subjects are shown in Figure 1. Oxygen saturation was always >96%. After tilt, increased TV accounted for much of the VE increase (P<0.001) in POTS‐hyperventilation because there was a relatively small nonsignificant increase in respiratory rate. ETCO2 decreased inversely to the VE increase for patients with POTS‐hyperventilation (P<0.0001), and CBFv decreased in parallel (P<0.0001), as expected. There were no differences in the parameters shown comparing the other POTS groups with controls. Maximum ventilation in subjects with POTS was achieved 2 to 4 minutes after head‐up tilt and was maintained throughout tilt. Administration of supplemental CO2, shown as CO2, to achieve approximate eucapnia normalized CBFv and significantly decreased VE and TV (P<0.025), returning them to near‐control levels.
Figure 1.
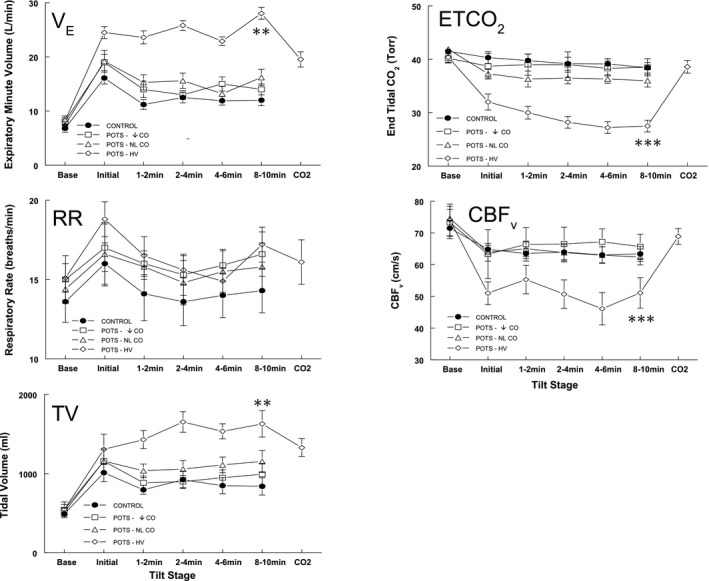
Respiratory data and cerebral blood flow velocity (CBFv) for all subjects. Respiratory rate (RR) contributes to the initial surge in expiratory minute volume (VE); increased tidal volume (TV) accounts for the remainder of the VE increase in the postural tachycardia syndrome–hyperventilation (POTS‐HV) group. End tidal CO 2 (ETCO 2) decreased inversely to VE for patients with POTS‐HV , whereas CBFv decreased in parallel, as expected. CBFv decreased significantly for POTS‐HV. Administration of supplemental CO 2 to achieve approximate eucapnia normalized CBFv and improved VE and TV. POTS‐↓cardiac output (CO) indicates decreased CO without hyperventilation, defined by CO <4 L/min; and POTS–normal (NL) CO, NL CO without hyperventilation, defined by CO >4 L/min. **P<0.001, ***P<0.0001.
Hemodynamic responses to tilt
Figure 2 shows data averaged over all groups for HR, CO, MAP, and SVR. After tilt, but before the delivery of CO2, HR was significantly increased for all POTS groups compared with controls (P<0.0001). After tilt, CO was also decreased compared with controls (P<0.001) and was significantly lower in POTS‐↓CO compared with other patients with POTS (P<0.025). Upright CO decreased in every patient with POTS. SVR was similarly increased compared with control for all POTS. MAP was only increased during tilt in POTS‐hyperventilation compared with control (P<0.025). SVR was increased in every patient with POTS. After administration of supplemental CO2 to patients with POTS‐hyperventilation, HR, CO, MAP, and SVR were no longer different from control.
Figure 2.
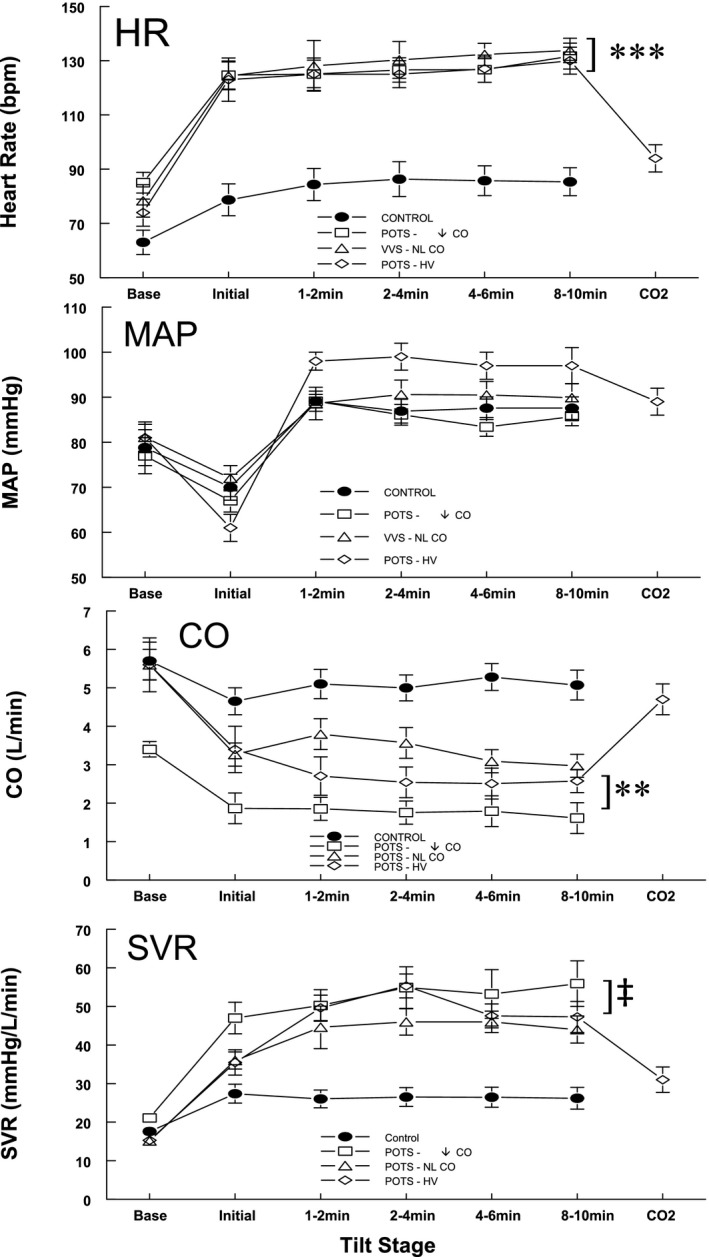
Data averaged over all groups for heart rate (HR), cardiac output (CO), mean arterial pressure (MAP), and systemic vascular resistance (SVR). Before the delivery of CO 2, HR was significantly increased for all postural tachycardia syndrome (POTS) groups compared with controls. CO was decreased compared with controls and was significantly lower in patients with POTS‐↓CO (decreased CO without hyperventilation) compared with other patients with POTS. Upright CO decreased significantly and SVR increased significantly in all POTS groups compared with controls. MAP increased during tilt in the POTS‐hyperventilation (HV) group compared with control. After administration of supplemental CO 2 to patients with POTS‐HV, HR, CO, MAP, and SVR were no longer different from control. NL indicates normal; **P<0.001, ***P<0.0001, ‡ P<0.025.
Regional blood volume responses to tilt
Figure 3 shows regional blood volume data, obtained by impedance plethysmography, averaged over each POTS group and control subjects. The percentage change of central blood volume was reduced for all patients with POTS while upright (P<0.001). There was an initial upswing in splanchnic blood volume in POTS‐hyperventilation and a less easily discerned reciprocal change in CBV. Splanchnic blood volume exceeded control in all POTS (P<0.01), whereas an increase in pelvic volume in POTS did not reach significance. Calf volume was significantly larger than control for POTS–normal CO and POTS‐hyperventilation, but not for POTS‐↓CO (P<0.001). After administration of supplemental CO2, CBV, splanchnic, pelvic, and calf blood volumes were similar in subjects with POTS‐hyperventilation and control subjects.
Figure 3.
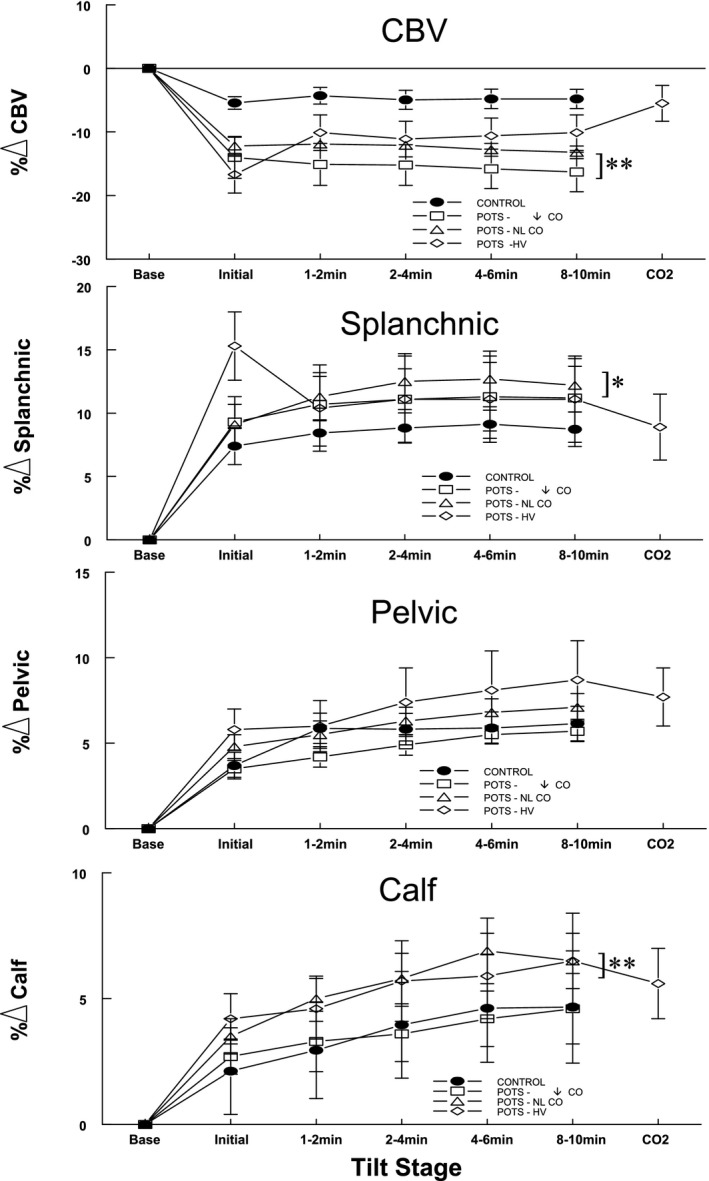
Regional blood volume data averaged over all groups for subjects with postural tachycardia syndrome (POTS) and control subjects. The percentage change of central blood volume was reduced for all POTS groups before administering CO 2. Splanchnic blood volume in POTS‐hyperventilation (HV) increased, whereas central blood volume (CBV) reciprocally decreased, during the initial period. Splanchnic blood volume in all POTS groups exceeded control. Increased pelvic volume in POTS groups did not reach significance, although calf volume was significantly larger than control for POTS–normal CO (POTS‐NL CO) and POTS‐HV, but not for POTS‐↓CO (decreased CO without hyperventilation). After administration of supplemental CO 2, central and regional blood volumes became similar in subjects with POTS‐HV and control subjects. *P<0.01, **P<0.001.
Figure 4 shows a representative tracing from a patient with POTS‐hyperventilation. Beat‐to‐beat changes in AP, HR, CO, VE, ETCO2, and CBFv are shown before and after administration of supplemental CO2. This patient exhibited a slight decrease in AP, a decrease in HR and VE, and an increase in CO, ETCO2, and CBFv after CO2. Orthostatic symptoms reported during these measurements improved after CO2.
Figure 4.
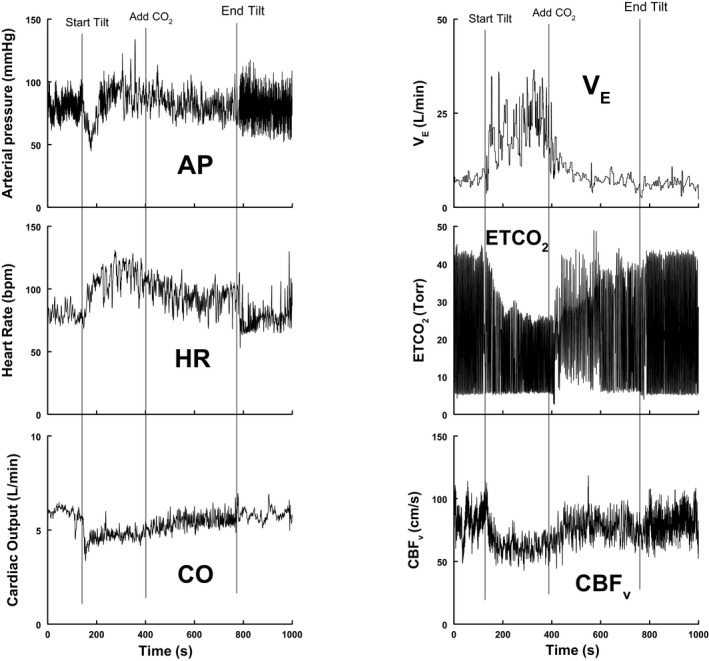
Representative tracing from a patient with postural tachycardia syndrome (POTS)–hyperventilation. Beat‐to‐beat changes in arterial pressure (AP), heart rate (HR), cardiac output (CO), expiratory minute volume (VE), end tidal carbon dioxide (ETCO 2), and cerebral blood flow velocity (CBFv) are shown before and after administration of supplemental CO 2. The figure suggests a small decrease in AP, a decrease in HR and VE, and increases in CO, ETCO 2, and CBFv after CO 2 is administered. After CO 2, the patient no longer fulfills HR criteria for POTS. Orthostatic symptoms improved, although VE remained somewhat elevated.
Discussion
Our major findings are as follows: CO is reduced and SVR is increased without postural hypotension in POTS when upright, compared with healthy volunteer control subjects. Reduced CBV and increased SVR contribute to reduced CO in POTS. A subset of patients with POTS also have reduced CO, increased HR, and increased SVR when supine, corresponding to the putative effects of increased central nervous system sympathetic outflow characterizing the “hyperadrenergic POTS” variant.29 Another subset of patients with POTS, designated POTS‐hyperventilation, have hyperventilation in the form of hypocapnic hyperpnea, with reduced CBFv, consequent lightheadedness, and increased BP. Patients with POTS‐hyperventilation comprise ≈25% of our enrolled patients. Hyperventilation appears to be driven by early enhanced decreases in CO, BP, and CBV. Postural hyperventilation drives excessive upright tachycardia, causing POTS. Hemodynamic deficits of patients with POTS‐hyperventilation compared with control are corrected by supplemental CO2. Arguably, this represents a separate syndrome in which the primary finding is upright hypocapnic hyperpnea, which secondarily results in excessive tachycardia.17
POTS Is Characterized by Decreased CO and Increased SVR When Upright
Decreased upright CO in POTS has been reported by our group and by others,27, 30, 31 and is associated with increased SVR,27, 31 consistent with sustained BP and marked reduction in upright stroke volume.32 However, a subset of POTS may have increased CO during exercise.33 In some respects, decreased CO and increased SVR resemble observations made in deconditioned individuals; indeed, exercise reconditioning can improve cardiovascular findings in POTS.34 Some investigators, however, have reported the simultaneous reduction of SVR and CO.30 However, these changes would result in hypotension, which, by definition, does not occur in POTS.
Upright Central Blood Volume Is Reduced in POTS
Supine CBV is reduced in some patients with POTS.31, 34, 35, 36 This is striking in those patients with evidence for increased supine sympathoexcitation.37 Prior evidence and current data support the excessive reduction in CBV in all patients with POTS when upright,32 reducing cardiac preload and, thus, CO. Central hypovolemia results primarily from sequestration of blood within the splanchnic vasculature and, to a lesser extent, within the lower extremities. Reduced CBV causes reflex‐mediated tachycardia,38 further potentiated by excessive sympathetic outflow in those with hyperadrenergic POTS.
Hyperventilation (Hypocapnic Hyperpnea) Produces POTS, a Postural Hyperventilation Syndrome
Hyperventilation syndrome may have fallen out of favor as a stand‐alone diagnosis. However, in the past, it had been largely attributed to psychological factors when it occurred in the absence of cardiac, respiratory, or well‐defined central nervous system disorders.39 Hyperventilation accounted, in large measure, for the so‐called “effort syndrome” of World War I,21 which was effectively treated by breathing CO2 mixtures or by CO2 rebreathing.22
Postural hyperventilation has been reported once before our work,40 and its physiological cause was minimized while psychological causes remained paramount.41 The relationship of hyperventilation to orthostasis has been revived by recent reports from our laboratory14, 15 and a report from the Mayo autonomic group,17 contemporary with the definition of POTS.3 More recently, “hyperventilation syndrome” (but not “postural hyperventilation”) has been subsumed under the aegis of “dysfunctional breathing” treated with variable success by breathing retraining.42
Consequences of Hyperventilation (Hypocapnic Hyperpnea)
The effects of uncontrolled spontaneous hyperventilation are primarily the result of hypocapnia causing respiratory alkalosis19; these effects substantially resolve when CO2 is normalized.8, 43 Because CO2 is lipid soluble, alkalotic changes distribute across cell membranes and the blood‐brain barrier. Hypocapnia can cause tissue ischemia by decreasing the local oxygen supply and increasing oxygen demand. There is a leftward shift of the oxyhemoglobin dissociation curve, the Bohr effect,44 and decreased release of oxygen at the tissue level. Hypocapnia reduces cerebral blood flow while increasing cerebral oxygen demand, and cerebral ischemia with reduced psychomotor function can result.45 Acute hypocapnia also decreases myocardial oxygen delivery while increasing cardiac oxygen demand46 via increases in myocardial contractility and SVR. Gastrointestinal peristalsis is diminished, which may contribute to the high incidence of gastrointestinal symptoms reported by patients.47
Tachycardia in Hyperventilation
Three factors contribute to tachycardia during hyperventilation48: the first and least consequential depends on lung inflation reflexes. Next in potency are the effects of cerebral ischemia on the central medullary chemoreflexes and on central inspiratory neurons.49 Third are direct actions of hypocapnia on the sinoatrial node.48
Onset of Postural Hyperventilation Coincides With Marked Decrease of CO, CBV, and CBF During Initial Tilt: Importance of IOH and Stagnant Hypoxia
Changing from supine to standing transfers >500 mL of CBV caudally, transiently decreasing CBV and increasing blood within the splanchnic vasculature and lower extremities.18, 28, 50 There is a period of IOH28 during which BP, CO, and CBF transiently decrease because of the time lag in the onset of sympathetic compensation. BP reaches its nadir 10 to 20 seconds after standing.51 Reflex tachycardia peaks a little later, but BP and HR are usually restored within 30 to 60 seconds. Thereafter, upright HR slows but remains elevated compared with supine; CBFv recovers to somewhat less than supine,52 and BP is restored with a slightly higher MAP but reduced pulse pressure. The ventilatory response to head‐up tilt is depicted in Figure 1.
IOH is larger in our patients with hyperventilation compared with all other subjects, demonstrated by the exaggerated decrease in CBFv that coincides with a larger transient decrease in CO and central blood volume compared with control and other patients with POTS before BP restitution. Reduced CBFv is immediately followed by hyperpnea and hypocapnia. Hypocapnia perpetuates the reduced CBFv.43 Severely reduced CBF increases brain‐wide vasoconstriction and hypoxia‐ischemia via the Bohr effect,44 resulting in increased cerebral oxygen demand, neuronal excitability, and continued sympathetic stimulation.19
Our study suggests that postural hyperventilation is not a compensatory mechanism for POTS; rather, it causes POTS. The respiratory pump (increased intra‐abdominal and decreased intrathoracic pressures) does not improve CO in subjects with POTS14 because reduced blood volume and extrathoracic pooling of blood severely hamper venous return. On the contrary, if hyperpnea occurs at high operating lung volumes,53 thoracic blood volume may be even further reduced.54
What Causes the Exaggerated Decrease in CBFv?
Rapidly decreased AP and CO during IOH drives decreased CBF.55, 56 Central blood volume and AP modulate cerebral autoregulation.57 Central blood volume is also linked by baroreflexes to cerebrovascular regulation via the extrinsic (extracerebral) vascular innervation system. Excessive baroreflex unloading causes parasympathetic withdrawal and reduction of NO‐dependent tonic dilation of the extrinsic cerebral vasculature that counteracts cerebral vasoconstriction. Our work supports the ability of this extrinsic vasculature to respond well to NO in humans.58 Thus, the exaggerated initial decrease in CBFv may be directly caused by the initial decrease in BP, CO, and CBV of IOH and indirectly by reflex loss of NO‐dependent dilation of the extracerebral brain vasculature because of parasympathetic withdrawal. CBF derives largely from carotid artery blood flow. A reduction in CBF implies a reduction in carotid artery and carotid body blood flows, increasing the chemoreflex sensitivity to hypoxia.59 The carotid body is primarily responsible for sensing “stagnant ischemia” or “ischemic hypoxia” in conditions of reduced CBV and CO.12 We have previously shown markedly increased sympathetic nerve activity in these patients.15 We propose that chemoreflex‐mediated sympathoexcitation contributes importantly to vasoconstriction and increased BP while further restricting CO in these patients.
Limitations
Transcranial Doppler only measures blood flow through specific cerebral blood vessels. The middle cerebral artery was used because it is the main vessel that perfuses the area of the brain activated during executive memory testing. Perfusion during orthostatic stress may vary with brain location, but such variations are often small.60 We did not measure transcranial Doppler in both hemispheres because previous work showed that middle cerebral artery CBFv was not different between the hemispheres during orthostatic stress.61
The Finometer yields relative measures of CO. Although we standardized supine CO against inert gas rebreathing CO, standardization was not performed during the tilt because the technique requires deep breathing, which would alter hemodynamics.
Impedance plethysmography cannot distinguish blood pooling among the different thoracic organs (lung and heart) or among the splanchnic organs (eg, liver versus mesenteric). Although the technique measures fractional change in regional blood volumes, these have been validated against reference standards in prior studies.
This is a technique with superior temporal resolution but imperfect accuracy, which, within limits, has been shown to be sufficient and satisfactory to compare directional changes and relative magnitudes of changes in regional blood flow and blood volume among patients and volunteer control subjects undergoing similar testing. We did not measure absolute total blood volume or absolute central blood volume while supine. However, we have shown in previous experiments that these quantities are absolutely reduced for patients with POTS with reduced resting CO.27
Sources of Funding
Funding for this project was provided by the following National Institutes of Health sources: RO1 HL 134674 and RO1 HL 112736 from the National Heart, Lung, and Blood Institute; and R21 NS 094644 from the National Institute of Neurological Disorders and Stroke.
Disclosures
None.
(J Am Heart Assoc. 2018;7:e008854 DOI: 10.1161/JAHA.118.008854.)
References
- 1. Robertson D. The epidemic of orthostatic tachycardia and orthostatic intolerance. Am J Med Sci. 1999;317:75–77. [DOI] [PubMed] [Google Scholar]
- 2. Stewart JM. Common syndromes of orthostatic intolerance. Pediatrics. 2013;131:968–980. [DOI] [PMC free article] [PubMed] [Google Scholar]
- 3. Schondorf R, Low PA. Idiopathic postural orthostatic tachycardia syndrome: an attenuated form of acute pandysautonomia? Neurology. 1993;43:132–137. [DOI] [PubMed] [Google Scholar]
- 4. Low PA, Opfer‐Gehrking TL, Textor SC, Benarroch EE, Shen WK, Schondorf R, Suarez GA, Rummans TA. Postural tachycardia syndrome (POTS). Neurology. 1995;45:S19–S25. [PubMed] [Google Scholar]
- 5. Jacob G, Shannon JR, Black B, Biaggioni I, Mosqueda‐Garcia R, Robertson RM, Robertson D. Effects of volume loading and pressor agents in idiopathic orthostatic tachycardia. Circulation. 1997;96:575–580. [DOI] [PubMed] [Google Scholar]
- 6. Taneja I, Medow MS, Clarke DA, Ocon AJ, Stewart JM. Baroreceptor unloading in postural tachycardia syndrome augments peripheral chemoreceptor sensitivity and decreases central chemoreceptor sensitivity. Am J Physiol Heart Circ Physiol. 2011;301:H173–H179. [DOI] [PMC free article] [PubMed] [Google Scholar]
- 7. Lagi A, Cencetti S, Corsoni V, Georgiadis D, Bacalli S. Cerebral vasoconstriction in vasovagal syncope: any link with symptoms? A transcranial Doppler study. Circulation. 2001;104:2694–2698. [DOI] [PubMed] [Google Scholar]
- 8. Burnum JF, Hickam JB, McIntosh HD. The effect of hypocapnia on arterial blood pressure. Circulation. 1954;9:89–95. [DOI] [PubMed] [Google Scholar]
- 9. Janeway HH, Ewing EM. The nature of shock: its relation to acapnia and to changes in the circulation of the blood and to exhaustion of the nerve centres. Ann Surg. 1914;59:158–175. [DOI] [PMC free article] [PubMed] [Google Scholar]
- 10. Convertino VA, Rickards CA, Lurie KG, Ryan KL. Hyperventilation in response to progressive reduction in central blood volume to near syncope. Aviat Space Environ Med. 2009;80:1012–1017. [DOI] [PubMed] [Google Scholar]
- 11. Lelorier P, Klein GJ, Krahn A, Yee R, Skanes A, Shoemaker JK. Combined head‐up tilt and lower body negative pressure as an experimental model of orthostatic syncope. J Cardiovasc Electrophysiol. 2003;14:920–924. [DOI] [PubMed] [Google Scholar]
- 12. Dempsey JA, Smith CA. Pathophysiology of human ventilatory control. Eur Respir J. 2014;44:495–512. [DOI] [PMC free article] [PubMed] [Google Scholar]
- 13. Potter EK, McCloskey DI. Excitation of carotid body chemoreceptors by neuropeptide‐Y. Respir Physiol. 1987;67:357–365. [DOI] [PubMed] [Google Scholar]
- 14. Stewart JM, Medow MS, Cherniack NS, Natelson BH. Postural hypocapnic hyperventilation is associated with enhanced peripheral vasoconstriction in postural tachycardia syndrome with normal supine blood flow. Am J Physiol Heart Circ Physiol. 2006;291:H904–H913. [DOI] [PMC free article] [PubMed] [Google Scholar]
- 15. Del Pozzi AT, Schwartz CE, Tewari D, Medow MS, Stewart JM. Reduced cerebral blood flow with orthostasis precedes hypocapnic hyperpnea, sympathetic activation, and postural tachycardia syndrome. Hypertension. 2014;63:1302–1308. [DOI] [PMC free article] [PubMed] [Google Scholar]
- 16. Tani H, Singer W, McPhee BR, Opfer‐Gehrking TL, Haruma K, Kajiyama G, Low PA. Splanchnic‐mesenteric capacitance bed in the postural tachycardia syndrome (POTS). Auton Neurosci. 2000;86:107–113. [DOI] [PubMed] [Google Scholar]
- 17. Novak V, Spies JM, Novak P, McPhee BR, Rummans TA, Low PA. Hypocapnia and cerebral hypoperfusion in orthostatic intolerance. Stroke. 1998;29:1876–1881. [DOI] [PubMed] [Google Scholar]
- 18. Stewart JM, Medow MS, Messer ZR, Baugham IL, Terilli C, Ocon AJ. Postural neurocognitive and neuronal activated cerebral blood flow deficits in young chronic fatigue syndrome patients with postural tachycardia syndrome. Am J Physiol Heart Circ Physiol. 2012;302:H1185–H1194. [DOI] [PMC free article] [PubMed] [Google Scholar]
- 19. Laffey JG, Kavanagh BP. Hypocapnia. N Engl J Med. 2002;347:43–53. [DOI] [PubMed] [Google Scholar]
- 20. Swanson GD, Bellville JW. Step changes in end‐tidal CO2: methods and implications. J Appl Physiol. 1975;39:377–385. [DOI] [PubMed] [Google Scholar]
- 21. Soley MH, Shock NW. The etiology of effort syndrome. Am J Med Sci. 1938;196:840–850. [Google Scholar]
- 22. Guttmann E, Jones M. Hyperventilation and the effort syndrome. Br Med J. 1940;2:736–739. [DOI] [PMC free article] [PubMed] [Google Scholar]
- 23. Singer W, Sletten DM, Opfer‐Gehrking TL, Brands CK, Fischer PR, Low PA. Postural tachycardia in children and adolescents: what is abnormal? J Pediatr. 2011;160:222–226. [DOI] [PMC free article] [PubMed] [Google Scholar]
- 24. Raj SR. The postural tachycardia syndrome (POTS): pathophysiology, diagnosis & management. Indian Pacing Electrophysiol J. 2006;6:84–99. [PMC free article] [PubMed] [Google Scholar]
- 25. Medow MS, Stewart JM. The postural tachycardia syndrome. Cardiol Rev. 2007;15:67–75. [DOI] [PubMed] [Google Scholar]
- 26. Dyson KS, Shoemaker JK, Arbeille P, Hughson RL. Modelflow estimates of cardiac output compared with Doppler ultrasound during acute changes in vascular resistance in women. Exp Physiol. 2010;95:561–568. [DOI] [PubMed] [Google Scholar]
- 27. Stewart JM, Medow MS, Glover JL, Montgomery LD. Persistent splanchnic hyperemia during upright tilt in postural tachycardia syndrome. Am J Physiol Heart Circ Physiol. 2006;290:H665–H673. [DOI] [PMC free article] [PubMed] [Google Scholar]
- 28. Wieling W, Krediet CT, van Dijk N, Linzer M, Tschakovsky ME. Initial orthostatic hypotension: review of a forgotten condition. Clin Sci (Lond). 2007;112:157–165. [DOI] [PubMed] [Google Scholar]
- 29. Okamoto LE, Garland EM, Sato K, Diedrich L, Furlan R, Jacob G, Robertson D, Biaggioni I, Diedrich A. Microneurographic evidence of primary hyperadrenergic POTS. American Autonomic Society Annual Meeting. 2017. Clearwater Beach, Florida, USA November 1–4.
- 30. Li H, Han Z, Chen S, Liao Y, Wang Y, Liu P, Chen Y, Tang C, Lin J, Du J, Jin H. Total peripheral vascular resistance, cardiac output, and plasma C‐type natriuretic peptide level in children with postural tachycardia syndrome. J Pediatr. 2015;166:1385–1389. [DOI] [PubMed] [Google Scholar]
- 31. Fu Q, Vangundy TB, Galbreath MM, Shibata S, Jain M, Hastings JL, Bhella PS, Levine BD. Cardiac origins of the postural orthostatic tachycardia syndrome. J Am Coll Cardiol. 2010;55:2858–2868. [DOI] [PMC free article] [PubMed] [Google Scholar]
- 32. Low PA, Opfer‐Gehrking TL, Textor SC, Schondorf R, Suarez GA, Fealey RD, Camilleri M. Comparison of the postural tachycardia syndrome (POTS) with orthostatic hypotension due to autonomic failure. J Auton Nerv Syst. 1994;50:181–188. [DOI] [PubMed] [Google Scholar]
- 33. Pianosi PT, Goodloe AH, Soma D, Parker KO, Brands CK, Fischer PR. High flow variant postural orthostatic tachycardia syndrome amplifies the cardiac output response to exercise in adolescents. Physiol Rep. 2014;2:e12122. [DOI] [PMC free article] [PubMed] [Google Scholar]
- 34. Shibata S, Fu Q, Bivens TB, Hastings JL, Wang W, Levine BD. Short‐term exercise training improves the cardiovascular response to exercise in the postural orthostatic tachycardia syndrome. J Physiol. 2012;590:3495–3505. [DOI] [PMC free article] [PubMed] [Google Scholar]
- 35. Stewart JM, Glover JL, Medow MS. Increased plasma angiotensin II in postural tachycardia syndrome (POTS) is related to reduced blood flow and blood volume. Clin Sci (Lond). 2006;110:255–263. [DOI] [PMC free article] [PubMed] [Google Scholar]
- 36. Raj SR, Biaggioni I, Yamhure PC, Black BK, Paranjape SY, Byrne DW, Robertson D. Renin‐aldosterone paradox and perturbed blood volume regulation underlying postural tachycardia syndrome. Circulation. 2005;111:1574–1582. [DOI] [PubMed] [Google Scholar]
- 37. Benarroch EE. Postural tachycardia syndrome: a heterogeneous and multifactorial disorder. Mayo Clin Proc. 2012;87:1214–1225. [DOI] [PMC free article] [PubMed] [Google Scholar]
- 38. Cooke WH, Hoag JB, Crossman AA, Kuusela TA, Tahvanainen KU, Eckberg DL. Human responses to upright tilt: a window on central autonomic integration. J Physiol. 1999;517:617–628. [DOI] [PMC free article] [PubMed] [Google Scholar]
- 39. Gardner WN. The pathophysiology of hyperventilation disorders. Chest. 1996;109:516–534. [DOI] [PubMed] [Google Scholar]
- 40. Malmberg LP, Tamminen K, Sovijarvi AR. Orthostatic increase of respiratory gas exchange in hyperventilation syndrome. Thorax. 2000;55:295–301. [DOI] [PMC free article] [PubMed] [Google Scholar]
- 41. Gardner W. Orthostatic increase of respiratory gas exchange in hyperventilation syndrome. Thorax. 2000;55:257–259. [DOI] [PMC free article] [PubMed] [Google Scholar]
- 42. Barker N, Everard ML. Getting to grips with “dysfunctional breathing.” Paediatr Respir Rev. 2015;16:53–61. [DOI] [PubMed] [Google Scholar]
- 43. Thijs RD, van den Aardweg JG, Reijntjes RH, van Dijk JG, van Lieshout JJ. Contrasting effects of isocapnic and hypocapnic hyperventilation on orthostatic circulatory control. J Appl Physiol (1985). 2008;105:1069–1075. [DOI] [PubMed] [Google Scholar]
- 44. Riggs AF. The Bohr effect. Annu Rev Physiol. 1988;50:181–204. [DOI] [PubMed] [Google Scholar]
- 45. Kety SS, Schmidt CF. The effects of active and passive hyperventilation on cerebral blood flow, cerebral oxygen consumption, cardiac output, and blood pressure of normal young men. J Clin Invest. 1946;25:107–119. [PubMed] [Google Scholar]
- 46. Crystal GJ. Carbon dioxide and the heart: physiology and clinical implications. Anesth Analg. 2015;121:610–623. [DOI] [PubMed] [Google Scholar]
- 47. Mittal RK, Parollisi S, Shaffer HA, Baggett L. Influence of breathing pattern on the esophagogastric junction pressure and esophageal transit. Am J Physiol. 1995;269:G577–G583. [DOI] [PubMed] [Google Scholar]
- 48. Marshall JM. Peripheral chemoreceptors and cardiovascular regulation. Physiol Rev. 1994;74:543–594. [DOI] [PubMed] [Google Scholar]
- 49. de Burgh Daly M, Korner PL, Angell‐James JE, Oliver JA. Cardiovascular and respiratory effects of carotid body stimulation in the monkey. Clin Exp Pharmacol Physiol. 1978;5:511–524. [DOI] [PubMed] [Google Scholar]
- 50. Sheriff DD, Nadland IH, Toska K. Hemodynamic consequences of rapid changes in posture in humans. J Appl Physiol. 2007;103:452–458. [DOI] [PubMed] [Google Scholar]
- 51. Thomas KN, Cotter JD, Galvin SD, Williams MJ, Willie CK, Ainslie PN. Initial orthostatic hypotension is unrelated to orthostatic tolerance in healthy young subjects. J Appl Physiol. 2009;107:506–517. [DOI] [PubMed] [Google Scholar]
- 52. Levine BD, Giller CA, Lane LD, Buckey JC, Blomqvist CG. Cerebral versus systemic hemodynamics during graded orthostatic stress in humans. Circulation. 1994;90:298–306. [DOI] [PubMed] [Google Scholar]
- 53. Boulding R, Stacey R, Niven R, Fowler SJ. Dysfunctional breathing: a review of the literature and proposal for classification. Eur Respir Rev. 2016;25:287–294. [DOI] [PMC free article] [PubMed] [Google Scholar]
- 54. Mijacika T, Kyhl K, Frestad D, Otto BF, Drvis I, Secher NH, Dujic Z, Lav MP. Effect of pulmonary hyperinflation on central blood volume: an MRI study. Respir Physiol Neurobiol. 2017;243:92–96. [DOI] [PubMed] [Google Scholar]
- 55. Zhang R, Zuckerman JH, Levine BD. Deterioration of cerebral autoregulation during orthostatic stress: insights from the frequency domain. J Appl Physiol (1985). 1998;85:1113–1122. [DOI] [PubMed] [Google Scholar]
- 56. Ogoh S, Brothers RM, Barnes Q, Eubank WL, Hawkins MN, Purkayastha S, Yurvati A, Raven PB. The effect of changes in cardiac output on middle cerebral artery mean blood velocity at rest and during exercise. J Physiol. 2005;569:697–704. [DOI] [PMC free article] [PubMed] [Google Scholar]
- 57. van Lieshout JJ, Wieling W, Karemaker JM, Secher NH. Syncope, cerebral perfusion, and oxygenation. J Appl Physiol. 2003;94:833–848. [DOI] [PubMed] [Google Scholar]
- 58. Stewart JM, Medow MS, DelPozzi A, Messer ZR, Terilli C, Schwartz CE. Middle cerebral O(2) delivery during the modified Oxford maneuver increases with sodium nitroprusside and decreases during phenylephrine. Am J Physiol Heart Circ Physiol. 2013;304:H1576–H1583. [DOI] [PMC free article] [PubMed] [Google Scholar]
- 59. Ding Y, Li YL, Schultz HD. Role of blood flow in carotid body chemoreflex function in heart failure. J Physiol. 2011;589:245–258. [DOI] [PMC free article] [PubMed] [Google Scholar]
- 60. Deegan BM, Cooke JP, Lyons D, Olaighin G, Serrador JM. Cerebral autoregulation in the vertebral and middle cerebral arteries during combine head upright tilt and lower body negative pressure in healthy humans. Conf Proc IEEE Eng Med Biol Soc. 2010;2010:2505–2508. [DOI] [PubMed] [Google Scholar]
- 61. Ocon AJ, Messer ZR, Medow MS, Stewart JM. Increasing orthostatic stress impairs neurocognitive functioning in chronic fatigue syndrome with postural tachycardia syndrome. Clin Sci (Lond). 2012;122:227–238. [DOI] [PMC free article] [PubMed] [Google Scholar]