

Abstract
Background
Estimation of the predissected descending aortic diameter is important for deciding on the size of a stent graft in cases of acute aortic dissection. However, no equations for estimating this diameter have been previously reported.
Methods and Results
We developed and validated new equations by investigating computed tomography images that were scanned within 3 years before dissection and those that were scanned immediately after the onset of dissection. Among 1127 patients with acute aortic dissection (425 type A and 702 type B), 36 were matched for the study from October 2005 to March 2017 at 4 centers. New equations were developed in 17 patients and validated in 19 patients. We measured the predissected whole circumference length (CL) and postdissected whole CL, true lumen CL, the major diameter, and the minor diameter of the acutely dissected aorta, followed by calculation of (post‐trueCL+post‐wholeCL)/2 and (post–major diameter+post—minor diameter)/2. Six equations (linear function) and modified equations were derived from each of the above‐mentioned parameters. In the derivation sets, equations that used the parameter of (post‐trueCL+post‐wholeCL)/2 were strongly correlated with pre‐wholeCL (Y=0.9433x+5.0147; R 2=0.9001) and showed significantly less bias compared with the other 5 equations (P<0.0001). In validation sets using this equation, the mean bias of the circumference length and diameter was 2.7±2.8 and 0.85±0.89 mm, respectively. A total of 99.2% of the calculated values were within 3 mm in diameter or less.
Conclusions
Our newly developed equations can be used to calculate the predissected aortic diameter in cases of acute aortic dissection and might help to decide the size of the stent graft.
Keywords: aortic dissection, descending aorta, stent‐graft
Subject Categories: Aortic Dissection
Clinical Perspective
What Is New?
In acute type B dissection there are an increasing number of patients undergoing endovascular treatment in complicated cases.
For endovascular treatment for this pathology, an appropriate selection of the size of a stent graft is important, and an understanding of the predissected aortic diameter might help to make a decision as to the size.
However, no reports have addressed the equations for estimating the predissected descending aortic diameter.
In the present study we developed a new equation by investigating computed tomography images that were scanned within 3 years before dissection and those that were scanned immediately after the onset of dissection.
What Are the Clinical Implications?
Our newly developed equation that can estimate the predissected descending aortic diameter, and the bias of over 95% of the calculated values was less than 3 mm in diameter, especially in regard to the average of the postdissected whole circumference length and the circumference length of true lumen.
This equation might be helpful in deciding on the size of stent graft deployed in the descending aorta as well as for investigating the factors affecting the genesis of acute aortic dissection.
Introduction
Acute aortic dissection (AAD) is a well‐known life‐threatening disorder.1 In acute type A dissection, open surgical repair is the gold standard. In type B dissection, there are increasing numbers of patients undergoing endovascular treatment in complicated cases. In these situations increasing numbers of reports have demonstrated the beneficial effects of stent graft (SG) use in dissected descending aortic lesions.2, 3 However, devastating complications, such as retrograde type A dissection or formation of a new tear around the edge of an SG, have also been reported.4, 5, 6 One of the main factors involved in such disastrous complications is the use of an oversized SG for this pathology.6 A guide for appropriate selection of the size of an SG is the predissected aortic diameter. However, no reports have addressed the equations for estimating the predissected descending aortic diameter. Therefore, in the present study we developed and validated a new equation by investigating computed tomography (CT) images that were scanned within 3 years before dissection and those that were scanned immediately after the onset of dissection.
Methods
The data will not be made available to the other researchers for purpose of reproducing the results or replicating the procedure.
Study Population
The study cohort is summarized in Figure 1. From October 2005 to March 2017, 1127 consecutive patients were diagnosed with AAD (425 type A, 702 type B) in 4 centers by CT angiography. Selection of the patients was based on the assumption that the aortic diameter within 3 years of the onset of acute dissection without evidence of aneurysmal formation is equal to that at the onset of dissection. Thirty‐six cases were matched for this study, and the other 1091 cases were excluded for the following reasons: 1075 (404 type A, 671 type B) cases lacked previous enhanced CT image scanning within 3 years from the onset of dissection; and 11 cases (3 type A, 8 type B) showed a predissected diameter of the descending aorta (whole circumference length [CL]/3.14) ≥35 mm, which was considered to show a greatly changed diameter between CT scanning and the onset of dissection. CT images of 5 cases (1 type A, 4 type B) showed poor image resolution or a severely destructive true lumen (TL), and it was difficult to measure an accurate value. Data collected from October 2005 to December 2011 (n=17) were used as a derivation set, and those from January 2012 to March 2017 (n=19) were used as a validation set. The characteristics of the cohort are shown in Table 1. This study was a retrospective study and was approved by our hospital institutional review board. Informed consent was waived by the institutional review board because of the retrospective nature of the study using records without patient identifiers.
Figure 1.

Study population. AAD indicates acute aortic dissection; CT, computed tomography.
Table 1.
Patients’ Characteristics
| Covariates | Derivation Group (n=17) | Validation Group (n=19) | P Value |
|---|---|---|---|
| Age | 71.8±14.1 | 73.1±9.7 | 0.7639 |
| Sex (male) | 9 (52.9%) | 9 (47.3%) | 0.9999 |
| BSA | 1.55±0.15 | 1.62±0.22 | 0.2749 |
| HT | 15 (88.2%) | 16 (84.2%) | 0.9999 |
| HL | 3 (17.6%) | 9 (47.3%) | 0.083 |
| DM | 2 (11.7%) | 5 (26.3%) | 0.408 |
| Serum creatine, mg/dL (except HD) | 0.66±0.18 | 0.90±0.31 | 0.489 |
| HD | 2 (11.7%) | 2 (10.5%) | 0.9999 |
| Marfan | 1 (5.9%) | 0 (0%) | 0.4722 |
| Dissection type | |||
| A | 8 (47.1%) | 8 (42.1%) | 0.9999 |
| B | 9 (52.9%) | 11 (57.8%) | |
| FL patent rate | 7 (41.1%) | 7 (36.8%) | 0.9999 |
| CT interval (M) | 9.8±11.1 | 13.7±13.4 | 0.0711 |
| CT reason | |||
| Malignancy f/u | 3 (17.6%) | 3 (15.7%) | 0.8214 |
| Aorta‐related f/u | 5 (29.4%) | 8 (42.1%) | |
| Infection | 2 (11.7%) | 1 (5.2%) | |
| Other | 7 (41.1%) | 7 (36.8%) | |
| No. of CT slices investigated | 104 | 120 | |
| Type of form: A | 31 (29.8%) | 30 (25.0%) | 0.0568 |
| Type of form: B | 54 (51.9%) | 79 (65.8%) | |
| Type of form: C | 19 (18.2%) | 11 (9.1%) | |
| Pre‐wCL, mm | 83.7±12.4 | 88.3±12.5 | 0.0059 |
| Post‐tCL, mm | 72.2±14.1 | 77.8±16.5 | 0.0063 |
| Post‐wCL, mm | 94.6±14.8 | 99.8±14.8 | 0.0075 |
| Post‐Dma, mm | 30.6±4.3 | 33.2±4.5 | <0.0001 |
| Post‐Dmi, mm | 29.1±4.0 | 31.2±4.5 | 0.0002 |
| (Post‐tCL±post‐wCL)/2, mm | 83.4±12.5 | 88.8±13.3 | 0.0016 |
| (Post‐Dma±post‐Dmi)/2, mm | 29.8±4.1 | 32.2±4.4 | <0.0001 |
BSA indicates body surface area; CT, computed tomography; DM, diabetes mellitus; FL, false lumen; f/u, follow‐up; HD, hemodialysis; HL, hyperlipidemia; HT, hypertension; post‐Dma, post‐dissected major axis of descending aorta; post‐Dmi, post‐dissected minor axis of descending aorta; post‐tCL, post‐dissected true lumen circumference length of descending aorta; post‐wCL, post‐dissected whole circumference length of descending aorta; pre‐wCL, pre‐dissected whole circumference length of descending aorta.
Imaging and Measurements
All CT studies were performed using a 64‐multidetector row CT system (Aquilion 64 or Aquilion 64 CXL; Toshiba Medical Systems, Otawara, Japan) with 1‐ to 5‐mm collimation from the neck to the femoral artery. The imaging study software that was used in the study was Ziostation 2 (Ziosoft, Inc, Tokyo, Japan). One skilled observer who was blinded to the patients’ identifying information and the aim of the present study measured each parameter. The following parameters of the predissected and postdissected descending aorta from T6 to T12 (on the top level of each vertebra) were measured from axial images and multiplanar reformatting. The whole predissected circumference length (pre–whole CL) and postdissected whole circumference length (post–whole CL), the postdissected true lumen circumference length (post–true CL), the postdissected major diameter (post‐Dma), and the postdissected minor diameter (post‐Dmi) of the acutely dissected aorta were measured. This was followed by calculation of (post–true CL+post–whole CL)/2 and (post‐Dma+post‐Dmi)/2 (Figure 2). The pre–whole CL was regarded as the whole CL immediately before onset of dissection. This diameter was measured by tracing the borderline between the enhanced area and the nonenhanced area. A total of 104 and 120 slices were investigated in the derivation and validation sets, respectively. For subgroup analysis, the morphology of the dissected TL was classified into 3 groups as follows: mild decompressed TL (form A: 61 slices), moderately decompressed TL (form B: 133 slices), and severely decompressed TL (form C: 30 slices) (Figure 3).
Figure 2.

Measurement values. Five parameters were measured: predissected whole circumference length (pre‐wCL), postdissected whole circumference length (post‐wCL), postdissected true lumen circumference length (post‐tCL), post–major diameter (post‐Dma), post–minor diameter (post‐Dmi). The average of post‐tCL and post‐wCL was calculated as well as that of post‐Dma and post‐Dmi.
Figure 3.
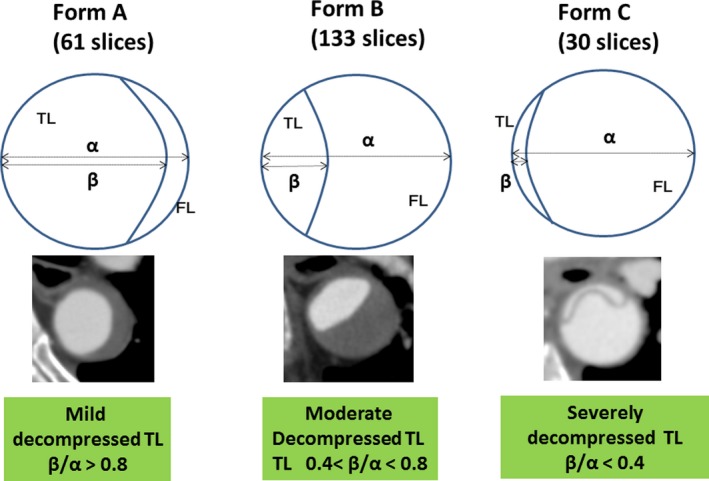
Classification of the shape of the true lumen. The morphology of the dissected TL was classified into 3 groups as follows: mildly decompressed TL (Form A: 61 slices), moderately decompressed TL (form B: 133 slices), and severely decompressed TL (form C: 30 slices). FL indicates false lumen; TL, true lumen.
Development and Validation of Equations
Six estimated equations for estimation of the CL of the descending aortic diameter [E‐CLD (x)] based on the above‐mentioned 6 parameters (post–true CL, post–whole CL, post‐Dma, post‐Dmi, [post–true CL+post–whole CL]/2, [post‐Dma+post‐Dmi]/2) were derived in the derivation sets by using linear regression. The performance of equations was assessed by the R 2 value and the absolute value of the bias (pre–whole CL minus the estimated value calculated from each equation). The accuracy was expressed as the percentage of patients with bias within 6.28 mm (diameter conversion 2 mm) and 9.42 (diameter conversion 3 mm).
Statistical Analysis
Continuous variables are reported as mean and standard deviation, and categorical data are reported as count and percentage. Methods of univariate analysis included the Student t test for continuous variables and the χ2 test or Fisher exact test for categorical variables. Differences in bias of E‐CLD were evaluated between equations by using the Student t test. A difference with P<0.05 was considered significant.
Results
Patients’ Characteristics
The patients’ characteristics are listed in Table 1. There were no significant differences in age, sex, body surface area, the rates of hypertension, hyperlipidemia, diabetes mellitus, renal function, and hemodialysis, dissection type, the false lumen (FL) patent rate, and the CT interval. The rates of morphological types of the TL in the dissected aorta were 29.8%, 51.9%, and 18.2% in form A (mildly decompressed), form B (moderately decompressed), and form C (severely decompressed), respectively, in the derivation sets (Figure 3). In the validation sets these rates were 25.0%, 65.8%, and 9.1% in forms A, B, and C, respectively. In 36 subjects the number of the patent and closed FL slices was 11/50 in form A, 85/48 slices in form B, and 5/25 in form C, respectively. There were significant differences in the 5 measured and 2 calculated parameters between the derivation and validation sets by 2 to 5 mm (≈1 mm in diameter conversion).
Linear Function in the Derivation Population
The correlation between pre–whole CL and each parameter in the derivation population was evaluated in linear regression (Figure 4). The values of the slope, intercept, and each R 2 value are also shown in Table 2. The parameter of (post–true CL+post–whole CL)/2 appeared to be the most promising parameter.
Figure 4.
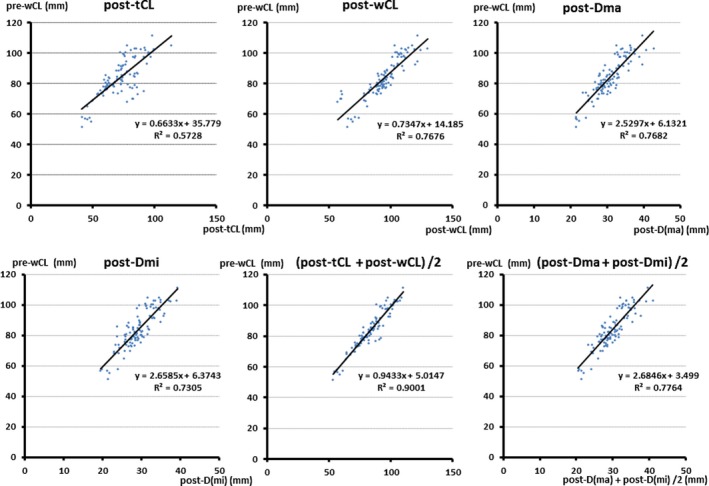
Linear regression analysis (derivation set). The parameter (post‐tCL+post‐wCL)/2 appeared to be the most promising parameter. post‐Dma indicates postdissected major diameter; post‐Dmi, postdissected minor diameter; post‐tCL, postdissected true lumen circumference length; post‐wCL, postdissected whole circumference length; pre‐wCL, predissected whole circumference length.
Table 2.
The Slope, Intercept, and r 2 Value in Each Equation
| Parameter | Slope (α) | Intercept (β) | r 2 |
|---|---|---|---|
| Post‐tCL | 0.6633 | 35.779 | 0.5728 |
| Post‐wCL | 0.7347 | 14.185 | 0.7676 |
| Post‐Dma | 2.5297 | 6.1321 | 0.7682 |
| Post‐Dmi | 2.6585 | 6.3743 | 0.7305 |
| (Post‐tCL+post‐wCL)/2 | 0.9433 | 5.0147 | 0.9001 |
| (Post‐Dma+post‐Dmi)/2 | 2.6846 | 3.499 | 0.7764 |
post‐Dma indicates postdissected major axis of descending aorta; post‐Dmi, postdissected minor axis of descending aorta; post‐tCL, postdissected true lumen circumference length of descending aorta; post‐wCL, postdissected whole circumference length of descending aorta.
Performance of E‐CLD in the Derivation and Validation Populations
The absolute values of the bias (pre–whole CL minus the estimated value calculated from each equation) and accuracy are listed in the derivation sets (Tables 3, 4 through 5) and validation sets (Tables 6, 7 through 8). In each sets the bias calculated from the equation that used (post–true CL+post–whole CL)/2 was significantly lower than that from the other equations (P<0.001) (Tables 4 and 7). The value of bias was similar in each equation between the derivation and validation sets. The average bias derived from E‐CLD ([post–true CL+post–whole CL]/2) was ≈2.5 to 3.0 mm in the CL. Therefore, diameter conversion from this value was less than 1 mm. The distribution of bias of each parameter is shown in Figure 5. The bias derived from E‐CLD ([post–true CL+post–whole CL]/2) showed the highest accuracy compared with the other parameters in the derivation (Table 5, Figure 5A) and validation (Table 8, Figure 5B) sets. Approximately 90% of cases showed bias below 6.28 mm of the CL (<2 mm in diameter conversion) when E‐CLD ([post–true CL+post–whole CL]/2) was used, and more than 95% showed bias below 9.42 mm (<3 mm in diameter conversion). We additionally perform a 6‐fold cross‐validation to reconfirm the result. In cross‐validation the equation using parameter (post–true CL+post–whole CL)/2 is the most promising one (Table S1).
Table 3.
The Bias Calculated Using Each 6 Parameters in Derivation Sets
| Parameter | Bias: (mm) |
|---|---|
| Post‐tCL | 6.1±5.3 |
| Post‐wCL | 4.8±3.6 |
| Post‐Dma | 4.9±3.4 |
| Post‐Dmi | 5.2±3.7 |
| (Post‐tCL+post‐wCL)/2 | 2.7±2.8 |
| (Post‐Dma+post‐Dmi)/2 | 4.8±3.3 |
Bias=I pre‐wCL−E‐CLD (α) I in the derivation population. post‐Dma indicates postdissected major axis of descending aorta; post‐Dmi, postdissected minor axis of descending aorta; post‐tCL, postdissected true lumen circumference length of descending aorta; post‐wCL, postdissected whole circumference length of descending aorta.
Table 4.
Performance of the Equation Using Each Parameter in Derivation Sets
| Parameter | Post‐tCL | Post‐wCL | Post‐Dma | Post‐Dmi | (Post‐tCL+Post‐wCL)/2 |
|---|---|---|---|---|---|
| Post‐tCL | |||||
| Post‐wCL | 0.9999 | ||||
| Post‐Dma | 0.4628 | 0.4628 | |||
| Post‐Dmi | 0.7749 | 0.7749 | 0.2731 | ||
| (Post‐tCL+post‐wCL)/2 | <0.0001 | <0.0001 | <0.0001 | <0.0001 | |
| (Post‐Dma+post‐Dmi)/2) | 0.5118 | 0.5118 | 0.9158 | 0.3057 | <0.0001 |
This calculated bias using the parameter of (Post‐tCL + Post‐ wCL)/2 was significantly lower than that from the other parameters (P<0.001). post‐Dma indicates postdissected major axis of descending aorta; post‐Dmi, postdissected minor axis of descending aorta; post‐tCL, postdissected true lumen circumference length of descending aorta; post‐wCL, postdissected whole circumference length of descending aorta.
Table 5.
The Accuracy of the Equation Using Each Parameter in Derivation Sets
| Parameter | Accuracy (%) | |
|---|---|---|
| Bias <6.42 mm (95% CI) | Bias <9.42 mm (95% CI) | |
| Post‐tCL | 60.6% (51.0‐70.2) | 76.0% (67.6‐84.4) |
| Post‐wCL | 71.1% (62.2‐80.0) | 89.4% (83.4‐95.4) |
| Post‐Dma | 70.1% (61.1‐79.1) | 87.5% (81.0‐94.0) |
| Post‐Dmi | 65.4% (56.1‐74.7) | 86.5% (79.8‐93.2) |
| (Post‐tCL+post‐wCL)/2 | 89.4% (83.4‐95.4) | 96.2% (92.5‐99.9) |
| (Post‐Dma+post‐Dmi)/2 | 66.3% (57.0‐75.6) | 88.4% (82.1‐94.7) |
This equation using the parameter of (Post‐tCL + Post‐wCL)/2 showed the highest accuracy compared with that using the other parameters in the derivation sets. CI indicates confidence interval; post‐Dma, postdissected major axis of descending aorta; post‐Dmi, postdissected minor axis of descending aorta; post‐tCL, postdissected true lumen circumference length of descending aorta; post‐wCL, postdissected whole circumference length of descending aorta.
Table 6.
The Bias Calculated Using Each of 6 Parameters in Validation Sets
| Parameter | Bias: (mm) |
|---|---|
| Post‐tCL | 6.0±4.5 |
| Post‐wCL | 5.4±4.6 |
| Post‐Dma | 4.9±3.9 |
| Post‐Dmi | 5.5±4.0 |
| (Post‐tCL+post‐wCL)/2 | 2.6±2.2 |
| (Post‐Dma+post‐Dmi)/2 | 5.0±3.7 |
Bias=I pre‐wCL−E‐CLD (α) I in the validation population. post‐Dma indicates postdissected major axis of descending aorta; post‐Dmi, postdissected minor axis of descending aorta; post‐tCL, postdissected true lumen circumference length of descending aorta; post‐wCL, postdissected whole circumference length of descending aorta.
Table 7.
Performance of the Equation Using Each Parameter in Validation Sets
| Parameter | Post‐tCL | Post‐wCL | Post‐Dma | Post‐Dmi | (Post‐tCL+Post‐wCL)/2 |
|---|---|---|---|---|---|
| Post‐tCL | |||||
| Post‐wCL | 0.0407 | ||||
| Post‐Dma | 0.0555 | 0.8371 | |||
| Post‐Dmi | 0.186 | 0.3757 | 0.4817 | ||
| (Post‐tCL+post‐wCL)/2 | <0.0001 | <0.0001 | <0.0001 | <0.0001 | |
| (Post‐Dma+post‐Dmi)/2) | 0.0422 | 0.9391 | 0.8926 | 0.4002 | <0.0001 |
The bias calculated from the equation that used (Post‐tCL+Post‐wCL)/2 was significantly lower than that from the other equations (P<0.001), post‐Dma indicates postdissected major axis of descending aorta; post‐Dmi, postdissected minor axis of descending aorta; post‐tCL, postdissected true lumen circumference length of descending aorta; post‐wCL, postdissected whole circumference length of descending aorta.
Table 8.
The Accuracy of the Equation Using Each Parameter in Validation Sets
| Parameter | Accuracy (%) | |
|---|---|---|
| Bias <6.42 mm (95% CI) | Bias <9.42 mm (95% CI) | |
| Post‐tCL | 59.2% (49.6‐68.8) | 75.8% (67.4‐84.2) |
| Post‐wCL | 67.5% (58.3‐76.7) | 81.6% (74.0‐89.2) |
| Post‐Dma | 68.3% (59.1‐77.5) | 85.8% (79.0‐92.6) |
| Post‐Dmi | 65.0% (55.7‐74.3) | 80.1% (72.3‐87.9) |
| (Post‐tCL+post‐wCL)/2 | 91.7% (86.3‐97.1) | 99.2% (98.4‐100) |
| (Post‐Dma+post‐Dmi)/2 | 71.7% (62.9‐80.5) | 86.7% (80.0‐93.4) |
The bias derived from E‐CLD using (post‐tCL + post‐wCL)/2 showed the highest accuracy compared with the other parameter in validation population. CI indicates confidence interval; post‐Dma, postdissected major axis of descending aorta; post‐Dmi, postdissected minor axis of descending aorta; post‐tCL, postdissected true lumen circumference length of descending aorta; post‐wCL, postdissected whole circumference length of descending aorta.
Figure 5.

The distribution of the bias in both derivation and validation sets using the equation to estimate circumference length of descending aortic diameter (E‐CLD) (not the modified equation). In validation sets, 99.2% of cases showed its bias below 9.42 mm (=3 mm in diameter). Dma indicates major diameter; Dmi, minor diameter; post‐, postdissection; tCL, true lumen circumference length; wCL, whole circumference length.
Modified Equation for Estimation of Circumference Length of Descending Aortic Diameter (mE‐CLD) and Its Performance in the Total Population and Subgroups
In the clinical setting the above‐mentioned equations (Table 2) are inconvenient because the equations have detailed values of the slope and intercept. Therefore, we also developed 2 modified equations of the circumference length of the descending aortic diameter (mE‐CLD) using (post–true CL+post–whole CL)/2 and (post‐Dma+post‐Dmi)/2. The reason we developed a modified equation using (post‐Dma+post‐Dmi)/2, which is inferior to an equation using (post–true CL+post–whole CL)/2, is that there might be a clinical situation in which the CL of the whole and TL cannot be measured because of a lack of imaging study software. The modified equations are as follows:
The R 2 value of each equation, bias (pre–whole CL minus the estimated value derived from each equation) calculated from each equation, and accuracy are shown for the all population and subgroups in Tables 9, 10 through 11. The R 2 value of each modified equation was slightly lower but mostly similar to the original value (0.9001 versus 0.8965 in [post–true CL+post–whole CL]/2 and 0.7764 versus 0.775 in [post‐Dma+post‐Dmi]/2). The bias derived from the modified equations and their accuracy were similar to those derived from the original equations for each parameter, regardless of subgroups. The way to calculate pre–whole CL using both modified equations from 1 subject in the present study is shown in Figure 6.
Table 9.
The Slope, Intercept, and r 2 Value in Each Modified Equation
| Parameter | Slope | Intercept | r 2 |
|---|---|---|---|
| (Post‐tCL+post‐wCL)/2 | 1 | 0 | 0.8965 |
| (Post‐Dma+post‐Dmi)/2 | 2.7 | 0 | 0.775 |
post‐Dma indicates postdissected major axis of descending aorta; post‐Dmi, postdissected minor axis of descending aorta; post‐tCL, postdissected true lumen circumference length of descending aorta; post‐wCL, postdissected whole circumference length of descending aorta.
Table 10.
The Performance of Each Modified Equation in All and Subgroup Analysis
| (Post‐tCL+Post‐wCL)/2 | (Post‐Dma+Post‐Dmi)/2 | |||
|---|---|---|---|---|
| Bias | P Value | Bias | P Value | |
| All | 2.8±2.6 | 4.9±3.6 | ||
| Form | ||||
| Form A | 3.6±3.0 | Form A vs B: 0.0054 | 5.4±4.2 | Form A vs B: 0.3241 |
| Form B | 2.5±2.3 | Form A vs C: 0.3471 | 4.8±3.8 | Form A vs C: 0.3107 |
| Form C | 3.0±2.6 | Form B vs C: 0.2900 | 4.5±4.0 | Form B vs C: 0.6642 |
| Dissection | ||||
| Type A | 2.4±2.2 | P=0.0310 | 4.9±4.0 | P=0.9634 |
| Type B | 3.2±2.8 | 5.0±3.9 | ||
| FL patency | ||||
| Closed | 2.6±2.7 | P=0.3048 | 5.6±4.4 | P=0.0321 |
| Patent | 3.0±2.5 | 4.4±3.4 | ||
FL indicates false lumen; post‐Dma, postdissected major axis of descending aorta; post‐Dmi, postdissected minor axis of descending aorta; post‐tCL, postdissected true lumen circumference length of descending aorta; post‐wCL, postdissected whole circumference length of descending aorta.
Table 11.
The Accuracy of Each Modified Equation
| Parameter | Accuracy (%) | |
|---|---|---|
| Bias <6.42 mm (95% CI) | Bias <9.42 mm (95% CI) | |
| (post‐tCL+post‐wCL)/2 | 88.3% (82.0–94.6) | 97.8% (95.7–99.9) |
| (post‐Dma+post‐Dmi)/2 | 68.8% (59.7–77.9) | 87.5% (81.0–94.0) |
CI indicates confidence interval; post‐Dma, postdissected major axis of descending aorta; post‐Dmi, postdissected minor axis of descending aorta; post‐tCL, postdissected true lumen circumference length of descending aorta; post‐wCL, postdissected whole circumference length of descending aorta.
Figure 6.

This figure shows 1 example of measuring parameters and calculating estimated pre‐wCL by 2 modified equations. This case was 1 subject among 36 in the present study. E‐CLD indicates equation to estimate circumference length of descending aortic diameter; M‐E‐CLD, modified E‐CLD; post‐Dma, postdissected major diameter; post‐Dmi, postdissected minor diameter; post‐tCL, postdissected true lumen circumference length; post‐wCL, postdissected whole circumference length.
Discussion
Importance of Equations for Estimating the Predissected Descending Aortic Diameter
SGs are increasingly being used in the descending aorta for AAD. In acute type A dissection, an open SG is widely used and shows excellent midterm results in view of good distal aortic remodeling.2, 7, 8 In acute type B dissection, especially symptomatic or complicated dissection, early favorable results have been reported.3, 9, 10 Selecting the appropriate size of SG in this pathology is important. An oversized SG might result in formation of a new tear around the edge of the SG,4, 5, 6 and a smaller size of SG can result in type Ia or Ib leakage with treatment failure. Currently, no consensus has been reached as how to decide on the size of an SG in AAD. On the contrary, the size and landing zone requiring sealing of a true aneurysm have been determined for each type of product. This may be attributed to the following facts. First, a change in shape of the TL and FL varies, and measuring the diameter of dissected descending aorta in a constant way is difficult. Second, information on the predissected aortic diameter just before dissection is not usually available in the clinical setting. Few reports have addressed the morphological relation between the predissected and postdissected descending aorta.11 Additionally, to the best of our knowledge, no reports have addressed the method of measuring the exact size of dissected aorta. To determine the appropriate size of the SG for AAD, an equation for estimating the diameter of the aorta just before dissection is necessary. This equation may also help to investigate the factors affecting the genesis of AAD involving the descending aorta.12
Validity of Measurement
The present study is based on the assumption that an aortic diameter measured within 3 years before the onset of AAD without evidence of aneurysmal formation is equal to that at the onset of dissection. Rylski et al investigated the change in aortic geometry in patients without vascular disease throughout life in considerable detail.13 The CL of the descending aorta in their cohort was ≈80 mm (about 25 mm in diameter), which is slightly smaller than that of our study population. They reported that the change in descending aortic diameter was 0.8±0.01 mm/m2 (body surface area) in men and women per decade. In the present study the mean body surface area of the cohort was ≈1.6 m2, and the estimated dimensional change per decade was ≈1.5 mm. The mean interval of timing of CT scans was ≈1 year, the estimated dimensional change was 0.15 mm, and that of the CL was 0.5 mm. If the interval of CT scans was 3 years, the estimated changes in the diameter and CL were ≈0.5 and 1.5 mm, respectively, which appeared negligible. The measurement point in our study was the top level of each vertebra. Appropriate evaluation required consideration of the change in position of the descending aorta to the caudal and cranial direction. Rylski et al also investigated the change in centerline length of the descending aorta after dissection.14 They found that centerline length changed from 253.3 to 261.3 mm, with a change of less than 10 mm, which also appeared to be negligible.
Relationship With Previous Reports
Few reports have addressed the morphological relation between the predissected and postdissected descending aorta, and no reports have developed an equation for estimating the dimensions of the predissected descending aorta. Neri et al12 investigated the size of the inner layer of the ascending aorta at the onset of dissection. They examined specimens of the resected dissected aortic wall in 220 surgical cases of type A AAD in view of possible consequential shrinking of the arterial wall in the absence of arterial pressure. Okuno et al15 reported an increase in the descending aorta from 10.9±2.9 to 12.9±3.8 mm after induced dissection in an experimental study using the swine model. Rylski et al11 reported a geometrical change in the descending aorta in 25 patients with acute type B aortic dissection compared with enhanced CT scans within 2 years before dissection, which is similar to the present study. They found that the mean total diameter changed from 28.2 to 34.6 mm (+23% increase), and the predissection diameter showed a significant difference from the postdissection TL maximum diameter (30.5 versus 28.5 mm, P<0.0001). A difference between their study and the present study is that we developed an equation for estimating the predissected CL from CT images of the postdissected descending aorta and validated its performance in the total population, as well as in subgroups (dissection type, condition of the FL, and the degree of severity of decompressed TL) in mE‐CLD. The performance of equations appeared satisfactory, especially when we used the value of the average postdissected CL of TL and whole (post–true CL+post–whole CL)/2 in the derivation and validation models. This equation also showed almost equal performance, regardless of the type of dissection, the condition of the FL, and the severity of the decompressed TL. Unfortunately, we could not find any previous data that might support our equations. Rylski et al11 reported that the predissection diameter and postdissection TL at the first descending thoracic aortic quartile (calculated from the cross‐sectional area) were 30.5 and 23.8 mm (−23% decrease), respectively. In our study the mean predissected aortic diameter and postdissected TL diameter (measured by tracing the borderline) were 27.3 and 23.9 mm (−13.1% decrease), respectively. The cross‐sectional area and CL of the TL are affected by the shape of the decompressed TL. In Rylski et al's11 study, the severity of TL decompression was not addressed, and we thus could not compare our results with their results.
Interestingly, the average CL of the postdissected whole and TL, (post–true CL+post–whole CL)/2 was the most reliable parameter and resembled the predissected aortic CL from the result of mE‐CLD. The reason for this finding remains unknown. Our hypothesis of the mechanism of this finding is as follows. The shape of the dissected TL might depend on the balance of the blood pressure gradient between the TL and FL. In case of a severely decompressed FL (form C), higher blood pressure might be exerted on the FL compared with a mild (form A) or moderately (form B) decompressed FL. The dissected flap might become more shrunken, and the percentage of the decrease in the CL of the TL is increased in proportion to the degree of the severity of the decompressed TL (Table S2). However, the degree of expansion of the adventitia is larger because of higher blood pressure in the FL in such cases. Further study will be necessary to validate the equation developed in the present study and to clarify the rationale for this relation.
Equation to Be Used in the Clinical Setting
We consider that there was no significantly different value derived between E‐CLD and mE‐CLD in the clinical setting. Moreover, mE‐CLD is simple and clinically convenient for clinical use. The parameter of (post–true CL+post–whole CL)/2, which requires measurement of the CL in each lumen and is less convenient than (post‐Dma+post‐Dmi)/2, should be used based on the results shown in Tables 2, 3 through 4. Therefore, mE‐CLD ([post–true CL+post–whole CL]/2) is the most reliable and simplest equation for estimating the predissected descending aortic diameter from CT images at the onset of dissection.
The size of the SG that should be applied after calculation remains unclear, and conflicting results have been presented, probably due to the lack of standardization of the SG procedure including selection of SG size and length. The proximal landing zone in type B dissection is usually in the aortic arch without dissection. In the proximal landing zone without dissection, the diameter of the SG is usually chosen according to oversizing by 15% to 20% regarding the current diameter as usually applied in case of a nondissected aortic aneurysm. On the contrary, the distal part of the SG is usually in the dissected part and requires the prevention of both type Ib leak and new tear formation. To date, there has been no standard for the decision of SG located in the dissected aorta. One of the reasons might be attributed to the fact that understanding of the exact value of the predissected aortic diameter is difficult only from the CT image at the dissection. We hope that the present equations might contribute to promoting further study regarding the appropriate selection of the size of SG located in the dissected aortic part.
Study Limitations
We cannot exclude the possibility that the dimension of the descending aorta is significantly enlarged in the period between CT scans before dissection and the onset of dissection. The CT images that were used in this series were not ECG‐gated CT angiography, which enables more accurate analysis. ECG‐gated CT angiography is mainly performed for coronary artery examinations in which the whole descending aorta is not usually scanned. Therefore, ECG‐gated CT scanning before dissection in which the whole descending aorta can be investigated is rare. Moreover, ECG‐gated CT is not usually performed for making the diagnosis of AAD in the clinical setting. Therefore, collecting sufficient data in the method of comparing ECG‐gated CT images between the 2 periods would be difficult. Whether this equation can be applied for chronic dissection is unclear, and further study will be necessary.
Conclusion
No consensus has been achieved for determining the size of the SG used in the descending aorta for AAD. This determination might be important for successful treatment of this critically ill pathology. Our newly developed equation that can estimate the predissected descending aortic diameter, especially using the parameter of the average of the postdissected whole CL and CL of TL, might be helpful in deciding on the size of the SG as well as for investigating the factors affecting the genesis of AAD. Further study will be necessary to improve our equation to achieve greater precision for improving the clinical outcome of this pathology.
Appendix
Facilities Affiliated With OSCAR
Department of Cardiovascular Surgery, Osaka University School of Medicine, Sakurabashi Watanabe Hospital, Osaka Police Hospital, Osaka General Hospital, Osaka Rosai Hospital, Hyogo College of Medicine, KKR Sapporo Medical Center, Osaka Minami Medical Center, Osaka National Hospital, Yao Tokushukai Hospital, Kawachi General Hospital, Kinan Hospital, Fukui Cardiovascular Center, Higashi Takarazuka Satoh Hospital, Kansai Rosai Hospital, Otemae Hospital, Ehime University Graduate School of Medicine, Tottori University Faculty of Medicine, Dokkyo Medical University, Chiba University Graduate School of Medicine, Suita Tokushukai Hospital, Nagoya Tokushukai General Hospital, Sakakibara Heart Institute of Okayama, International University of Health and Welfare, Mita Hospital, Rinku General Medical Center, Sakai City Medical Center, Dokkyo Medical University Saitama Medical Center, and JCHO Osaka Hospital.
Disclosures
None.
Supporting information
Table S1. The 6‐Fold Cross‐Validation
Table S2. The Relation Between the Morphology of Dissected True Lumen and Diameter Change
Acknowledgments
We thank Ellen Knapp, PhD, from Edanz Group (http://www.edanzediting.com/ac) for editing a draft of this article. OSCAR (Osaka Cardiovascular Surgery Research Group) started in 2006 in order to promote the investigation and education regarding cardiovascular surgery among the department of cardiovascular surgery of Osaka University Graduate School of Medicine and its associated hospitals. We acknowledge 4 facilities (Sakurabashi Watanabe Hospital, KKR Sapporo Medical Center, Dokkyo Medical University Saitama Medical Center, and Osaka General Hospital) that participated in the present study.
(J Am Heart Assoc. 2018;7:e009196 DOI: 10.1161/JAHA.118.009196.)
References
- 1. Masuda M, Okumura M, Doki Y, Endo S, Hirata Y, Kobayashi J, Kuwano H, Motomura N, Nishida H, Saiki Y, Saito A, Shimizu H, Tanaka F, Tanemoto K, Toh Y, Tsukihara H, Wakui S, Yokomise H. Thoracic and cardiovascular surgery in Japan during 2014: annual report by the Japanese Association for Thoracic Surgery. Gen Thorac Cardiovasc Surg. 2016;64:665–697. [DOI] [PMC free article] [PubMed] [Google Scholar]
- 2. Uchida N, Shibamura H, Katayama A, Shimada N, Sutoh M. Total arch replacement with an open stent graft for acute type A aortic dissection: fate of the false lumen. Eur J Cardiothorac Surg. 2009;35:83–88. [DOI] [PubMed] [Google Scholar]
- 3. Singh M, Hager E, Avgerinos E, Genovese E, Mapara K, Makaroun M. Choosing the correct treatment for acute aortic type B dissection. J Cardiovasc Surg. 2015;56:217–229. [PubMed] [Google Scholar]
- 4. Huang CY, Weng SH, Weng CF, Chen WY, Chen IM, Hsu CP, Shih CC. Factors predictive of distal stent graft‐induced new entry after hybrid arch elephant trunk repair with stainless steel‐based device in aortic dissection. J Thorac Cardiovasc Surg. 2013;146:623–630. [DOI] [PubMed] [Google Scholar]
- 5. Ma T, Dong ZH, Fu WG, Guo DQ, Xu X, Chen B, Jiang JH, Yang J, Shi ZY, Zhu T, Shi Y, Jiang BH, Xu XY. Incidence and risk factors for retrograde type A dissection and stent graft‐induced new entry after thoracic endovascular aortic repair. J Vasc Surg. 2018;67:1026–1033.e2. [DOI] [PubMed] [Google Scholar]
- 6. Jang H, Kim MD, Kim GM, Won JY, Ko YG, Choi D, Joo HC, Lee DY. Risk factors for stent graft‐induced new entry after thoracic endovascular aortic repair for Stanford type B aortic dissection. J Vasc Surg. 2017;65:676–685. [DOI] [PubMed] [Google Scholar]
- 7. Uchida N, Ishihara H, Shibamura H, Kyo Y, Ozawa M. Midterm results of extensive primary repair of the thoracic aorta by means of total arch replacement with open stent graft placement for an acute type A aortic dissection. J Thorac Cardiovasc Surg. 2006;131:862–867. [DOI] [PubMed] [Google Scholar]
- 8. Yamane Y, Uchida N, Mochizuki S, Furukawa T, Yamada K. Early‐ and mid‐term aortic remodelling after the frozen elephant trunk technique for retrograde type A acute aortic dissection using the new Japanese J Graft open stent graft. Interact Cardiovasc Thorac Surg. 2017;25:720–726. [DOI] [PubMed] [Google Scholar]
- 9. Zhu T, Si Y, Fang Y, Chen B, Yang J, Jiang J, Yue J, Fu W. Early outcomes of the conformable stent graft for acute complicated and uncomplicated type B aortic dissection. J Vasc Surg. 2017;66:1644–1652. [DOI] [PubMed] [Google Scholar]
- 10. Sobocinski J, Lombardi JV, Dias NV, Berger L, Zhou Q, Jia F, Resch T, Haulon S. Volume analysis of true and false lumens in acute complicated type B aortic dissections after thoracic endovascular aortic repair with stent grafts alone or with a composite device design. J Vasc Surg. 2016;63:1216–1224. [DOI] [PubMed] [Google Scholar]
- 11. Rylski B, Munoz C, Beyersdorf F, Siepe M, Reser D, Carrel T, Schoenhoff F, Schlensak C, Lescan M, Eckstein HH, Reutersberg B, Erbel R, Janosi RA, Czerny M. How does descending aorta geometry change when it dissects? Eur J Cardiothorac Surg. 2018;53:815–821. [DOI] [PubMed] [Google Scholar]
- 12. Neri E, Barabesi L, Buklas D, Vricella LA, Benvenuti A, Tucci E, Sassi C, Massetti M. Limited role of aortic size in the genesis of acute type A aortic dissection. Eur J Cardiothorac Surg. 2005;28:857–863. [DOI] [PubMed] [Google Scholar]
- 13. Rylski B, Desjardins B, Moser W, Bavaria JE, Milewski RK. Gender‐related changes in aortic geometry throughout life. Eur J Cardiothorac Surg. 2014;45:805–811. [DOI] [PubMed] [Google Scholar]
- 14. Rylski B, Blanke P, Beyersdorf F, Desai ND, Milewski RK, Siepe M, Kari FA, Czerny M, Carrel T, Schlensak C, Kruger T, Mack MJ, Brinkman WT, Mohr FW, Etz CD, Luehr M, Bavaria JE. How does the ascending aorta geometry change when it dissects? J Am Coll Cardiol. 2014;63:1311–1319. [DOI] [PubMed] [Google Scholar]
- 15. Okuno T, Yamaguchi M, Okada T, Takahashi T, Sakamoto N, Ueshima E, Sugimura K, Sugimoto K. Endovascular creation of aortic dissection in a swine model with technical considerations. J Vasc Surg. 2012;55:1410–1418. [DOI] [PubMed] [Google Scholar]
Associated Data
This section collects any data citations, data availability statements, or supplementary materials included in this article.
Supplementary Materials
Table S1. The 6‐Fold Cross‐Validation
Table S2. The Relation Between the Morphology of Dissected True Lumen and Diameter Change