Significance
Plasmonic microbubbles are at the center of numerous applications, including micromanipulation/nanomanipulation, biomedical diagnosis and therapy, and solar energy harvesting. Controlling the dynamics of these microbubbles is key to successfully exploiting their potential in the growing number of applications. Literature has vastly overlooked the nucleation and early microsecond dynamics by which these microbubbles arise. It is of utmost importance to understand this early phase, as it displays the most violent dynamics and is the precursor and origin of all subsequent dynamics, on which the many applications rely.
Keywords: plasmonic bubbles, vaporization, nucleation dynamics, superheat, energy conversion
Abstract
When illuminated by a laser, plasmonic nanoparticles immersed in water can very quickly and strongly heat up, leading to the nucleation of so-called plasmonic vapor bubbles. While the long-time behavior of such bubbles has been well-studied, here, using ultrahigh-speed imaging, we reveal the nucleation and early life phase of these bubbles. After some delay time from the beginning of the illumination, a giant bubble explosively grows, and collapses again within 200 μs (bubble life phase 1). The maximal bubble volume remarkably increases with decreasing laser power, leading to less total dumped energy . This dumped energy shows a universal linear scaling relation with , irrespective of the gas concentration of the surrounding water. This finding supports that the initial giant bubble is a pure vapor bubble. In contrast, the delay time does depend on the gas concentration of the water, as gas pockets in the water facilitate an earlier vapor bubble nucleation, which leads to smaller delay times and lower bubble nucleation temperatures. After the collapse of the initial giant bubbles, first, much smaller oscillating bubbles form out of the remaining gas nuclei (bubble life phase 2). Subsequently, the known vaporization dominated growth phase takes over, and the bubble stabilizes (life phase 3). In the final life phase 4, the bubble slowly grows by gas expelling due to heating of the surrounding. Our findings on the explosive growth and collapse during the early life phase of a plasmonic vapor bubble have strong bearings on possible applications of such bubbles.
Noble metal nanoparticles under resonant irradiation of continuous-wave (cw) lasers can produce huge amounts of heat due to the enhanced plasmonic effect, resulting in the vaporization of the surrounding water. This will cause the formation of microsized plasmonic bubbles (1–6). These bubbles appear in numerous applications, including micromanipulation/nanomanipulation (7, 8), biomedical therapy (9–13), and solar energy harvesting (1, 4, 5, 14–17). Understanding the nucleation mechanism and growth dynamics of these plasmonic bubbles is key to successfully taking up the challenges connected to these applications. However, most studies up to now have not yet focused on the plasmonic microbubble nucleation and its early dynamics but, instead, are conducted on the long-term (milliseconds to seconds) timescale (5, 6, 18, 19). In a recent study, we revealed that the long-time growth of these plasmonic bubbles can be divided into two phases—namely, a vaporization-dominated phase in which vapor bubbles grow (up to 10 ms), followed by a slow diffusion-dominated growth (20). This later phase reflects the role of dissolved gas in the growth dynamics of the bubbles (20). Note that the vaporization event for plasmonic bubbles is different than for normal vapor bubbles, which arise from simply locally heating the liquid with a laser (21–25).
Upon laser irradiation, water around plasmonic nanoparticles at solid–liquid interfaces experiences a rapid temperature increase, first proportional to the input laser intensity. The resulting temperature rise can exceed the boiling temperature (C) within a few nanoseconds to microseconds (3, 26–29). This is several orders of magnitude faster than the millisecond time scale in which plasmonic bubbles are normally observed. At the nanosecond to microsecond time scales, the fate of the plasmonic nanoparticles under cw laser irradiation and that of the liquid in their vicinity have remained unexplored. The reason for this primarily lies in the difficulty to visualize the early stage of the vaporization dynamics around the plasmonic nanoparticles, due to the lack of imaging systems with sufficient temporal resolution.
In this work, we overcome this bottleneck by means of the ultrahigh-speed imaging facility Brandaris 128 (30, 31) and reveal the early dynamics of plasmonic bubbles nucleating on an immersed gold nanoparticle (GNP)-decorated surface. Brandaris 128 has a temporal resolution of 100 ns, which allowed us to reveal that a giant transient vapor bubble arises before the hitherto-observed plasmonic bubbles (Movie S1). The delay between the beginning of the laser heating and the bubble nucleation depends on the laser power and the concentration of the gas dissolved in water. We compare a gas-rich and a gas-poor case, with the latter having about half of the gas concentration as the former. The measured relation between the delay and the laser power will be used to estimate the nucleation temperature of the vapor bubbles in water. Combined with the submicrosecond cavitation dynamics, this nucleation delay provides information on the energy conversion efficiency. Our findings have strong bearings on the applications mentioned above and affect their risk assessment.
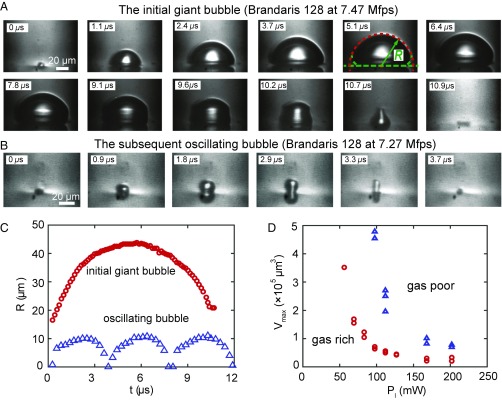
An array of GNPs with diameters of 100 nm and spaced by 260 nm (center to center) was deposited on a fused silica substrate to induce plasmonic bubble nucleation. Experiments were first conducted with the Brandaris 128 ultrahigh-speed imaging system at frame rates near 8 Mfps. The origin of time ( s) is the instant at which the laser beam hits the substrate. After a delay time , a bubble (Fig. 1A) nucleated. During the violent subsequent growth, the cavitation bubble can reach a size >100 m within 6 s, while retaining a hemispherical shape. Fig. 1D shows that an increase of the laser power counterintuitively led to a decrease in the maximum bubble volume . Also counterintuitively, the gas-poor case led to larger bubbles compared with the gas-rich case.
Fig. 1.
(A and B) Evolution of an initial giant bubble (A) and a subsequent oscillating bubble (B) along with their life cycles captured at 7.47 Mfps for the gas-rich case and . The two kinds of bubbles show different shapes and dynamics. (C) Radius of curvature as a function of time for an initial giant bubble and for the subsequent oscillating bubbles. (D) Maximum volume of the giant bubble as function of laser power in gas-rich and -poor water. Counterintuitively, the bubble volume decreases with increasing laser power .
After the initial giant bubble collapsed, smaller bubbles experienced cycles of sustained oscillations (Fig. 1B and Movie S2) before gradually stabilizing. These bubbles, referred to as oscillating bubbles, were 100 times smaller in volume than the initial giant bubble (Fig. 1C). Accordingly, the oscillation period of these bubbles was substantially shorter than the lifetime of the giant bubble.
These two life phases—i.e., the giant bubble growth and collapse (life phase 1) and the oscillating bubbles (life phase 2)—preceded the usually observed plasmonic bubble dynamics (6, 18–20, 32). As revealed in ref. 20, this later plasmonic bubble dynamics consists of two subsequent and slower phases—namely, a vaporization-dominated growth (life phase 3) and a diffusion-driven growth that is dominated by the influx of dissolved gas from the water (life phase 4) and correspondingly depends on the dissolved gas concentration. Fig. 2 summarizes all four life phases.
Fig. 2.
Time sequence of the bubble dynamics under continuous laser irradiation on the patterned GNP sample surface in gas-rich water and = 83 mW. According to their nucleation and growth dynamics, the evolution of the plasmonic bubbles is divided into four phases. (Scale bars: 25 m.)
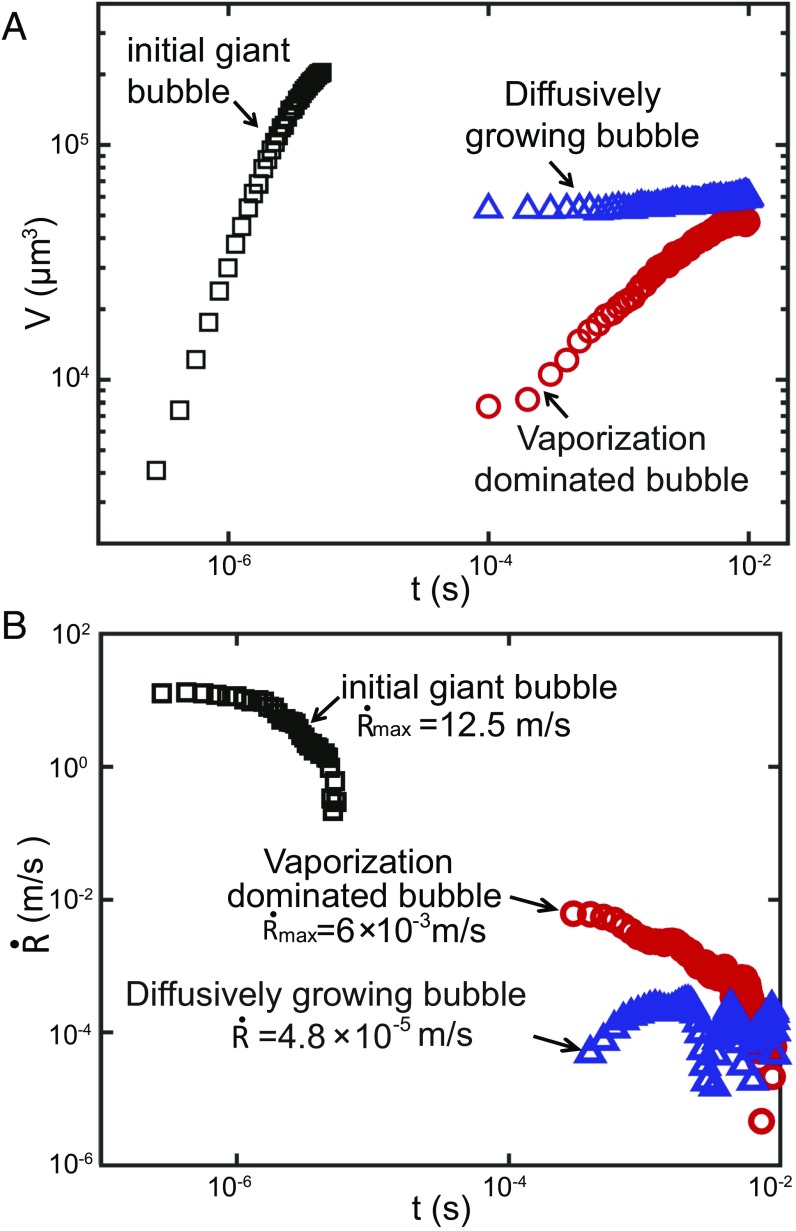
Fig. 3A shows the volume as a function of time for an initial giant bubble (life phase 1), a vaporization-dominated bubble (life phase 3), and a bubble growing slowly by gas diffusion (life phase 4) for the gas-rich case. The volume of the initial giant bubble rapidly exceeded that of the vaporization-dominated bubble (phase 3) and that of the diffusively growing bubbles (phase 4). The growth rate of the giant bubble (Fig. 3B) reached a maximum value of 12.5 m/s, which is, respectively, 2,000 times and times larger than the respective growth rates of the vaporization-dominated and the diffusively growing bubbles.
Fig. 3.
(A) Bubble volume dynamics during growth for an initial giant bubble (life phase 1; black), a vaporization-dominated bubble (life phase 3; red), and a diffusively growing bubble (life phase 4; blue) in gas-rich water. (B) Growth rates of the same three bubbles. Both plots are in double-logarithmic scale. Note: The origin of time for the diffusively growing bubble was aligned to that of the vaporization-dominated bubble to facilitate the comparison.
To capture the dynamics on a longer timescale that encompasses the nucleation delay, a second set of experiments was performed by using a high-speed camera operated at 300 kfps (SI Appendix). The experiments were conducted with different laser powers in both gas-rich and -poor water. The observed decrease in maximum volume of the initial giant bubble with increasing laser power seems counterintuitive, and so does the observed larger bubble volume for the gas-poor case. The reason for this behavior is that nucleation of vapor bubbles in water requires the temperature to reach the nucleation temperature . Under ideal conditions (pure water), this temperature is identical to the liquid spinodal decomposition temperature (33). However, the presence of impurities, gases, or interfaces results in a lower (Fig. 4A). The nucleation temperature does not depend on the laser power , which explains the increased delay time for lower seen in Fig. 4B.
Fig. 4.
(A) Phase diagram of water (schematics). The green solid line is the liquid spinodal line, the theoretical limit of superheat, while the blue and red dashed lines schematically depict the attainable superheat for gas-poor and -rich water. (B) Measured delay as function of . The symbols represent the experimental data, and the solid lines the fit curves using Eq. 1. (C) Double logarithmic plot of vs. . Both curves fall within the theoretical limits—namely, the boiling temperature (black curve) and the spinodal curve ( = 578.2 K for a pressure of 1 atm; green curve). The shorter delay time for gas-rich water indicates that dissolved gas facilitates bubble nucleation.
We then went ahead and analytically quantified this behavior. The time-dependent temperature field around a single nanoparticle, assuming spherical geometry and constant thermal properties, is governed by the spherical linear Fourier equation for heat conduction:
| [1] |
where , , and are thermal diffusivity, density, and heat capacity of water, is the spherical distance to the GNP, and is the deposited power density (unit in ), which is assumed to be constant for a radius within the GNP, and 0 elsewhere.
This problem was solved analytically, in the Fourier domain, and subsequently reversed back to real space numerically. The temperature field generated by the nanoparticle array could then be computed by superposition, placing the nanoparticle sources on the liquid/substrate interface, within the Gaussian laser beam. A first-order correction was applied to account for the presence of a substrate as detailed in SI Appendix.
The resulting time-dependent temperature field is the linear superposition of the temperature fields of the nanoparticles,
| [2] |
with the temperature field created by the particle i, the distance from the center of this nanoparticle to the point located at the coordinates . The result, proportional to the input power, is given in SI Appendix. From the computation, taking into account the laser input power, one directly obtains the time required to reach a given temperature for a given laser power. This approach was used to fit the experimental data in Fig. 4B using a root-mean-square-minimization method, resulting in the solid curves in Fig. 4B.
This fitting procedure directly provides values for the nucleation temperature—namely, K and K for the gas-rich and -poor water, respectively—and for the vaporization power thresholds —namely, = 39 and 62 mW, respectively. Fig. 4C shows a double-logarithmic plot of vs. . As expected, both curves were located between the two limiting cases—namely, the liquid–vapor equilibrium temperature = 373.2 K (black curve) and the water spinodal temperature = 578.2 K (33) (green curve). Moreover, above-obtained values for the vaporization power thresholds were in reasonable agreement with the respective measured thresholds of 44 and 56 mW for the gas-rich and -poor cases. Below this threshold, the steady-state regime for spherical heat diffusion had time to establish, and the temperature stopped rising before the system reached the required nucleation temperature.
The experimental results also revealed that the dissolved gas plays a crucial role in the initial giant bubble nucleation. Numerous studies have shown that impurities in water can greatly reduce the nucleation temperature from the liquid spinodal temperature (34–36). As the concentration of dissolved gas in the gas-poor water is about half of that in gas-rich water, the probability of forming gas nuclei larger than the critical size is statistically reduced (37), resulting in a higher , which leads to an increase in the delay time in gas-poor water.
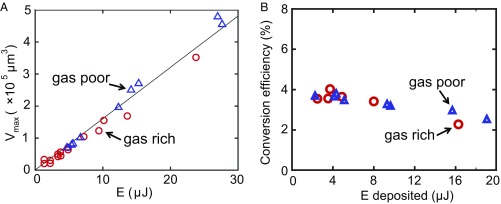
Nonetheless, as shown in Fig. 5A, the maximum bubble volume displayed a universal linear relation (with m3/μJ), with the total dumped energy , which is the accumulated laser energy in the illumination spot on the substrate from the moment the laser was switched on to the moment of bubble nucleation. The very same linear relation held for both gas concentrations. This reflects that the energy stored in the vicinity of the nucleus determined the energy available for vaporization, and more energy resulted in larger vapor bubbles. The linear relation is a consequence of the short delay time observed in these experiments relative to the thermal diffusion time s, where is the laser spot radius. Moreover, it further confirmed that the initial giant bubbles are pure vapor bubbles, for both gas-poor and -rich water.
Fig. 5.
(A) Maximal volume of the giant bubble as function of the energy in gas-rich and -poor water. Both cases show an identical linear relation between , regardless of and . (B) Actual conversion efficiency of the GNPs for the energy converted from laser heat deposition to vaporization enthalpy contained in the vapor.
The major motivation for using plasmonic particles for applications such as solar to steam energy harvesting or plasmonic bubble photoacoustic therapy lies in their outstanding efficiency of light absorption. In such cases, the limiting factor becomes the thermal processes occurring within the system that convert thermal energy into vapor. It is therefore important to quantify the energy conversion efficiency. For water, one can neglect the heat capacity compared with latent heat of vaporization. Thus, the energy contained in the giant initial bubble can be estimated by using the ideal gas law:
| [3] |
where and are water saturation pressure and temperature, respectively; is the molar mass of water; is its latent heat of vaporization; and = 8.314 is the gas constant. Since the ratio is independent of the laser power (SI Appendix), is proportional to the maximal bubble volume . The ratio of the energy contained in the initial giant vapor bubble to the energy absorbed by the substrate, which is the effective energy conversion efficiency for this process, is displayed in Fig. 5B and is equal to () . The conversion efficiency displayed a slight decrease for larger energies, corresponding to an increase of . This is in agreement with the increasing (with time) losses by heat diffusion.
To summarize, we have shown that the nucleation of plasmonic bubble on water-immersed, laser-irradiated GNPs was initiated by a transient and explosively growing giant vapor bubble with a lifetime of 10 s. The maximum growth rate of the initial giant bubbles was >12.5 , which is three orders of magnitude larger than that of the later and hitherto-observed plasmonic bubbles that grow by steady vaporization. Whether and when a giant initial bubble nucleates is determined by the competition between laser heating and cooling through thermal diffusion. As a result, the delay time up to bubble nucleation decreases with increasing laser power , leading to smaller bubbles. Both the nucleation temperature and the laser power threshold value can be obtained from a simple heat diffusion model and are consistent with the experimental values. Moreover, the experimental results showed that the gas-poor water had a much larger delay time than the gas-rich water. This makes evidence that dissolved gas facilitates vapor bubble nucleation and lowers the superheat temperature limit. After nucleation, the giant bubbles in both cases obeyed the same dynamics (life phase 1). The maximum bubble volume followed the same linear relation with the accumulated energy for both gas-rich and -poor water. In the later life stages, the plasmonic bubble displayed small, sustained oscillations (life phase 2), followed by the known vaporization-dominated phase (life phase 3) and diffusive growth phase (life phase 4). Our findings on plasmonic bubble dynamics have strong bearings on various applications of plasmonic bubbles, notably on medical applications where large plasmonic bubbles can cause damage (38). In the context of catalysis or triggering chemical reactions, the energetic giant bubble collapse may be beneficial.
Materials and Methods
Sample Preparation.
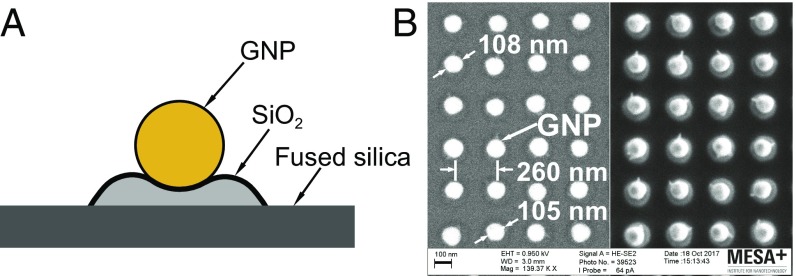
A gold layer of 45 nm was deposited on an amorphous fused-silica wafer by using an ion-beam sputtering system (home-built COathy machine, MESA+ NanoLab, Twente University). A bottom antireflection coating (BARC) layer (186 nm) and a photoresist (PR) layer (200 nm) were subsequently coated on the wafer. Periodic nanocolumns with diameters of 110 nm were patterned in the PR layer by using displacement Talbot lithography (PhableR 100C, EULITHA) (39). These periodic PR nanocolumns were subsequently transferred at wafer level to the underlying BARC layer, forming 110-nm BARC nanocolumns by using nitrogen plasma etching (home-built TEtske machine, NanoLab) at 10 mTorr and 25 W for 8 min. By using these BARC nanocolumns as a mask, the Au layer was subsequently etched by ion beam etching (Oxford i300, Oxford Instruments, United Kingdom) with 5 sccm Ar and 50–55 mA at an inclined angle of . The etching for 9 min resulted in periodic Au nanodots supported on cone-shaped fused-silica features. The remaining BARC was stripped by using oxygen plasma for 10 min (TePla 300E, PVA TePla AG, Germany). The fabricated array of Au nanodots was heated to C in 90 min and subsequently cooled passively to room temperature. During the annealing process, these Au nanodots reformed into spherical-shaped Au nanoparticles, as shown in Fig. 6 A and B.
Fig. 6.
(A) Schematic of a GNP sitting on a island on a fused-silica substrate. (B) SEM images of the patterned GNP sample surface. (B, Left) Energy-selective backscatter (ESB) mode. (B, Right) High-efficiency secondary electron mode.
Setup Description.
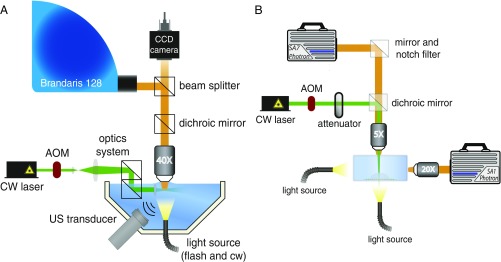
In this study, two imaging setups were used to capture the growth dynamics of plasmonic microbubbles, both on short and long terms, as shown in Fig. 7. Short-term measurements were performed by using the Brandaris 128 ultrafast imaging system (30, 31). This system can capture 128 consecutive images with a frame rate of up to 25 Mfps. The schematics of the Brandaris 128 setup is shown in Fig. 7A; an upright microscope was installed together with a water-immersion objective (LUMPLFLN, Olympus) for bubble observation. In the Brandaris 128, 128 CCD cameras are sequentially installed along an arc. The images from the objective are redirected to the sequence of the CCD sensors by a rotating mirror-polished beryllium turbine. By adjusting the rotation speed of the turbine, one can tune the recording speed. In our experiments, the frame rates were 7–8 Mfps, which allowed us to capture the detailed temporal evolution of the initial giant bubbles or three to four oscillation cycles of the subsequent oscillating bubbles. A xenon flashlight was used as illumination source.
Fig. 7.
Schematic of the optical imaging facilities for plasmonic microbubble formation observation. (A) Brandaris 128 imaging system with frame rate up to 25 Mfps. (B) High-speed camera imaging system with frame rate up to 500 kfps. AOM, acousto-optic modulator; US, ultrasound.
The GNP-decorated sample was immersed in a water tank and placed vertically to enable side-view imaging of plasmonic bubbles. During measurement, the sample surface was irradiated with a cw laser (Cobolt Samba) of 532-nm wavelength and tuneable power up to 200 mW. An acousto-optic modulator (Opto-Electronic, AOTFncVIS) was used as a shutter to control on/off of laser irradiation on the sample surface. A 400-s laser pulse was generated and controlled by a pulse/delay generator (BNC model 565). Additionally, an ultrasound transducer was installed inside the water tank to obtain the acoustic signal of initial bubble nucleation. This facilitated the synchronization of the laser pulse and Brandaris 128 image capture.
The Brandaris 128 ultrahigh-speed imaging facility can capture 128 consecutive frames, thus recording only for a limited period. To capture the dynamics on a larger time scale, a second setup was designed with a high-speed camera operated at a frame rate of 300 kfps, as depicted in Fig. 7B, equipped with 5× (LMPLFLN, Olympus) and 20× (SLMPLN, Olympus) long working distance objectives. The 5× objective was used to focus laser onto the sample surface; the other one was used to obtain side-view images. Bubble growth was recorded by using a high-speed camera (Photron SA1) operated at framerate of up to 500 kfps. Another high-speed camera (Photron SA7) was used to capture top-view images of the sample surface for optical alignment. Two light sources, Olympus ILP-1 and Schott ACE I, were used to provide illumination for both high-speed cameras.
In two sets of experiments, plasmonic microbubble formation in both gas-rich and -poor water was studied. Water directly obtained from a Milli-Q machine was taken as gas-rich water. To get gas-poor water, the liquid cell was filled with water and vacuumed. The total degassing time was 3 h. The relative gas concentration for both gas-rich and -poor water was measured with an oxygen meter (Fibox 3 Trace, PreSens) in the ambient environment (temperature: C). During measurements, the fluid cell was sealed to slow down regassing. The relative gas concentration in the gas-poor water was 34%. This was about a half of the value of 65% measured in the gas-rich water.
Supplementary Material
Acknowledgments
We thank Andrea Prosperetti for helpful discussions. This work was supported by the Dutch Organization for Research and the Netherlands Center for Multiscale Catalytic Energy Conversion. Y.W. was supported by National Natural Science Foundation of China Grant 51775028 and Beijing Natural Science Foundation Grant 3182022.
Footnotes
The authors declare no conflict of interest.
This article is a PNAS Direct Submission.
This article contains supporting information online at www.pnas.org/lookup/suppl/doi:10.1073/pnas.1805912115/-/DCSupplemental.
References
- 1.Neumann O, et al. Solar vapor generation enabled by nanoparticles. ACS Nano. 2013;7:42–49. doi: 10.1021/nn304948h. [DOI] [PubMed] [Google Scholar]
- 2.Baffou G, Quidant R. Nanoplasmonics for chemistry. Chem Soc Rev. 2014;43:3898–3907. doi: 10.1039/c3cs60364d. [DOI] [PubMed] [Google Scholar]
- 3.Carlson MT, Green AJ, Richardson HH. Superheating water by CW excitation of gold nanodots. Nano Lett. 2012;12:1534–1537. doi: 10.1021/nl2043503. [DOI] [PubMed] [Google Scholar]
- 4.Fang Z, et al. Evolution of light-induced vapor generation at a liquid-immersed metallic nanoparticle. Nano Lett. 2013;13:1736–1742. doi: 10.1021/nl4003238. [DOI] [PMC free article] [PubMed] [Google Scholar]
- 5.Baral S, Green AJ, Livshits MY, Govorov AO, Richardson HH. Comparison of vapor formation of water at the solid/water interface to colloidal solutions using optically excited gold nanostructures. ACS Nano. 2014;8:1439–1448. doi: 10.1021/nn405267r. [DOI] [PubMed] [Google Scholar]
- 6.Liu X, Bao L, Dipalo M, De Angelis F, Zhang X. Formation and dissolution of microbubbles on highly-ordered plasmonic nanopillar arrays. Sci Rep. 2015;5:18515. doi: 10.1038/srep18515. [DOI] [PMC free article] [PubMed] [Google Scholar]
- 7.Zhao C, et al. Theory and experiment on particle trapping and manipulation via optothermally generated bubbles. Lab Chip. 2014;14:384–391. doi: 10.1039/c3lc50748c. [DOI] [PMC free article] [PubMed] [Google Scholar]
- 8.Lin L, et al. Bubble-pen lithography. Nano Lett. 2016;16:701–708. doi: 10.1021/acs.nanolett.5b04524. [DOI] [PMC free article] [PubMed] [Google Scholar]
- 9.Lapotko D. Plasmonic nanoparticle-generated photothermal bubbles and their biomedical applications. Nanomedicine. 2009;4:813–845. doi: 10.2217/nnm.09.59. [DOI] [PMC free article] [PubMed] [Google Scholar]
- 10.Emelianov SY, Li PC, O’Donnell M. Photoacoustics for molecular imaging and therapy. Phys Today. 2009;62:34–39. doi: 10.1063/1.3141939. [DOI] [PMC free article] [PubMed] [Google Scholar]
- 11.Baffou G, Quidant R. Thermo-plasmonics: Using metallic nanostructures as nano-sources of heat. Laser Photon Rev. 2013;7:171–187. [Google Scholar]
- 12.Shao J, et al. Near-infrared-activated nanocalorifiers in microcapsules: Vapor bubble generation for in vivo enhanced cancer therapy. Angew Chem Int Ed. 2015;54:12782–12787. doi: 10.1002/anie.201506115. [DOI] [PubMed] [Google Scholar]
- 13.Liu HL, Fan CH, Ting CY, Yeh CK. Combining microbubbles and ultrasound for drug delivery to brain tumors: Current progress and overview. Theranostics. 2014;4:432–444. doi: 10.7150/thno.8074. [DOI] [PMC free article] [PubMed] [Google Scholar]
- 14.Neumann O, et al. Compact solar autoclave based on steam generation using broadband light-harvesting nanoparticles. Proc Natl Acad Sci USA. 2013;110:11677–11681. doi: 10.1073/pnas.1310131110. [DOI] [PMC free article] [PubMed] [Google Scholar]
- 15.Boriskina S, Ghasemi H, Chen G. Plasmonic materials for energy: From physics to applications. Mater Today. 2013;16:375–386. [Google Scholar]
- 16.Ghasemi H, et al. Solar steam generation by heat localization. Nat Commun. 2014;5:4449. doi: 10.1038/ncomms5449. [DOI] [PubMed] [Google Scholar]
- 17.Guo A, Fu Y, Wang G, Wang X. Diameter effect of gold nanoparticles on photothermal conversion for solar steam generation. RSC Adv. 2017;7:4815–4824. [Google Scholar]
- 18.Baffou G, Polleux J, Rigneault H, Monneret S. Super-heating and micro-bubble generation around plasmonic nanoparticles under CW illumination. J Phys Chem C. 2014;118:4890–4898. [Google Scholar]
- 19.Chen J, et al. Dynamics of transient microbubbles generated by fs-laser irradiation of plasmonic micropyramids. Appl Phys Lett. 2017;110:153102. [Google Scholar]
- 20.Wang Y, et al. Vapor and gas-bubble growth dynamics around laser-irradiated, water-immersed plasmonic nanoparticles. ACS Nano. 2017;11:2045–2051. doi: 10.1021/acsnano.6b08229. [DOI] [PubMed] [Google Scholar]
- 21.Sun C, Can E, Dijkink R, Lohse D, Prosperetti A. Growth and collapse of a vapour bubble in a microtube: The role of thermal effects. J Fluid Mech. 2009;632:5–16. [Google Scholar]
- 22.Tagawa Y, et al. Highly focused supersonic microjets. Phys Rev X. 2012;2:031002. [Google Scholar]
- 23.Zwaan E, Le Gac S, Tsuji K, Ohl CD. Controlled cavitation in microfluidic systems. Phys Rev Lett. 2007;98:254501. doi: 10.1103/PhysRevLett.98.254501. [DOI] [PubMed] [Google Scholar]
- 24.Quinto-Su PA, Venugopalan V, Ohl CD. Generation of laser-induced cavitation bubbles with a digital hologram. Opt Express. 2008;16:18964–18969. doi: 10.1364/oe.16.018964. [DOI] [PMC free article] [PubMed] [Google Scholar]
- 25.Prosperetti A. Vapor bubbles. Annu Rev Fluid Mech. 2017;49:221–248. [Google Scholar]
- 26.Lukianova-Hleb E, et al. Plasmonic nanobubbles as transient vapor nanobubbles generated around plasmonic nanoparticles. ACS Nano. 2010;4:2109–2123. doi: 10.1021/nn1000222. [DOI] [PMC free article] [PubMed] [Google Scholar]
- 27.Lombard J, Biben T, Merabia S. Kinetics of nanobubble generation around overheated nanoparticles. Phys Rev Lett. 2014;112:105701. doi: 10.1103/PhysRevLett.112.105701. [DOI] [PubMed] [Google Scholar]
- 28.Hou L, Yorulmaz M, Verhart NR, Orrit M. Explosive formation and dynamics of vapor nanobubbles around a continuously heated gold nanosphere. New J Phys. 2015;17:013050. [Google Scholar]
- 29.Lombard J, Biben T, Merabia S. Threshold for vapor nanobubble generation around plasmonic nanoparticles. J Phys Chem C. 2017;121:15402–15415. [Google Scholar]
- 30.Chin CT, et al. Brandaris 128: A digital 25 million frames per second camera with 128 highly sensitive frames. Rev Sci Instrum. 2003;74:5026–5034. [Google Scholar]
- 31.Gelderblom EC, et al. Brandaris 128 ultra-high-speed imaging facility: 10 years of operation, updates, and enhanced features. Rev Sci Instrum. 2012;83:103706. doi: 10.1063/1.4758783. [DOI] [PubMed] [Google Scholar]
- 32.Adleman JR, Boyd DA, Goodwin DG, Psaltis D. Heterogenous catalysis mediated by plasmon heating. Nano Lett. 2009;9:4417–4423. doi: 10.1021/nl902711n. [DOI] [PubMed] [Google Scholar]
- 33.Skripov VP, Pavlov PA. Explosive boiling of liquids and fluctuation nucleus formation. High Temp. 1970;8:782. [Google Scholar]
- 34.Skripov VP. Metastable Liquids. Wiley; New York: 1974. [Google Scholar]
- 35.Blander M, Katz JL. Bubble nucleation in liquids. AIChE J. 1975;21:833–848. [Google Scholar]
- 36.Puchinskis SE, Skripov PV. The attainable superheat: From simple to polymeric liquids. Int J Thermophys. 2001;22:1755–1768. [Google Scholar]
- 37.Caupin F, Herbert E. Cavitation in water: A review. C R Phys. 2006;7:1000–1017. [Google Scholar]
- 38.Brennen CE. Cavitation and Bubble Dynamics. Oxford Univ Press; Oxford: 1995. [Google Scholar]
- 39.Le-The H, et al. Shrinkage control of photoresist for large-area fabrication of sub-30 nm periodic nanocolumns. Adv Mater Tech. 2017;2:1600238. [Google Scholar]
Associated Data
This section collects any data citations, data availability statements, or supplementary materials included in this article.


