

Abstract
Renal DNase I is lost in advanced stages of lupus nephritis. Here, we determined if loss of renal DNase I reflects a concurrent loss of urinary DNase I, and whether absence of urinary DNase I predicts disease progression. Mouse and human DNase I protein and DNase I endonuclease activity levels were determined by western blot, gel, and radial activity assays at different stages of the murine and human forms of the disease. Cellular localization of DNase I was analyzed by immunohistochemistry, immunofluorescence, confocal microscopy, and immunoelectron microscopy. We further compared DNase I levels in human native and transplanted kidneys to determine if the disease depended on autologous renal genes, or whether the nephritic process proceeded also in transplanted kidneys. The data indicate that reduced renal DNase I expression level relates to serious progression of lupus nephritis in murine, human native, and transplanted kidneys. Notably, silencing of renal DNase I correlated with loss of DNase I endonuclease activity in the urine samples. Thus, urinary DNase I levels may therefore be used as a marker of lupus nephritis disease progression and reduce the need for renal biopsies.
Keywords: lupus nephritis, DNase I, urine, biomarker, biopsy
Introduction
Lupus nephritis is a severe manifestation of systemic lupus erythematosus (SLE), and is characterized by autoantibody‐mediated activation of inflammatory response in the kidney 1, reviewed in 2, 3. As many as 25–50% of SLE patients eventually develop lupus nephritis. Despite new targeted therapies in recent years, up to 25% of lupus nephritis patients develop fulminant renal failure 4, 5. There are no unifying concepts available to explain lupus nephritis as it appears in mouse models or in human forms of SLE (discussed in 6).
Our studies have demonstrated that chromatin fragments and antichromatin antibodies are central elements in both murine 7, 8, 9 and human 10 lupus nephritis 6, 11. In particular, we have demonstrated that progression of lupus nephritis is linked to an acquired loss of the dominant renal endonuclease DNase I 8. Reduced DNase I levels lead to impaired fragmentation and elimination of chromatin, resulting in accumulation of chromatin fragments in complex with chromatin‐specific autoantibodies 12. This may lead to severe disease progression 8, 13, 14, reviewed in 11. Therefore, there is a strong need to determine if, and eventually how, the presence of DNase I protects against lupus nephritis progression, and why the absence of renal DNase I promotes serious evolution of lupus nephritis in patients who produce antichromatin antibodies. In this context, we need to determine the regulation and subtle role(s) of renal expression of DNase I per se, and if DNase I has different functions in other organs. It is, for example, likely that serum and urinary DNase I have dissimilar origins and presumably subtly different functions. Mouse serum DNase I originates at least partly in the liver and urinary DNase I originates in the kidney 15, 16.
Here, we have compared expression profiles of renal DNase I in murine lupus nephritis with the human counterpart of the disease. We have further compared DNase I expression profiles in native versus transplanted kidneys to determine whether the disease depends on autologous renal genes. Most importantly, we have investigated expression levels of DNase I in urine and renal sections in order to determine if the expression levels of DNase I in urine reflect the renal DNase I expression levels. Thus, we will (i) describe whether the nephritic process linked to silencing of the renal DNASE1 gene is a dominant process in lupus nephritis; (ii) determine if the nephritic process as reflected by silencing of renal DNase I expression is similar or identical in native and transplanted kidneys; and (iii) reveal if renal DNase I expression levels reflect amount of DNase I secreted into the urine. If so, progressively reduced levels of urinary DNase I may indicate disease progression, and, at the same time, reduce the need for renal biopsies.
Materials and methods
Ethic statements
The National Animal Research Authority approved the mouse project (ID: 07/11167, ID‐178). Coherent analyses on native and transplanted renal biopsies, serum, and urine samples were approved by The Scientific Ethical Committee of Lund, Sweden 7, the Norwegian Regional Committee for Medical and Health Research Ethics in South East and North (REC references S‐07030b and 2014/1899, respectively), and by the IRB Milano Area B (15/07/2014). Informed written consent was given by the patients.
Mouse tissue, serum, and urine samples
Female lupus prone (NZBxNZW)F1 mice (The Jackson Laboratory, Bar Harbor, ME, USA) were used for renal tissue, blood, and urine collection. In total, 24 mice were included in this study. The mice were collected and divided into groups depending on their developmental stage of lupus nephritis. The disease stages were determined based on electron microscopic analysis of chromatin‐IgG deposits in the glomeruli of the specific mice used in this study. Group 1 mice (n = 13) had no glomerular deposits of chromatin or IgG, Group 2 mice (n = 7) had mesangial deposits of chromatin‐IgG complexes, whereas Group 3 mice (n = 4) had deposits of chromatin‐IgG complexes in the mesangium and in the glomerular basement membranes (GBM). Baseline data of these mice are presented by Fenton and Fismen et al (2009) 13. The renal tissue was either fixed in depolymerized paraformaldehyde for immunoelectron microscopy (IEM) analysis, fixed in formalin, and paraffin‐embedded for immunohistochemistry (IHC) analyses, snap frozen for protein extraction, or embedded in Tissue Tech optimum cutting temperature (OCT) (FL, USA) for immunofluorescence (IF) analysis. Urine and serum samples were collected and stored at −80 °C prior to protein and endonuclease activity analyses.
Human tissue samples
Human renal biopsies were classified for lupus nephritis following the International Society of Nephrology/Renal Pathology Society (ISN/RPS) 2003 guidelines 17. As controls, we used renal tissue from patients undergoing nephrectomy for cancer and granulomatosis with polyangiitis (Wegener's granulomatosis). The tissue was taken from a macroscopically unaffected area of the kidney. Background data on the transplanted kidneys have been published previously 18.
Human urine samples
We collected urine samples from 58 SLE patients (34 patients with lupus nephritis, 24 patients without lupus nephritis) recruited from the University Hospital of North Norway, North‐Norway Rehabilitation Center, Ospedale Maggiore, Milan, Italy, and IRCCS Istituto Auxologico Italiano Milan, Italy. SLE patients fulfilled the 1997 revised classification criteria of the American College of Rheumatology (ACR) 19. Clinical information including the last renal biopsy was obtained from medical records. In addition, we collected urine samples from 23 healthy volunteers with similar age and sex distribution. Urine samples were centrifuged at 750 × g for 10 min, before storing supernatant at −80 °C. To ensure equal loading for DNase I activity measurements and western blot, a creatinine assay kit (Abcam, Cambridge, UK) was used for normalization of urine samples according to the manufacturer's protocol.
Purification of renal proteins
Proteins were purified from kidneys as previously described 20, 21. In brief, snap frozen renal tissue was homogenized in Tris buffer (0.5m Tris‐HCl, pH 7.5, 0.15m NaCl) before it was centrifuged and the supernatants collected. Thereafter, the pellets were resuspended in heat extraction buffer (50 mm Tris pH 7.5, 0.1m CaCl2, 0.15m NaCl), incubated for 4 min at 60 °C, and centrifuged. The supernatants were combined before the protein concentration was determined using the bicinchoninic acid assay kit (Pierce Biochemicals, IL, USA). The protein solution was used for DNase I activity gel assays.
Antibodies
The following primary antibodies were used in this study: rabbit anti‐DNase I (LS‐B4846; LifeSpan BioSciences, Seattle, WA, USA, sc‐30058; Santa Cruz Biotechnology, Heidelberg, Germany, ab113241; Abcam), mouse anti‐DNase I (sc‐376207; Santa Cruz Biotechnology), and goat anti‐TRAP1 (sc69289; Santa Cruz Biotechnology). Horseradish peroxidase (HRP)‐linked horse anti‐mouse IgG (7076; Cell Signaling Technology, Leiden, The Netherlands), HRP‐conjugated goat anti‐rabbit IgG (65‐6120; Invitrogen, Carlsbad, CA, USA), Alexa 594‐conjugated chicken anti‐rabbit IgG (A‐21442), Alexa 488 F(ab′)2 ‐conjugated goat anti‐rabbit IgG (A‐11070), and Alexa 488‐conjugated donkey anti‐goat IgG (A‐11055) were used as secondary antibodies (all three from Thermo Fisher Scientific, Waltham, MA, USA).
Immunofluorescence microscopy
Frozen five‐micrometer thick OCT compound‐embedded kidneys sections were thawed for 45 min at room temperature before they were fixed for 5 min in 4% paraformaldehyde. The sections were then blocked in 10% goat serum albumin in phosphate‐buffered saline for 30 min, followed by washing, and 30 min of incubation with rabbit anti‐DNase I (LS‐B4846; LifeSpan Biosciences, sc‐30058; Santa Cruz Biotechnology) antibodies, in blocking solution. After incubating with primary antibodies, sections were washed and incubated for 30 min with Alexa 488 F(ab′)2‐conjugated goat anti‐rabbit IgG secondary antibody (Invitrogen). An Olympus BX51 microscope (Olympus, Tokyo, Japan) was used for fluorescence analysis of the sections.
Confocal microscopy
For confocal microscopy analyses, we used rabbit anti‐DNase I (LS‐B4846; LifeSpan BioSciences, sc‐30058; Santa Cruz Biotechnology) and goat anti‐TRAP1 (sc69289; Santa Cruz Biotechnology) as primary antibodies, and Alexa 594‐conjugated chicken anti‐rabbit IgG (A‐21442), and Alexa 488‐conjugated donkey anti‐goat IgG (A‐11055) secondary antibodies (both from Thermo Fisher Scientific). A Zeiss‐LSM510 Meta confocal microscope (Carl Zeiss GmbH, Jena, Germany) was used to analyze the protein expression patterns.
Immunoelectron microscopy
Ultrathin cryosections of kidneys from prenephritic (Group 1), mesangial nephritic (Group 2), or end stage nephritic (Group 3) (NZBxNZW)F1 mice were prepared and processed as described previously 22. DNase I expression was detected by incubating the kidney sections with rabbit anti‐DNase I (LSB4846; LifeSpan BioSciences, sc‐30058; Santa Cruz Biotechnology, ab113241; Abcam) antibody followed by protein A‐conjugated 5‐nm gold particles (PAG‐5 nm; University of Utrecht, The Netherlands). Micrographs were taken at total magnification of 20 000 with the use of a JEM‐1010 transmission electron microscope (Jeol, Tokyo, Japan).
Immunohistochemistry
Immunohistochemical staining of DNase I was performed as described 8, using the EnVision®+ System–HRP (DAB) (K4011; Dako, Glostrup, Danmark) as a detection system and rabbit anti‐DNase I (LS‐B4846; LifeSpan BioSciences, sc‐30058; Santa Cruz Biotechnology, ab113241; Abcam) antibodies.
DNase I activity measurements
DNase I enzymatic activity was analyzed in 10% polyacrylamide gels in DNase I reactivation buffer (40 mm Tris pH 7.6, 2 nm CaCl2, 2 mm Mg Cl2) containing 88 µg/ml heat‐denatured salmon sperm DNA (Invitrogen) for 24 h 15, 23 at 37 °C. Sodium dodecyl sulfate was removed after electrophoresis by washing the gel in MilliQ water with 2% Triton X‐100 for 1 h at room temperature. To check for activity, the gel was stained with Nucleic Acid Gel Stain GelRed™ 730–2958 (VWR International, Oslo, Norway), and visualized under UV illuminator. In addition, a radial diffusion assay 24 was used to measure DNase I activity in 1% agarose gel with 30 µg/ml heat‐denatured salmon sperm DNA (Invitrogen) in the DNase I reaction buffer. The enzyme activity was related to the enzymatic activity of recombinant DNase I in the gel and measured in international units (IUs). One unit of the enzyme completely degrades 1 µg of pUC19 plasmid DNA in 10 min at 37 °C (Thermo Scientific, CA, USA).
Western blot
We performed western blot on mouse urine samples, in addition to human urine samples from healthy controls and SLE patients with and without lupus nephritis. Gel electrophoresis and western blotting were performed according to standard procedures (Thermo‐Scientific). In brief, samples were loaded on 4–12% NuPage gels and membranes were blocked with 5% (w/v) skimmed milk and probed with rabbit anti‐DNase I (LS‐B4846; LifeSpan) or mouse anti‐DNase I (sc‐376207; Santa Cruz) primary antibody. After incubation with HRP‐conjugated goat anti‐rabbit IgG (65‐6120; Invitrogen) or HRP‐linked horse anti‐mouse IgG (7076; Cell Signaling Technology), binding was assayed by chemiluminescence detection (Thermo‐Scientific). Determination of molecular weight was achieved using MagicMark XP molecular weight marker (Invitrogen).
Statistics
Statistical analyses were performed with SPSS version 24. One‐way ANOVA with Games‐Howell post hoc test was used to evaluate differences between groups. P values <0.05 were considered significant.
Results
Renal DNase I enzyme activity and protein levels are normal or elevated in (NZBxNZW)F1 mice belonging to group 1 and group 2, but are reduced or undetectable in group 3 mice
The expression of DNase I protein and endonucleolytic activity in whole kidney samples taken from lupus‐prone (NZBxNZW)F1 mice is abolished at the time electron dense deposits (previously shown to be composed of chromatin and IgG 10) emerge in the GBM. This phenomenon also coincides with the development of severe proteinuria. In accordance with the DNASE1 mRNA expression levels (supplementary material, Table S1), the overall renal DNase I expression was higher in situ for Group 1 and 2 mice as revealed by IHC, IF, IEM, and confocal microscopy, compared with Group 3 mice [Figure 1A, by confocal microscopy DNase I is stained red, Trap1 (a cytoplasmic tracer), is stained green]. The different techniques, reflecting the protein expression of DNase I, show that DNase I is dominantly expressed in tubular cells (Figure 1A and supplementary material, Figure S1). By IEM, we observed binding of anti‐DNase I antibody mainly to mitochondria (Figure 1A and supplementary material, Figure S1). However, although these techniques reveal the tissue distribution and expression of renal DNase I, they do not inform whether the protein is enzymatically active. Therefore, DNase I gel zymography was performed on renal proteins taken from the same groups of mice. The endonuclease activity of DNase I was lowest for Group 3 mice compared with Group 1 and 2 mice (Figure 1B), consistent with the protein expression levels demonstrated in situ (Figure 1A).
Figure 1.
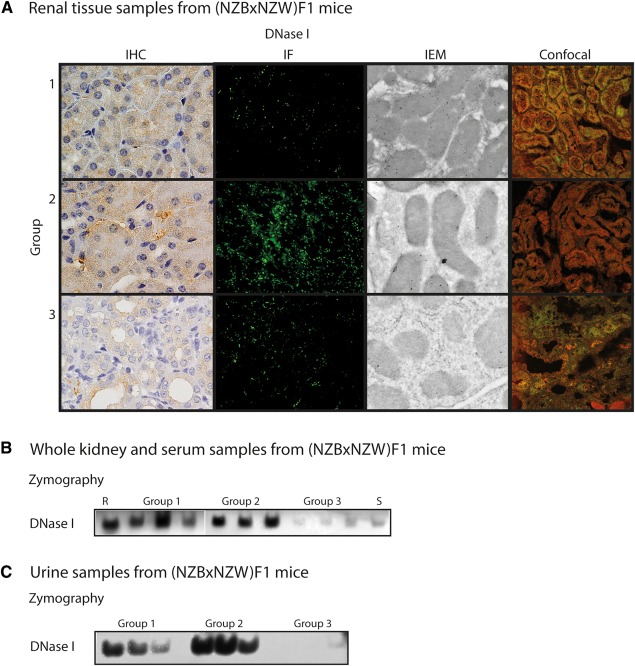
DNase I expression and activity. (A) The protein expression pattern of DNase I in kidney sections from (NZBxNZW)F1 mice as revealed by IHC, IF, IEM, and confocal microscopy (DNase I in red and Trap1 in green as a cytoplasmic marker). (B) DNase I endonuclease activity as revealed by zymography on samples from whole kidney lysates of representative Group 1, 2, and 3 (NZBxNZW)F1 mice, as well as a control (R, recombinant DNase I) and a serum (S) sample. (C) Urinary DNase I endonuclease activity in different groups of (NZBxNZW)F1 mice as revealed by zymography.
In addition, we wanted to reveal expression levels of DNase I in urine of (NZBxNZW)F1 mice to see if they were comparable to renal expression levels. Urinary protein expression and DNase I enzyme activity levels in these mice followed the same pattern as for the whole kidney samples (supplementary material, Figure S2A and Figure 1C, respectively). Interestingly, for Group 3 mice, the ∼38 kDa DNase I band disappeared and was replaced by a ∼62 kDa band. This band had the same size as the DNase I band seen in mouse sera (supplementary material, Figure S2A).
Renal DNase I expression is low in advanced lupus nephritis
We used lupus‐prone (NZBxNZW)F1 mice to study the development of lupus nephritis. However, to determine if the nephritic processes reflect those in human forms of lupus nephritis, we analyzed biopsies from human native kidneys, both by IHC and IEM (Figure 2A and Table 1). In general, DNase I expression followed the profiles determined in progressive murine lupus nephritis. As revealed by immunohistocemistry (Figure 2A), human renal DNase I expression was mostly seen in the nuclei of tubular cells in class IV lupus nephritis. By IEM, we observed reduced DNase I expression in mitochondria, nuclei, and cytoplasm (Figure 2A).
Figure 2.
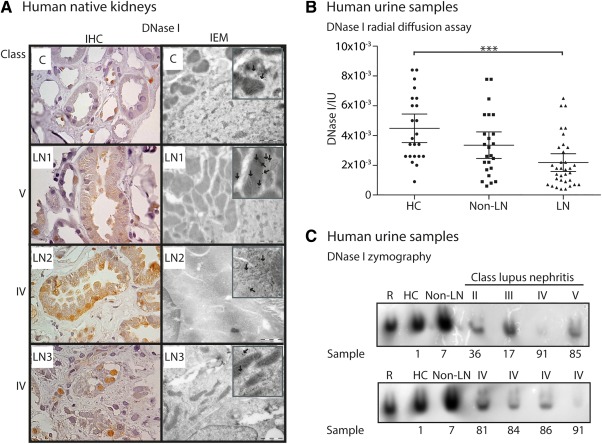
Human autologous DNase I expression and activity. (A) DNase I protein expression as revealed by IHC (left panel) and IEM (right panel) of kidney sections from human patients with different classes of lupus nephritis. Boxed areas are enlarged parts with arrows indicating DNase I labeling. Patient numbers (LN 1–3) are according to Table 1. As a control sample (C), a kidney biopsy from a patient with granulomatosis with polyangiitis (Wegener's granulomatosis) was used. (B) Human urine DNase I activity as revealed by radial diffusion assay. The samples are divided into healthy controls (HC), SLE patients without lupus nephritis (non‐LN) and SLE patients with lupus nephritis (LN). Values are presented as scatter plots with 95% confidence intervals of the mean. Significance: ***p < 0.001. (C) DNase I activity in human urine samples from HC, non‐LN, and LN patients. The LN patients' histology classes (II‐V) are indicated. Patient sample numbers are according to supplementary material, Tables S2 and S3. R: recombinant DNase I.
Table 1.
Basic clinical and histological data on human lupus sections used in this study
| No | Age/sex | LN class | ACR criteria* | CLIFT# | Proteinuria (g/24‐h) | Treatment |
|---|---|---|---|---|---|---|
| LN1 | 41/F | V | 3, 7, 9–11 | neg | 2 | CQ, GC, CYA |
| LN2 | 35/F | IV | 1, 6, 7, 9–11 | neg | 1.4 | CQ, MMF |
| LN3 | 34/F | IV | 1, 6, 7, 10, 11 | neg | 8 | GC |
Modified from Kalaaji et al (2007) [10].
LN, lupus nephritis; *The ACR criteria are listed according to their numbers [17], #CLIFT, Crithida luciliae immunofluorescent test; CQ, Chloroquine; GC, Glucocorticoid; CYA, Cyclosporine A; MMF, Mycophenolate.
Urinary DNase I activity is low in patients with lupus nephritis
Silencing of renal DNase I is linked to progressive lupus nephritis. Therefore, we analyzed the activity, presence or absence of the ∼38 kDa DNase I 25 in the urine of healthy controls and SLE patients with and without lupus nephritis (Figure 2B and supplementary material, Figure S2B). The 38 kDa DNase I band in urine corresponded to renal DNase I linked to severity of the disease in lupus‐prone mice. Clinical profiles are presented in Table 2, and supplementary material, Tables S2 and S3. A significant difference was observed in the activity level of DNase I in healthy controls compared to SLE patients with lupus nephritis (Figure 2B). In addition, we observed that urinary DNase I endonuclease activity was low for patients with class III, IV, or V lupus nephritis, corresponding to the DNase I level in the urine (Figure 2C and supplementary material, Figure S2B). DNase I activity levels were severely reduced particularly for lupus nephritis class IV (supplementary material, Table S2). Increasing proteinuria did not lead to increased 38 kDa DNase I activity in the urine (Figure 2C and supplementary material, Table S2).
Table 2.
Profile data on human urine samples used in this study
| HC | Non‐LN | LN | |
|---|---|---|---|
| Group | Healthy controls | SLE without LN | SLE with LN |
| Number | 23 | 24 | 34 |
| Mean age (range) | 41.5 (21–72) | 49.5 (30–69) | 41.7 (20–73) |
| Sex ratio (female:male) | 19:4 | 24:0 | 25:9 |
| Low complement | – | no (19), yes (4), n.d. (1) | no (22), yes (12) |
| Anti‐dsDNA titre | – | neg (19), pos (4), n.d. (1) | neg (14), pos (20) |
| #Proteinuria | None (23) | None (21), microalbuminuria (3) | None (6), microalbuminuria (7), proteinuria (19), nephrotic proteinuria (2) |
| Mean SLEDAI (range) | – | 3.9 (0–14) | 8.9 (0–26) |
| LN class | – | – |
II (4), III (6), III+V (1) IV (14), IV+V (3), V (6) |
| Treatments | ACE‐I (2) | CQ (17), GC (7), ASA (6), BB (6), AZA (5), CCB (3), ARB (1), BAFF‐I (1), LD (1), MMF (1), MTX (1), WRF (1) | GC (24), CQ (21), MMF (16), ACE‐I (7), ARB (7), AZA (5), BAFF‐I (1), CCB (1), CY (1), NOAC (1) |
HC, Healthy controls; LN, Lupus nephritis; SLE, Systemic lupus erythematosus; n.d., not determined; #Proteinuria is scored according to 24‐h quantification or albumin‐creatinine ratio (ACR): Score 0: 0–0.03 g/24‐h or ACR 0–3. Score 1 (microalbuminuria): 0.03–0.3 g/24‐h or ACR 3–30. Score 2 (proteinuria): 0.3–3 g/24‐h or ACR 30–300. Score 3 (nephrotic proteinuria): >3 g/24‐h or ACR >300. SLEDAI, Systemic Lupus Erythematosus Disease Activity Index; ACE‐I, Angiotensin converting enzyme inhibitor; CQ,= Chloroquine; GC, Glucocorticoid; ASA, Acetylsalicylic acid; BB, Beta blocker; AZA, Azathioprine, CCB, Calcium channel blocker; ARB, Angiotensin receptor blocker; BAFF‐I, B‐cell activating factor inhibitor; LD, Loop diuretic; MMF, Mycophenolate; MTX, Methotrexate; WFN, Warfarin; CY, Cyclosporine; NOAC, Novel oral anticoagulant.
DNase I expression profiles vary in transplanted kidneys and urine, but not in serum
To further determine if the shut‐down of renal DNase I expression was due to an acquired or inherited cause, we compared the expression of renal DNase I in patients with transplanted kidneys that had or had not suffered from relapse of lupus nephritis. Our hypothesis was that renal DNase I expression levels would reflect disease progression also in transplanted kidneys. Therefore, we stained kidney sections with anti‐DNase I antibody (Figures 3A and B). In general, sections from transplanted kidneys (Figure 3A and B) showed lower DNase I expression levels compared to the control sample (C in Figure 3A). However, the expression levels varied between the samples. In samples Tx‐7 and Tx‐8 (class III and IV lupus nephritis, respectively, see Figure 3B) we saw markedly less DNase I staining compared with the other sections. This is analogous to observations in native kidneys at the same disease stages.
Figure 3.
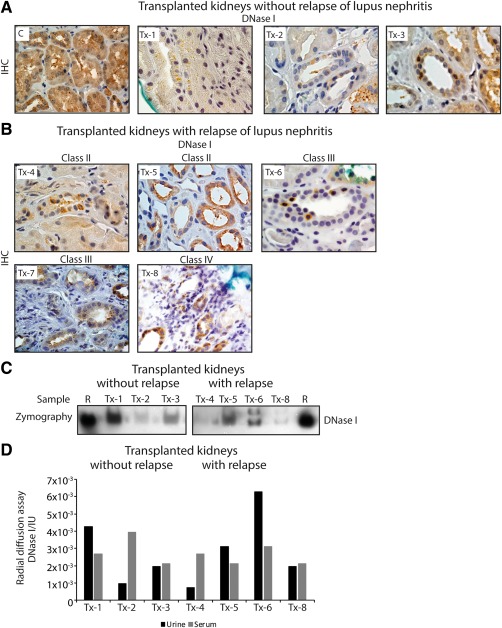
DNase I expression and activity in SLE patients who have undergone kidney transplantation. (A) Renal staining of DNase I on a control kidney section (C) and kidney sections from patients that have not suffered from relapse of lupus nephritis (Tx‐1, Tx‐2, and Tx‐3). (B) DNase I staining on kidney sections from patients who have suffered from relapse of lupus nephritis (Tx‐4, Tx‐5, Tx‐6, Tx‐7, and Tx‐8). (C) Gel zymography of DNase I endonuclease activity in urine from the same patients (except Tx‐7) as in (A) and (B). R: recombinant DNase I. (D) Urine and serum endonuclease activity levels of DNase I as revealed by radial diffusion assay.
In addition, we wanted to relate the observations of renal DNase I staining to urinary activity and expression levels of DNase I. In urine samples from patients with transplanted kidneys, we did not observe a total loss of DNase I activity (Figures 3C and D). The activity varied, and it was only in samples Tx‐4 and Tx‐8 (class II and IV lupus nephritis, respectively, see Figure 3C; samples from patients with relapse of lupus nephritis after transplantation) that we noticed nearly complete loss of DNase I activity. Surprisingly, however, we observed an additional band in samples Tx‐6 and Tx‐8. These patients were both proteinuric and diagnosed with class III and IV lupus nephritis (Table 3). As a control of DNase I activity variation, serum DNase I activity was measured for transplanted kidneys. In general, serum DNase I level did not vary as much as the urine 38 kDa DNase I levels (Figure 3D).
Table 3.
Basic clinical and histological data on human transplanted kidney samples used in this study
| No | Age/ sex | LN class | Low complement | Anti‐dsDNA titre | Proteinuria (g/24‐h) | SLEDAI | Treatment |
|---|---|---|---|---|---|---|---|
| 1 | 21/F | – | No | neg | 0 | 0 | AZA, GC |
| 2 | 47/M | – | No | neg | 0 | 2 | MMF, GC, CYA |
| 3 | 37/F | – | No | neg | 0 | 0 | MMF, GC, TACR |
| 4 | 73/M | II | No | neg | 0 | 0 | MMF, GC, CYA |
| 5 | 27/M | II | No | neg | 0 | 0 | AZA, GC, TACR, SIRO |
| 6 | 66/M | III | Yes | neg | 2.2 | 8 | MMF, GC, CYA |
| 7 | 22/M | III | Yes | neg | 0 | n.d. | MMF, GC, CYA |
| 8 | 73/F | IV | No | neg | 1.4 | 4 | MMF, GC, CYA |
LN, lupus nephritis; SLEDAI, Systemic Lupus Erythematosus Disease Activity Index; n.d., not determined; AZA, Azathioprine; GC, Glucocorticoid; MMF, Mycophenolate; CYA, Cyclosporine A; TACR, Tacrolimus; SIRO, Sirolimus.
Discussion
In this study, we have examined the role of renal DNase I expression and activity levels in progressive lupus nephritis as it appears in lupus‐prone (NZBxNZW)F1 mice, and in human lupus nephritis as it appears in native and transplanted kidneys. We aimed to reveal if we could translate our insight obtained from murine lupus nephritis, as it has accumulated during the last decades 9, 13, 14, 24, to humans, and from native kidneys to transplanted kidneys. Our hypothesis was that the expression of renal DNase I, and thus urinary DNase I as a reflection of renal DNase I expression, would follow disease progression inversely, and that the shut‐down of renal DNase I in advanced lupus nephritis stages was not due to certain autologous renal gene patterns.
There are several techniques available to measure protein expression in tissue sections. In this study, we have compared different techniques revealing DNase I protein expression in mouse kidney sections. The DNase I protein expression follows the mRNA expression levels 13, and is significantly lower for mice with progressive lupus nephritis. This is also true when we add DNase I endonuclease activity levels to the comparison, with end stage organ disease having the lowest levels measured.
If renal DNase I is lost, it cannot break down DNA as it appears in chromatin, and thus renal chromatin fragments may accumulate in the kidney. This and other studies have shown reduced renal DNase I expression and activity levels in mice 13 and in humans with advanced stages of lupus‐like nephritis 26. Here, we demonstrate reduced levels of DNase I in kidneys and urine in advanced stages of lupus nephritis in lupus‐prone (NZB/NZW)F1 mice, as well as in human disease.
Western blot of urine samples from mice showed that the ∼38 kDa band corresponding to recombinant DNase I was completely absent in mice with deposits of chromatin‐IgG complexes in the glomerular basement membrane (Group 3). Instead these samples had an extra band at ∼60 kDa with the same size as serum DNase I. Thus, for Group 3 mice, renal DNase I was lost while serum DNase I was leaked into the urine probably due to increased proteinuria. Serum DNase I showed less endonucleolytic enzyme activity than renal DNase I, explaining the weak DNase I activity seen in Group 3 whole kidney lysate and urine samples. These data are similar to and confirm results published by Koizumi (1996) 16. He found that urinary DNase I levels corresponded well with DNase I levels in the kidney in several mice strains, while serum DNase I levels did not.
In this study, a blind test with human urines from healthy controls and SLE patients with and without lupus nephritis was performed. Urinary DNase I levels were significantly lower in patients with lupus nephritis compared to controls. In the SLE group without lupus nephritis, mean urinary DNase I levels were lower than for the control group and higher than for the lupus nephritis group. One might expect similar urinary DNase I levels in the SLE group without lupus nephritis and the control group. However, as most of these patients have not undergone renal biopsy, one explanation may be that some SLE patients without lupus nephritis actually have silent nephritis 27. Based on our studies in mice, we hypothesized that the human disease progresses through different classes (I–IV), and that patients with lupus nephritis class IV would have overall lowest urinary DNase I levels. However, in this study, there were no significant differences between urinary DNase I levels in patients diagnosed with different lupus nephritis classes. Only six out of 34 patients had renal biopsy taken the same year as the urine sample (supplementary material, Table S2). Thus, previous biopsy information on lupus nephritis class may not be accurate at the time of the urine sample. Still, most patients with lupus nephritis class IV showed DNase I levels below the mean within the group of SLE patients with lupus nephritis. A study with increased numbers of participants and biopsies taken at the same time as the collection of urine samples would give a better answer to the correlation between urinary DNase I levels and lupus nephritis classes. If DNase I in urine is a consequence of glomerular leakage, then the amount of DNase I in urine of these patients should correlate with proteinuria. In Figure 2C and supplementary material, Table S2, we observed that increasing proteinuria did not lead to increased 38 kDa DNase I activity in the urine, most probably because the renal DNase I expression was shut down in the advanced stages of lupus nephritis. Nevertheless, if urinary DNase I levels correlate inversely with disease progression, its absence in the urine can be used as a biomarker for progression of lupus nephritis.
Interestingly, the localization of renal DNase I in humans with class IV lupus nephritis is mostly in the nuclei of tubular cells. Previously we have found that DNase I in nuclei of human renal proximal tubule epithelial cells is enzymatically inactive, and may possess another function besides the endonucleolytic role 28.
To treat end‐stage renal disease in lupus nephritis, renal transplantation is a therapeutic approach. In this study, we have investigated DNase I expression in transplanted kidneys with and without recurrence of lupus nephritis. To reveal if the shut‐down of renal DNase I gene expression is dependent on a certain renal genetic background or if it is fully acquired by extrarenal processes, we analyzed the DNase I expression and activity in kidney sections, urine, and serum from patients who had undergone kidney transplantation. Compared to the normal kidney, all the transplanted kidney sections showed less DNase I staining. In patients without relapse, renal DNase I staining corresponded well to DNase I activity in urine. For the patients with relapse, on the other hand, one of the patients with elevated proteinuria and creatinine level in the urine had the highest activity level of DNase I in the urine while the kidney section did not show the same high level of DNase I expression. This is interesting and does not correspond to results for the patients with renal transplantation without relapse and the patients with native kidneys. In addition, both the proteinuric patients, Tx‐6 and Tx‐8, had an extra band showing DNase I activity in zymography. Serum DNase I activity did not vary much in patients with or without relapse, and is probably not involved in disease progression. However, renal DNase I activity was also abolished in the transplanted kidneys with severe lupus nephritis.
In conclusion, urinary DNase I activity and expression levels correlate inversely with lupus nephritis disease progression. Therefore, we suggest that this protein should be part of a pool of biomarkers that are regularly checked in patients with lupus nephritis. However, further studies with greater numbers of patients must be performed in order to see if renal, urinary DNase I activity and expression levels correlate inversely with flares and with distinct lupus nephritis classes. If a strong correlation is found as described here in the (NZBxNZW)F1 lupus‐prone mice and in patients with lupus nephritis, loss of urinary DNase I protein and endonucleolytic activity will indicate exacerbation of lupus nephritis. If this holds true, the need for repeated renal biopsies can be reduced, reducing risks related to, for example, severe haemorrhage. In addition, our hypothesis that renal DNase I shut‐down in transplanted kidneys is due to extrarenal influences seems to be true, as DNase I in transplanted kidneys follows the same pattern as for lupus‐prone mice and humans with SLE. This may indicate that urine analysis of DNase I with renal origin is an appealing substitute for renal biopsies to determine progression of lupus nephritis.
Author contributions statement
HLP, KDH, DT, NS, and OPR were involved in conception and design of the paper. HLP, KDH, and DT carried out the experiments. All authors contributed to data acquisition, reviewed the manuscript and approved the submitted version.
Supporting information
SUPPLEMENTARY MATERIAL ONLINE
Supplementary figure legends
Figure S1. Electron microscopic detection of renal DNase I expression. Protein expression pattern of DNase I in kidney sections from (NZBxNZW)F1 mice as revealed by immunoelectron microscopy (IEM). The mice are divided into groups according to lupus nephritis disease progression. Group 1 mice have no glomerular deposits of chromatin or IgG, Group 2 mice have mesangial deposits of chromatin‐IgG complexes, and Group 3 mice have deposits of chromatin‐IgG complexes in the mesangium and in the glomerular basement membranes
Figure S2. DNase I expression in urine samples from mice and humans. (A) Western blot of DNase I expression from whole kidney samples of representative Group 1, 2 and 3 (NZBxNZW)F1 mice, and gel zymography to show DNase I endonuclease activity. (B) Western blot of DNase I expression on urine samples from human controls (HC), SLE patients without lupus nephritis (non‐LN) and SLE patients with lupus nephritis (LN); and gel zymography to show DNase I endonuclease activity. Histology classes and sample numbers are indicated on top and bottom of the pictures, respectively. M: marker, S: serum, R: recombinant DNase I
Table S1. Basic data on mice used in this study
Table S2. Profile data on human urine samples from lupus nephritis patients
Table S3. Profile data on human urine samples from SLE patients without lupus nephritis
Acknowledgements
The authors would like to thank Randi Olsen for excellent help with the electron microscopy studies. This project has been made possible by the Norwegian Extra Foundation for Health and Rehabilitation (2013/FOM5607) and the Northern Norway Regional Health Authority (Helse Nord RHF, HNF1343‐17).
Conflict of interest statement: The authors declare that they have not received any financial support or other benefits from commercial sources for the work reported on in the manuscript. Furthermore, they declare that they have no other personal or financial interests that could create a conflict of interest with regard to this work.
References
- 1. Davidson A, Bethunaickan R, Berthier C, et al Molecular studies of lupus nephritis kidneys. Immunol Res 2015; 63: 187–196. [DOI] [PubMed] [Google Scholar]
- 2. Zubair A, Frieri M. Lupus nephritis: review of the literature. Curr Allergy Asthma Rep 2013; 13: 580–586. [DOI] [PubMed] [Google Scholar]
- 3. Podolska MJ, Biermann MH, Maueroder C, et al Inflammatory etiopathogenesis of systemic lupus erythematosus: an update. J Inflamm Res 2015; 8: 161–171. [DOI] [PMC free article] [PubMed] [Google Scholar]
- 4. de Zubiria Salgado A, Herrera‐Diaz C. Lupus nephritis: an overview of recent findings. Autoimmune Dis 2012; 2012: 849684. [DOI] [PMC free article] [PubMed] [Google Scholar]
- 5. Hogan J, Appel GB. Update on the treatment of lupus nephritis. Curr Opin Nephrol Hypertens 2013; 22: 224–230. [DOI] [PubMed] [Google Scholar]
- 6. Rekvig OP, Thiyagarajan D, Pedersen HL, et al Future perspectives on pathogenesis of lupus nephritis: facts, problems, and potential causal therapy modalities. Am J Pathol 2016; 186: 2772–2782. [DOI] [PubMed] [Google Scholar]
- 7. Kalaaji M, Sturfelt G, Mjelle JE,, et al Critical comparative analyses of anti‐alpha‐actinin and glomerulus‐bound antibodies in human and murine lupus nephritis. Arthritis Rheum 2006; 54: 914–926. [DOI] [PubMed] [Google Scholar]
- 8. Seredkina N, Zykova SN, Rekvig OP. Progression of murine lupus nephritis is linked to acquired renal Dnase1 deficiency and not to up‐regulated apoptosis. Am J Pathol 2009; 175: 97–106. [DOI] [PMC free article] [PubMed] [Google Scholar]
- 9. Horvei KD, Pedersen HL, Fismen S, et al Lupus nephritis progression in FcgammaRIIB‐/‐yaa mice is associated with early development of glomerular electron dense deposits and loss of renal DNase I in severe disease. PLoS One 2017; 12: e0188863. [DOI] [PMC free article] [PubMed] [Google Scholar]
- 10. Kalaaji M, Fenton KA, Mortensen ES, et al Glomerular apoptotic nucleosomes are central target structures for nephritogenic antibodies in human SLE nephritis. Kidney Int 2007; 71: 664–672. [DOI] [PubMed] [Google Scholar]
- 11. Seredkina N, Van Der Vlag J, Berden J, et al Lupus nephritis: enigmas, conflicting models and an emerging concept. Molec Med 2013; 19: 161–169. [DOI] [PMC free article] [PubMed] [Google Scholar]
- 12. Mjelle JE, Rekvig OP, Van Der Vlag J, et al Nephritogenic antibodies bind in glomeruli through interaction with exposed chromatin fragments and not with renal cross‐reactive antigens. Autoimmunity 2011; 44: 373–383. [DOI] [PubMed] [Google Scholar]
- 13. Fenton K, Fismen S, Hedberg A, et al Anti‐dsDNA antibodies promote initiation, and acquired loss of renal Dnase1 promotes progression of lupus nephritis in autoimmune (NZBxNZW)F1 mice. PLoS One 2009; 4: e8474. [DOI] [PMC free article] [PubMed] [Google Scholar]
- 14. Seredkina N, Rekvig OP. Acquired loss of renal nuclease activity is restricted to DNase I and is an organ‐selective feature in murine lupus nephritis. Am J Pathol 2011; 179: 1120–1128. [DOI] [PMC free article] [PubMed] [Google Scholar]
- 15. Ludwig S, Mannherz HG, Schmitt S, et al Murine serum deoxyribonuclease 1 (Dnase1) activity partly originates from the liver. Int J Biochem Cell Biol 2009; 41: 1079–1093. [DOI] [PubMed] [Google Scholar]
- 16. Koizumi T. Genetic control of urinary deoxyribonuclease I (DNase I) activity levels in mice. Exp Anim 1996; 45: 245–250. [DOI] [PubMed] [Google Scholar]
- 17. Weening JJ, D'Agati VD, Schwartz MM, et al The classification of glomerulonephritis in systemic lupus erythematosus revisited. J Am Soc Nephrol 2004; 15: 241–250. [DOI] [PubMed] [Google Scholar]
- 18. Norby GE, Strom EH, Midtvedt K, et al Recurrent lupus nephritis after kidney transplantation: a surveillance biopsy study. Ann Rheum Dis 2010; 69: 1484–1487. [DOI] [PubMed] [Google Scholar]
- 19. Hochberg MC. Updating the American College of Rheumatology revised criteria for the classification of systemic lupus erythematosus. Arthritis Rheum 1997; 40: 1725. [DOI] [PubMed] [Google Scholar]
- 20. Woessner JF, Jr. , Quantification of matrix metalloproteinases in tissue samples. Methods Enzymol 1995; 248: 510–528. [DOI] [PubMed] [Google Scholar]
- 21. Tveita AA, Rekvig OP, Zykova SN. Increased glomerular matrix metalloproteinase activity in murine lupus nephritis. Kidney Int 2008; 74: 1150–1158. [DOI] [PubMed] [Google Scholar]
- 22. Bendiksen S, Van Ghelue M, Winkler T, et al Autoimmunity to DNA and nucleosomes in binary tetracycline‐regulated polyomavirus T‐Ag transgenic mice. J Immunol 2004; 173: 7630–7640. [DOI] [PubMed] [Google Scholar]
- 23. Napirei M, Ricken A, Eulitz D, et al Expression pattern of the deoxyribonuclease 1 gene: lessons from the Dnase1 knockout mouse. Biochem J 2004; 380: 929–937. [DOI] [PMC free article] [PubMed] [Google Scholar]
- 24. Macanovic M, Lachmann PJ. Measurement of deoxyribonuclease I (DNase) in the serum and urine of systemic lupus erythematosus (SLE)‐prone NZB/NZW mice by a new radial enzyme diffusion assay. Clin Exp Immunol 1997; 108: 220–226. [DOI] [PMC free article] [PubMed] [Google Scholar]
- 25. Parsiegla G, Noguere C, Santell L, et al The structure of human DNase I bound to magnesium and phosphate ions points to a catalytic mechanism common to members of the DNase I‐like superfamily. Biochemistry 2012; 51: 10250–10258. [DOI] [PubMed] [Google Scholar]
- 26. Fismen S, Thiyagarajan D, Seredkina N, et al Impact of the tumor necrosis factor receptor‐associated protein 1 (Trap1) on renal DNase I shutdown and on progression of murine and human lupus nephritis. Am J Pathol 2013; 182: 688–700. [DOI] [PubMed] [Google Scholar]
- 27. Zabaleta‐Lanz M, Vargas‐Arenas RE, Tápanes F, et al Silent nephritis in systemic lupus erythematosus. Lupus 2003; 12: 26–30. [DOI] [PubMed] [Google Scholar]
- 28. Thiyagarajan D, Rekvig OP, Seredkina N. TNFalpha amplifies DNase I expression in renal tubular cells while IL‐1beta promotes nuclear DNase I translocation in an endonuclease‐inactive form. PLoS One 2015; 10: e0129485. [DOI] [PMC free article] [PubMed] [Google Scholar]
Associated Data
This section collects any data citations, data availability statements, or supplementary materials included in this article.
Supplementary Materials
SUPPLEMENTARY MATERIAL ONLINE
Supplementary figure legends
Figure S1. Electron microscopic detection of renal DNase I expression. Protein expression pattern of DNase I in kidney sections from (NZBxNZW)F1 mice as revealed by immunoelectron microscopy (IEM). The mice are divided into groups according to lupus nephritis disease progression. Group 1 mice have no glomerular deposits of chromatin or IgG, Group 2 mice have mesangial deposits of chromatin‐IgG complexes, and Group 3 mice have deposits of chromatin‐IgG complexes in the mesangium and in the glomerular basement membranes
Figure S2. DNase I expression in urine samples from mice and humans. (A) Western blot of DNase I expression from whole kidney samples of representative Group 1, 2 and 3 (NZBxNZW)F1 mice, and gel zymography to show DNase I endonuclease activity. (B) Western blot of DNase I expression on urine samples from human controls (HC), SLE patients without lupus nephritis (non‐LN) and SLE patients with lupus nephritis (LN); and gel zymography to show DNase I endonuclease activity. Histology classes and sample numbers are indicated on top and bottom of the pictures, respectively. M: marker, S: serum, R: recombinant DNase I
Table S1. Basic data on mice used in this study
Table S2. Profile data on human urine samples from lupus nephritis patients
Table S3. Profile data on human urine samples from SLE patients without lupus nephritis