Abstract
Background
Colorectal cancer (CRC) is a common malignant tumor with high incidence and mortality worldwide. The aim of this study was to evaluate the association between differentially expressed genes (DEGs), which may function as biomarkers for CRC prognosis and therapies, and the clinical outcome in patients with CRC.
Material/Methods
A total of 116 normal mucous tissue and 930 CRC tissue datasets were downloaded from the Gene Expression Omnibus database (GEO) and The Cancer Genome Atlas (TCGA). After screening DEGs based on limma package in R. Gene Ontology (GO) and KEGG enrichment analysis as well as the protein-protein interaction (PPI) networks were performed to predict the function of these DEGs. Meanwhile, Cox proportional hazards regression was used to build a prognostic model of these DEGs. Then, Kaplan-Meier risk analysis was used to test the model in TCGA datasets and validation datasets.
Results
In the present study, 300 DEGs with 100 upregulated genes and 200 downregulated genes were identified. The PPI networks including 162 DEGs and 256 nodes were constructed and 2 modules with high degree were selected. Moreover, 5 genes (MMP1, ACSL6, SMPD1, PPARGC1A, and HEPACAM2) were identified using the Cox proportional hazards stepwise regression. Kaplan-Meier risk curve in the TCGA and validation cohorts showed that high-risk group had significantly poor overall survival than the low-risk group.
Conclusions
Our study provided insights into the mechanisms of CRC formation and found 5 prognostic genes, which could potentially inform further studies and clinical therapies.
MeSH Keywords: Biological Markers; Colorectal Neoplasms; Databases, Genetic; Protein Interaction Maps; Survival Analysis
Background
Colorectal cancer (CRC) is the second common tumor among females and the third among males, with an estimated 1 360 600 new cases and 693 900 related deaths in worldwide [1]. Despite advances in surgery, chemotherapy, as well as the development of molecular targeted therapy [2,3], the mortality of CRC is still increases [4]. This is due to, at least partly, the lack of diagnostic markers for detection of CRC and inefficient treatment of advanced colorectal cancer.
In recent years, significant progresses have been achieved in studying the molecular mechanisms of CRC formation. Mutations in the Wnt signaling pathway were reported as the most frequent cause of CRCs, such as adenomatous polyposis coli (APC). Mutations in APC result in accumulation of β-catenin which subsequently activates transcription of proto-oncogenes [5,6]. In addition, KRAS has been studied and shown to play important roles in the development of colorectal [7]. Low-frequency mutations in KRAS exon 2 were established as potential mechanisms of drug resistance from patients who respond to anti-epidermal growth factor receptor therapies [8]. Meanwhile, with the development of multiple molecular methods, more and more genes are being identified as being associated with this CRC. The genetic variations in interferon, specifically in interferon gamma, and interferon regulatory factors have been associated with the increased risk of developing CRC and decreased survival after diagnosis [9]. Furthermore, upregulated expression of HspB5 was reported to have a positive association with TNM stages of CRC patients [10]. A gene microarray analysis suggested 3 significant signaling pathways (PI3K, p38, and ERK) were involved in HspB5-induced EMT in CRC cells, and which could prompt tumor cell proliferation and invasion [10].
Gene microarray and high-throughput sequence technology make it possible to analyze gene expression profiles during carcinogenesis and cancer progression. We can also identify new prognostic biomarkers based on genes expression profiles and clinical cases [11]. In the present study, differential expression genes (DEGs) were analyzed by estimating gene functions and protein-protein interaction (PPI) networks. We then identified 5 genes signatures with significant prognostic value by using the large clinical data from TCGA. The identified CRC related genes can aid in the discovery of new therapeutic targets for this disease and the prognostic 5 key genes model could be utilized to predict prognosis of patients with CRC.
Material and Methods
Data source
The independent gene datasets (GSE71187 [12], GSE21815 [13], and GSE21510 [14]) with sample-sizes larger than 100 were extracted from the GEO database. RNA-seq datasets with the clinic information of CRC patients were downloaded from TCGA website. A total of 930 CRC tissues and 116 normal controls were analyzed to find DEGs. Validation datasets (GSE38832 [15] and GSE17536 [16], n >100), which include survival information, were download from GEO.
Identification of DEGs
The original datasets were converted into recognizable format in R, the limma package [17] of R was used to normalize and identify DEGs from GEO datasets. The DEGs were selected out according to the criteria: |log (foldchange)|>1.5 and P<0.05. EdgeR package [18,19] of R was performed for the RNA-seq count datasets to find DEGs. The threshold of FDR <0.05 and |log2 (foldchange)| > 1.5 were used to screen out DEGs.
Functional enrichment analysis
The online software Database for Annotation Visualization and Integration Discovery (DAVID, Version 6.8, http://david.abcc.ncifcrf.gov/) [20] and KOBASS (version 3.0, http://kobas.cbi.pku.edu.cn/) [21,22] were used for Gene Ontology (GO) enrichment (P<0.01 was set as the threshold) and Kyoto Encyclopedia of Genes and Genomes (KEGG) pathway functional enrichment (P<0.05 was set as the threshold), respectively.
PPI network construction and analysis
Protein-protein interactions of DEGs were identified by using the Search Tool for the Retrieval of Interacting Genes (STRING, version 10.5, https://string-db.org/) [23], a database which provides physical and functional association of protein. The DEG pairs interaction score >0.4 was selected to construct network. Then the PPIs between DEGs were visualized and analyzed using Cytoscape software (version 3.4) [24]. Furthermore, MCODE [25] was used to identify the modules in the PPI network with the parameters degree cutoff ≥2 and k-core ≥2. Finally, The GO and KEGG pathway enrichment of DEGs in the top 2 modules were performed. P<0.05 and counts >2 were set as the threshold.
Cox proportional hazards model construction and model validation
Expression datasets of fragments per kilobases per million (FPKM) values were download from TCGA. After replacing the zero values with minimum nonzero value divided by 2 in each sample, the expression matrix was log2 transformed in R. Survival package [26] of R was used to construct the Cox univariate regression, DEGs significantly related to survival (P<0.05) were retained for further analyses.
Next, multivariable cox proportional hazards stepwise regression with backward selection was used to build a prognostic model. The prognostic risk score for predicting OS was calculated as: Risk score=∑βi×expGenei (expGene: expression level of gene, β: the regression coefficient derived from the multivariate Cox regression model). Patients were divided into high-risk and low-risk groups by using the median risk score as the cutoff point. Then, proportional assumptions for Cox proportional hazard model were examined by Kaplan-Meier analysis. Receiver operating characteristic (ROC) was plotted and the area under curve (AUC) was calculated by using R package survival ROC [27]. Distribution of risk score, survival status, and gene expression levels of each patient were also analyzed and plotted using the R software.
Lastly, 2 independent datasets, GSE38832 [15] and GSE17536 [16], were used to validate the model of survival by Kaplan-Meier analysis.
Results
DEG analysis
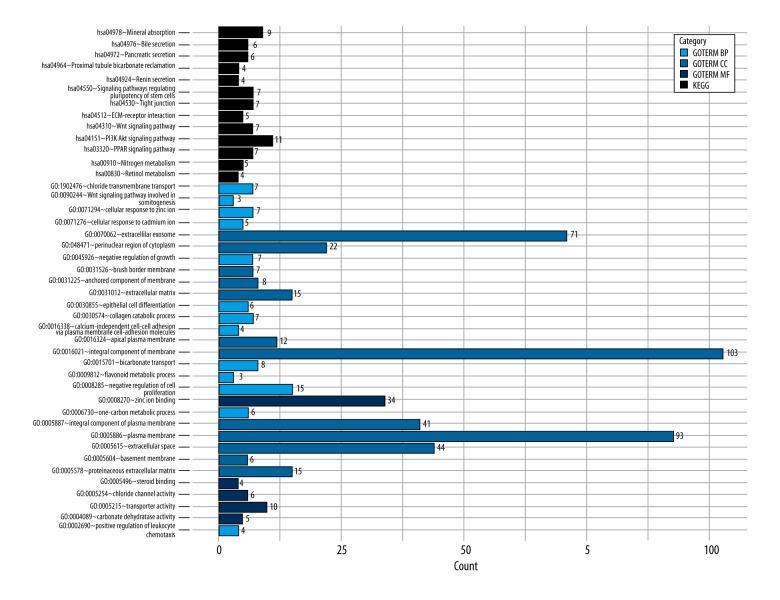
Compared with the normal samples, 360 DEGs from microarray datasets and 3278 DEGs from TCGA RNA-seq datasets were found in the CRC samples; 300 DEGs were found to be overlapped both in microarray and TCGA datasets (Figure 1). GO and KEGG pathway functional enrichment analyses were performed to reveal the functions and mechanisms of DEGs (Figure 2).
Figure 1.
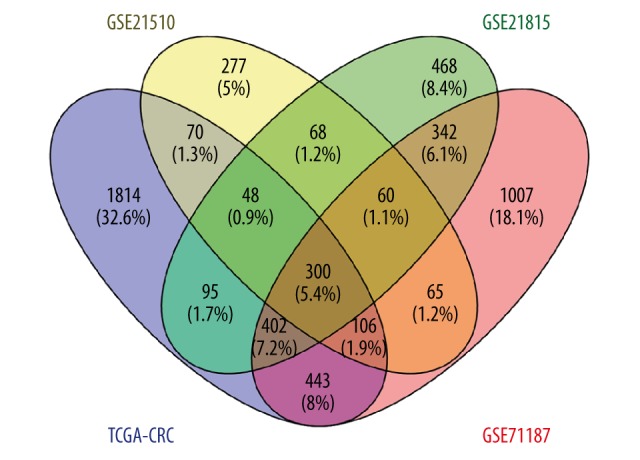
The Venn diagram showing the overlapped genes in four datasets.
Figure 2.
The results of the GO and pathway enrichment analyses of differentially expressed genes (DEGs). BP – biological process; CC – cellular component; MF – molecular function; KEGG – Kyoto Encyclopedia of Genes and Genomes; GO – Gene Ontology.
Construction and analysis of the PPI network
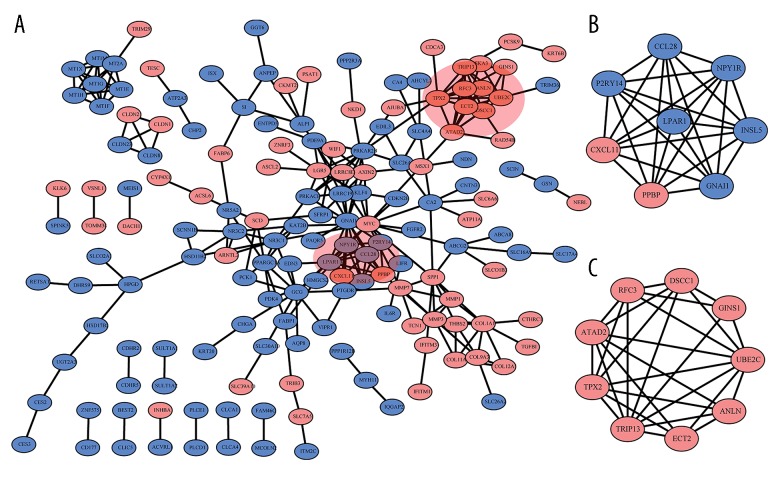
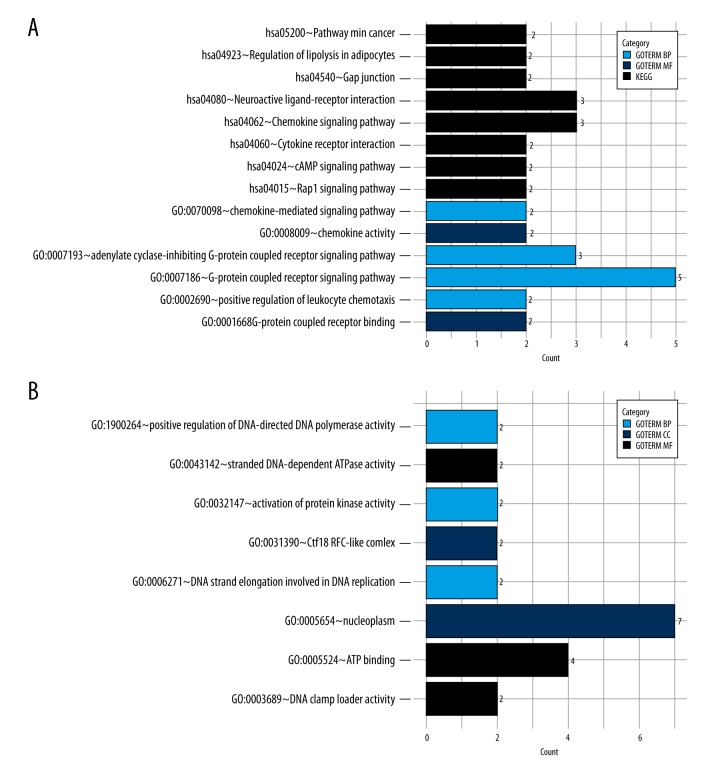
A network containing a total of 162 DEGs and 256 nodes were identified (Figure 3A). Six modules were selected from the network by using MCODE and the top 2 were used for further analysis. Module 1 contained 2 upregulated DEGs (PPBP, CXCL11) and 6 downregulated DEGs (P2RY14, LPAR1, GNAI1, INSL5, NPY1R, CCL28, Figure 3B). Module 2 comprised 9 DEGs (9 upregulated genes), including TPX2, TRIP13, ECT2, ANLN, UBE2C, GINS1, DSCC1, RFC3, ATAD2 (Figure 3C). GO and KEGG pathway enrichment analysis revealed that differential expression genes in module 1 were significantly enriched in the pathway of gap junction (P<0.001), pathways in cancer (P<0.01), as well as the GO terms such as G-protein coupled receptor signaling pathway (P<0.001) and cell chemotaxis (P<0.05, Figure 4A). Moreover, differential expression genes in module 2 were significantly enriched for GO functions, including nucleoplasm (P<0.001), positive regulation of DNA-directed DNA polymerase activity (P<0.01) and ATP binding (P<0.05, Figure 4B).
Figure 3.
The protein-protein interaction (PPI) network and modules identified. (A) PPI network of upregulated differentially expressed genes (DEGs) (red) and downregulated DEGs (blue). (B) Module 1 and (C) module 2 identified in PPI.
Figure 4.
The result of GO and pathway enrichment analyses of module 1 and module2. * BP – biological process; CC – cellular component; MF – molecular function; KEGG – Kyoto Encyclopedia of Genes and Genomes; GO – Gene Ontology.
Identification of survival related DEGs
A total of 24 significant survival-related DEGs (P<0.05) in the TCGA cohorts were identified. Multivariable Cox proportional hazards stepwise regression with backward selection was used to build a prognostic model. Five genes, MMP1, ACSL6, SMPD1, PPARGC1A, and HEPACAM2, which showed a significant P-value, were selected (Table 1).
Table 1.
Multivariate cox regression analysis of overall survival.
| Gene symbol | Coefficient | Hazard ratio (HR) | P value |
|---|---|---|---|
| MMP1 | −0.114 | 0.893 | 0.001 |
| ACSL6 | −0.086 | 0.918 | 0.006 |
| SMPD1 | 0.353 | 1.424 | 0.001 |
| PPARGC1A | −0.181 | 0.835 | 0.001 |
| HEPACAM2 | −0.065 | 0.937 | 0.017 |
Construction Cox regression model and data validation
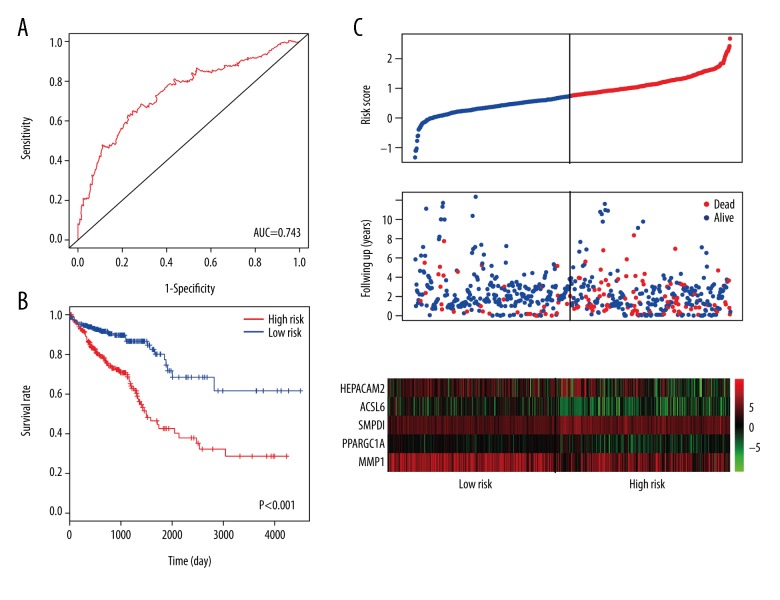
A linear model was calculated with the risk score=(−0.1136× MMP1) + (−0.086×ACSL6) + (0.3534×SMPD1) + (−0.1809× PPARGC1A) + (−0.0647×HEPACAM2). Then, we calculated the risk score for each patient in the datasets. Patients were assigned into high-risk and low-risk groups by using the median risk score as the cutoff point. Kaplan-Meier risk curve revealed that patients in the high-risk group had a significantly shorter overall survival time than patients in the low-risk group (Figure 5A). ROC curve, which stood for the performance of the model, was plotted and the AUC of the risk score was up to 0.743 (Figure 5B). Furthermore, distribution of risk score, survival status, and genes expression level of each patient were also analyzed (Figure 5C).
Figure 5.
Prognostic evaluation of the 5 genes signatures in colorectal cancer (CRC) patients. (A) Kaplan-Meier risk survival curve analysis for overall survival of CRC patients. (B) Receiver operating characteristic (ROC) curve analysis of 5 genes signatures. (C) The distribution of risk score, survival status, and gene expression level of patients.
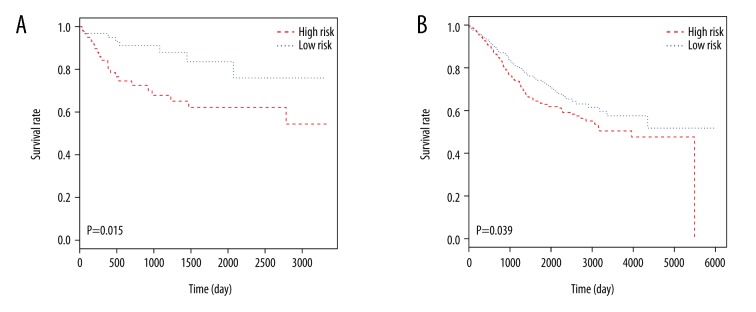
For the verification of our survival model, 2 independent datasets, GSE38832 [15] and GSE17536 [16], were analyzed by Kaplan-Meier risk test (Figure 6). The 5 key genes model for prognosis were also considered effective on 2 independent datasets.
Figure 6.
Kaplan-Meier risk survival analyses of 2 independent datasets. (A) GSE38832 with 122 samples. (B) GSE39582 with 585 samples.
Discussion
In recent decades, considerable efforts have been made to improve the clinical outcome of CRC patients [2,28]. However, CRC is still the leading cause of cancer-related deaths around the world [29]. Because of the heterogeneity of CRC, conventional prognostic systems of pathologic stages often show inefficient prediction for risk of CRC [30]. Many studies have been done to find suitable targets to predict outcomes for CRC patients [31,32]. However, reliable biomarkers and stable prognostic models for prediction prognosis in patients with CRC are still required.
In the present study, a total of 116 normal control tissue samples and 930 CRC tissue samples were retrieved from the GEO and TCGA. A total of 300 DEGs including 100 upregulated and 200 downregulated genes were identified. To demonstrate the molecular function of these abnormal DEGs, we performed GO and KEGG pathway analysis. DEGs were mainly enriched in the PI3K-AKT signaling pathway, PPAR signaling pathway, and WNT signaling pathway. In line with this, it would appear that an abnormal pathway would be a major cause of CRC [33–35]. In addition, DEGs were enriched in the GO terms of extracellular exosome, negative regulation of cell proliferation, and cell-cell adhesion. Strikingly, previous research has revealed the importance of these GO terms. Exosomes are now recognized as important mediators of cell-to-cell communication. Many studies have found exosomes to be important in tumor metastasis and tumor associated immunosuppressive [36,37]. Meanwhile, abnormal negative regulation of cell proliferation includes mutations of MYC. This leads to the unregulated expression of many genes, some of which are involved in cell proliferation and result in the formation of cancer [38]. Furthermore, abnormal cell adhesion has also been correlated with tumor invasion, metastasis, and poor prognosis of patients [39].
Gene expression profiles provide a global view of gene expression and enable identification of critical genes in cancer. However, the occurrence of false discovery results still exists [40]. To avoid false discovery and heterogeneity between different sequencing platforms, we combined 3 microarray datasets and RNA-seq datasets together. Finally, a gene co-expression network containing 162 DEGs were constructed and 2 modules were extracted from the network. Several DEGs in the modules are considered important in the development of CRC. C-X-C motif chemokine ligand 11 (CXCL11) is considered as a chemokine for interleukin-activated T cells. A previous study showed that blockading CXCL11 had an influence on tumor growth and angiogenesis in C57 mice [41]. Meanwhile, microtubule nucleation factor (TPX2) is a spindle assembly factor required for normal assembly of mitotic spindles. TPX2 (20q11) promoted 20q amplicon-driven progression of colorectal adenoma to carcinoma [42]. Moreover, lysophosphatidic acid receptor 1 (LPAR1) is a receptor for lysophosphatidic acid (LPA). LPA1 could enhance DLD1 cell migration, proliferation, adhesion, and secretion of angiogenic factors, all of which are crucial for cancer metastasis [43]. Furthermore, ubiquitin-conjugating enzyme E2C (UBE2C) was reported to be associated with proliferative marker Ki-67, accumulation of cyclin A and a poor overall survival [44].
However, most DEGs were only roughly associated with the CRC, and failed to correlate with prognosis, which plays an important role in the survival rate of patients. To evaluate the association between DEGs and clinical outcome in patients with CRC, Cox univariate regression was carried out on 300 DEGs, and as a result, 24 genes were selected. Then these genes were analyzed by using Cox proportional hazards stepwise regression. Finally, we screened a 5 genes model comprised of MMP1, ACSL6, SMPD1, PPARGC1A, and HEPACAM2. Kaplan-Meier risk survival analysis showed that distinctive separation was observed in survival curves between patient groups with high-risk and low-risk scores. ROC analysis achieved an AUC of 0.743 which demonstrated relatively high sensitivity and specificity of the 5 genes signature model. To test the stability of our model, 2 irrelevant datasets, GSE38832 [15] and GSE17536 [16], were downloaded from GEO for verification of repeatability of our 5 prognostic genes. The 5 key genes were both effective on 2 independent datasets.
Our analysis is likely to provide biological and therapeutic information. Matrix metalloproteinase-1 (MMP-1) functions as an enzyme in the breakdown of extracellular matrix and plays a role in cancer progress [45]. It is the most studied gene of the 5, and is regarded as a biomarker for many cancers, including CRC and gastric cancer [45,46]. Acyl-CoA synthetase long-chain family member 6 (ACSL6) is found in plasma membrane and displays a high activity with fatty acid [47]. ACSL6 was found decreased in most forms of cancers, except CRC [48]. Data analysis revealed that ACSL6 emerged as a potential tumor suppressor gene in leukemia [48]. Sphingomyelin phosphodiesterase 1 (SMPD1) encodes lysosomal acid sphingomyelinase that converts sphingomyelin to ceramide. A previous study found that functional inhibition of acid sphingomyelinase led to tumor cell death by overactivation of hypoxia stress-response pathways [49]. Peroxisome proliferator-activated receptor gamma coactivator 1-α (PPARGC1A or PGC1α) is a transcriptional coactivator able to upregulate mitochondrial biogenesis. PPARGC1A was found to protect against tumorigenesis by regulating the fate of enterocyte cell [50]. HEPACAM family member 2 (HEPACAM2) encodes a protein related to the immunoglobulin superfamily that plays a role in mitosis. HEPACAM was reported downregulated in breast cancer and induced senescence-like growth arrest by elevating the expression levels of senescence-associated proteins p21, p27, and p53 [51].
In summary, we have identified 300 DEGs by analyzing the datasets from GEO and TCGA. Further analysis revealed the function, mechanism, and protein-protein interaction networks of these DEGs. Moreover, 5 prognostic genes that were significantly associated with survival of CRC patients were identified in a large cohort by using Cox multivariate regression analysis. The identification of these DEGs as well as the prognostic genes for CRC will be beneficial for future research and clinical adjuvant therapies. However, larger sample size studies and future basic research are needed to confirm the significance of these DEGs and 5 prognostic genes.
Conclusions
Our study identified critical genes and 5 prognostic biomarkers associated with colorectal cancer, which will be beneficial for future research and clinical therapies.
Acknowledgments
The result shown here were based on the analysis of datasets from TCGA (http://cancergenome.nih.gov/) and GEO (http://www.ncbi.nlm.nih.gov/geo/).
Footnotes
Conflict of interest
None.
Source of support: Self financing
References
- 1.Parkin DM, Bray F, Ferlay J, Pisani P. Global cancer statistics, 2002. Cancer J Clin. 2005;55:74–108. doi: 10.3322/canjclin.55.2.74. [DOI] [PubMed] [Google Scholar]
- 2.Sadanandam A, Lyssiotis CA, Homicsko K, et al. A colorectal cancer classification system that associates cellular phenotype and responses to therapy. Nat Med. 2013;19:619–25. doi: 10.1038/nm.3175. [DOI] [PMC free article] [PubMed] [Google Scholar]
- 3.Colon Cancer Laparoscopic or Open Resection Study Group. Buunen M, Veldkamp R, Hop WC, et al. Survival after laparoscopic surgery versus open surgery for colon cancer: Long-term outcome of a randomised clinical trial. Lancet Oncol. 2009;10:44–52. doi: 10.1016/S1470-2045(08)70310-3. [DOI] [PubMed] [Google Scholar]
- 4.Arnold M, Sierra MS, Laversanne M, et al. Global patterns and trends in colorectal cancer incidence and mortality. Gut. 2017;66(4):683–91. doi: 10.1136/gutjnl-2015-310912. [DOI] [PubMed] [Google Scholar]
- 5.Sameer AS. Colorectal cancer: Molecular mutations and polymorphisms. Front Oncol. 2013;3:114. doi: 10.3389/fonc.2013.00114. [DOI] [PMC free article] [PubMed] [Google Scholar]
- 6.Krausova M, Korinek V. Wnt signaling in adult intestinal stem cells and cancer. Cell Signal. 2014;26:570–79. doi: 10.1016/j.cellsig.2013.11.032. [DOI] [PubMed] [Google Scholar]
- 7.Lievre A, Bachet J-B, Boige V, et al. KRAS mutations as an independent prognostic factor in patients with advanced colorectal cancer treated with cetuximab. J Clin Oncol. 2008;26:374–79. doi: 10.1200/JCO.2007.12.5906. [DOI] [PubMed] [Google Scholar]
- 8.Tougeron D, Lecomte T, Pages J, et al. Effect of low-frequency KRAS mutations on the response to anti-EGFR therapy in metastatic colorectal cancer. Ann Oncol. 2013;24:1267–73. doi: 10.1093/annonc/mds620. [DOI] [PubMed] [Google Scholar]
- 9.Slattery ML, Lundgreen A, Bondurant KL, Wolff RK. Interferon-signaling pathway: Associations with colon and rectal cancer risk and subsequent survival. Carcinogenesis. 2011;32:1660–67. doi: 10.1093/carcin/bgr189. [DOI] [PMC free article] [PubMed] [Google Scholar]
- 10.Li Q, Wang Y, Lai Y, et al. HspB5 correlates with poor prognosis in colorectal cancer and prompts epithelial-mesenchymal transition through ERK signaling. PLoS One. 2017;12:e0182588. doi: 10.1371/journal.pone.0182588. [DOI] [PMC free article] [PubMed] [Google Scholar]
- 11.Shukla S, Evans JR, Malik R, et al. Development of a RNA-Seq based prognostic signature in lung adenocarcinoma. J Natl Cancer Inst. 2016;109(1) doi: 10.1093/jnci/djw200. pii: djw200. [DOI] [PMC free article] [PubMed] [Google Scholar]
- 12.An N, Shi X, Zhang Y, et al. Discovery of a novel immune gene signature with profound prognostic value in colorectal cancer: A model of cooperativity disorientation created in the process from development to cancer. PLoS One. 2015;10:e0137171. doi: 10.1371/journal.pone.0137171. [DOI] [PMC free article] [PubMed] [Google Scholar]
- 13.Iwaya T, Yokobori T, Nishida N, et al. Downregulation of miR-144 is associated with colorectal cancer progression via activation of mTOR signaling pathway. Carcinogenesis. 2012;33:2391–97. doi: 10.1093/carcin/bgs288. [DOI] [PubMed] [Google Scholar]
- 14.Tsukamoto S, Ishikawa T, Iida S, et al. Clinical significance of osteoprotegerin expression in human colorectal cancer. Clin Cancer Res. 2011;17:2444–50. doi: 10.1158/1078-0432.CCR-10-2884. [DOI] [PubMed] [Google Scholar]
- 15.Tripathi MK, Deane NG, Zhu J, et al. Nuclear factor of activated T-cell activity is associated with metastatic capacity in colon cancer. Cancer Res. 2014;74:6947–57. doi: 10.1158/0008-5472.CAN-14-1592. [DOI] [PMC free article] [PubMed] [Google Scholar]
- 16.Freeman TJ, Smith JJ, Chen X, et al. Smad4-mediated signaling inhibits intestinal neoplasia by inhibiting expression of β-catenin. Gastroenterology. 2012;142:562–71.e2. doi: 10.1053/j.gastro.2011.11.026. [DOI] [PMC free article] [PubMed] [Google Scholar]
- 17.Ritchie ME, Phipson B, Wu D, et al. limma powers differential expression analyses for RNA-sequencing and microarray studies. Nucleic Acids Res. 2015;43:e47. doi: 10.1093/nar/gkv007. [DOI] [PMC free article] [PubMed] [Google Scholar]
- 18.McCarthy DJ, Chen Y, Smyth GK. Differential expression analysis of multifactor RNA-Seq experiments with respect to biological variation. Nucleic Acids Res. 2012;40:4288–97. doi: 10.1093/nar/gks042. [DOI] [PMC free article] [PubMed] [Google Scholar]
- 19.Robinson MD, McCarthy DJ, Smyth GK. edgeR: A Bioconductor package for differential expression analysis of digital gene expression data. Bioinformatics. 2010;26:139–40. doi: 10.1093/bioinformatics/btp616. [DOI] [PMC free article] [PubMed] [Google Scholar]
- 20.Huang DW, Sherman BT, Lempicki RA. Systematic and integrative analysis of large gene lists using DAVID bioinformatics resources. Nat Protoc. 2009;4:44. doi: 10.1038/nprot.2008.211. [DOI] [PubMed] [Google Scholar]
- 21.Wu J, Mao X, Cai T, et al. KOBAS server: A web-based platform for automated annotation and pathway identification. Nucleic Acids Res. 2006;34:W720–24. doi: 10.1093/nar/gkl167. [DOI] [PMC free article] [PubMed] [Google Scholar]
- 22.Xie C, Mao X, Huang J, et al. KOBAS 2.0: A web server for annotation and identification of enriched pathways and diseases. Nucleic Acids Res. 2011;39:W316–22. doi: 10.1093/nar/gkr483. [DOI] [PMC free article] [PubMed] [Google Scholar]
- 23.Szklarczyk D, Morris JH, Cook H, et al. The STRING database in 2017: Quality-controlled protein–protein association networks, made broadly accessible. Nucleic acids Res. 2017;45:D362–68. doi: 10.1093/nar/gkw937. [DOI] [PMC free article] [PubMed] [Google Scholar]
- 24.Smoot ME, Ono K, Ruscheinski J, et al. Cytoscape 2.8: New features for data integration and network visualization. Bioinformatics. 2010;27:431–32. doi: 10.1093/bioinformatics/btq675. [DOI] [PMC free article] [PubMed] [Google Scholar]
- 25.Bader GD, Hogue CW. An automated method for finding molecular complexes in large protein interaction networks. BMC Bioinformatics. 2003;4:2. doi: 10.1186/1471-2105-4-2. [DOI] [PMC free article] [PubMed] [Google Scholar]
- 26.Aalen OO. A linear regression model for the analysis of life times. Stat Med. 1989;8:907–25. doi: 10.1002/sim.4780080803. [DOI] [PubMed] [Google Scholar]
- 27.Heagerty PJ, Zheng Y. Survival model predictive accuracy and ROC curves. Biometrics. 2005;61:92–105. doi: 10.1111/j.0006-341X.2005.030814.x. [DOI] [PubMed] [Google Scholar]
- 28.Meyerhardt JA, Mayer RJ. Systemic therapy for colorectal cancer. N Engl J Med. 2005;352:476–87. doi: 10.1056/NEJMra040958. [DOI] [PubMed] [Google Scholar]
- 29.Torre LA, Siegel RL, Ward EM, Jemal A. Global cancer incidence and mortality rates and trends – an update. Cancer Epidemiol Biomarkers Prev. 2016;25:16–27. doi: 10.1158/1055-9965.EPI-15-0578. [DOI] [PubMed] [Google Scholar]
- 30.Linnekamp JF, Wang X, Medema JP, Vermeulen L. Colorectal cancer heterogeneity and targeted therapy: a case for molecular disease subtypes. Cancer Res. 2015;75:245–49. doi: 10.1158/0008-5472.CAN-14-2240. [DOI] [PubMed] [Google Scholar]
- 31.Liu D-R, Guan Q-L, Gao M-T, et al. miR-1260b is a potential prognostic biomarker in colorectal cancer. Med Sci Monit. 2016;22:2417–23. doi: 10.12659/MSM.898733. [DOI] [PMC free article] [PubMed] [Google Scholar]
- 32.Dong S-j, Cai X-j, Li S-j. The clinical significance of MiR-429 as a predictive biomarker in colorectal cancer patients receiving 5-fluorouracil treatment. Med Sci Monit. 2016;22:3352–61. doi: 10.12659/MSM.900674. [DOI] [PMC free article] [PubMed] [Google Scholar]
- 33.Kersten S, Desvergne B, Wahli W. Roles of PPARs in health and disease. Nature. 2000;405:421–24. doi: 10.1038/35013000. [DOI] [PubMed] [Google Scholar]
- 34.Johnson SM, Gulhati P, Rampy BA, et al. Novel expression patterns of PI3K/Akt/mTOR signaling pathway components in colorectal cancer. J Am Coll Surg. 2010;210:767–76. doi: 10.1016/j.jamcollsurg.2009.12.008. [DOI] [PMC free article] [PubMed] [Google Scholar]
- 35.Bienz M, Clevers H. Linking colorectal cancer to Wnt signaling. Cell. 2000;103:311–20. doi: 10.1016/s0092-8674(00)00122-7. [DOI] [PubMed] [Google Scholar]
- 36.Ji H, Greening DW, Barnes TW, et al. Proteome profiling of exosomes derived from human primary and metastatic colorectal cancer cells reveal differential expression of key metastatic factors and signal transduction components. Proteomics. 2013;13:1672–86. doi: 10.1002/pmic.201200562. [DOI] [PubMed] [Google Scholar]
- 37.Taylor DD, Gercel-Taylor C. Exosomes/microvesicles: mediators of cancer-associated immunosuppressive microenvironments. Semin Immunopathol. 2011;33(5):441–54. doi: 10.1007/s00281-010-0234-8. [DOI] [PubMed] [Google Scholar]
- 38.Pomerantz MM, Ahmadiyeh N, Jia L, et al. The 8q24 cancer risk variant rs6983267 shows long-range interaction with MYC in colorectal cancer. Nat Genet. 2009;41:882–84. doi: 10.1038/ng.403. [DOI] [PMC free article] [PubMed] [Google Scholar]
- 39.Mulder J-W, Sewnath M, Offerhaus G, et al. Colorectal cancer prognosis and expression of exon-v6-containing CD44 proteins. Lancet. 1994;344:1470–72. doi: 10.1016/s0140-6736(94)90290-9. [DOI] [PubMed] [Google Scholar]
- 40.Glickman ME, Rao SR, Schultz MR. False discovery rate control is a recommended alternative to Bonferroni-type adjustments in health studies. J Clin Epidemiol. 2014;67:850–57. doi: 10.1016/j.jclinepi.2014.03.012. [DOI] [PubMed] [Google Scholar]
- 41.Rupertus K, Sinistra J, Scheuer C, et al. Interaction of the chemokines I-TAC (CXCL11) and SDF-1 (CXCL12) in the regulation of tumor angiogenesis of colorectal cancer. Clin Exp Metastasis. 2014;31:447–59. doi: 10.1007/s10585-014-9639-4. [DOI] [PubMed] [Google Scholar]
- 42.Sillars-Hardebol AH, Carvalho B, Tijssen M, et al. TPX2 and AURKA promote 20q amplicon-driven colorectal adenoma to carcinoma progression. Gut. 2012;61:1568–75. doi: 10.1136/gutjnl-2011-301153. [DOI] [PubMed] [Google Scholar]
- 43.Shida D, Kitayama J, Yamaguchi H, et al. Lysophosphatidic acid (LPA) enhances the metastatic potential of human colon carcinoma DLD1 cells through LPA1. Cancer Res. 2003;63:1706–11. [PubMed] [Google Scholar]
- 44.Bavi P, Uddin S, Ahmed M, et al. Bortezomib stabilizes mitotic cyclins and prevents cell cycle progression via inhibition of UBE2C in colorectal carcinoma. Am J Pathol. 2011;178:2109–20. doi: 10.1016/j.ajpath.2011.01.034. [DOI] [PMC free article] [PubMed] [Google Scholar]
- 45.Sunami E, Tsuno N, Osada T, et al. MMP-1 is a prognostic marker for hematogenous metastasis of colorectal cancer. Oncologist. 2000;5:108–14. doi: 10.1634/theoncologist.5-2-108. [DOI] [PubMed] [Google Scholar]
- 46.Fujimoto D, Hirono Y, Goi T, et al. Prognostic value of protease-activated receptor-1 (PAR-1) and matrix metalloproteinase-1 (MMP-1) in gastric cancer. Anticancer Res. 2008;28:847–54. [PubMed] [Google Scholar]
- 47.Lopes-Marques M, Cunha I, et al. Diversity and history of the long-chain acyl-CoA synthetase (Acsl) gene family in vertebrates. BMC Evol Biol. 2013;13:271. doi: 10.1186/1471-2148-13-271. [DOI] [PMC free article] [PubMed] [Google Scholar]
- 48.Chen W-C, Wang C-Y, Hung Y-H, et al. Systematic analysis of gene expression alterations and clinical outcomes for long-chain acyl-coenzyme A synthetase family in cancer. PLoS One. 2016;11:e0155660. doi: 10.1371/journal.pone.0155660. [DOI] [PMC free article] [PubMed] [Google Scholar]
- 49.Klutzny S, Lesche R, Keck M, et al. Functional inhibition of acid sphingomyelinase by Fluphenazine triggers hypoxia-specific tumor cell death. Cell Death Dis. 2017;8:e2709. doi: 10.1038/cddis.2017.130. [DOI] [PMC free article] [PubMed] [Google Scholar]
- 50.D’Errico I, Salvatore L, Murzilli S, et al. Peroxisome proliferator-activated receptor-γ coactivator 1-α (PGC1α) is a metabolic regulator of intestinal epithelial cell fate. Proc Natl Acad Sci. 2011;108:6603–8. doi: 10.1073/pnas.1016354108. [DOI] [PMC free article] [PubMed] [Google Scholar]
- 51.Moh MC, Zhang T, Lee LH, Shen S. Expression of hepaCAM is downregulated in cancers and induces senescence-like growth arrest via a p53/p21-dependent pathway in human breast cancer cells. Carcinogenesis. 2008;29:2298–305. doi: 10.1093/carcin/bgn226. [DOI] [PubMed] [Google Scholar]


