

Abstract
The respiratory supercomplex factor 1 (Rcf 1) in Saccharomyces cerevisiae binds to intact cytochrome c oxidase (CytcO) and has also been suggested to be an assembly factor of the enzyme. Here, we isolated CytcO from rcf1Δ mitochondria using affinity chromatography and investigated reduction, inter-heme electron transfer and ligand binding to heme a3. The data show that removal of Rcf1 yields two CytcO sub-populations. One of these sub-populations exhibits the same functional behavior as CytcO isolated from the wild-type strain, which indicates that intact CytcO is assembled also without Rcf1. In the other sub-population, which was shown previously to display decreased activity and accelerated ligand-binding kinetics, the midpoint potential of the catalytic site was lowered. The lower midpoint potential allowed us to selectively reduce one of the two sub-populations of the rcf1Δ CytcO, which made it possible to investigate the functional behavior of the two CytcO forms separately. We speculate that these functional alterations reflect a mechanism that regulates O2 binding and trapping in CytcO, thereby altering energy conservation by the enzyme.
Introduction
The mitochondrial respiratory chain couples electron transfer to proton translocation across the inner membrane, thereby maintaining a proton electrochemical gradient that drives transmembrane transport as well as formation of ATP. The final electron acceptor is cytochrome c oxidase (CytcO), which catalyzes oxidation of the one-electron donor cytochrome c (cyt. c) and reduction of the four-electron acceptor O2 (for review, see e.g.1,2.). In S. cerevisiae the stability, assembly and activity of CytcO is regulated by at least three proteins, the respiratory supercomplex factors (Rcf) 1 and 23–6, and the cytochrome oxidase interacting protein (Coi) 17. The Rcf1 protein has multiple roles. It has been identified as an assembly factor of CytcO8, but it also acts to increase the relative concentration of the CytcO-cyt. bc1 supercomplex3,4,6. Additionally, Rcf1 regulates the activity of CytcO. Genetic removal of the protein results in a decrease in the O2-reduction activity to ~30% of that observed for CytcO in wild-type mitochondria4,9, presumably due to structural changes in a fraction of the CytcO population10,11. These structural changes are most noticeably reflected in changes in the kinetics of CO-ligand binding, which is accelerated by a factor of ~102. Furthermore, data obtained with intact mitochondria suggested that a CytcO sub-population in the rcf1Δ mitochondria was reduced at lower redox potential than CytcO from the wild-type mitochondria10.
Upon purification of CytcO using affinity chromatography a mixture of two functionally distinct populations were isolated from the rcf1Δ mitochondria11. Here, we investigated ligand binding to heme a3 and internal electron transfer between hemes a and a3 as a function of the reduction pressure on the purified CytcO. The aim was to selectively reduce one of the two sub-populations of the rcf1Δ CytcO at a time such that the functional behavior of the two forms of the CytcO could be investigated separately.
Results from earlier studies have shown that incubation of CytcO under CO atmosphere, i.e. in the absence of O2, results in gradual reduction of the enzyme. In this redox reaction CO is oxidized to CO2 while two electrons are transferred to CytcO. Because at a pressure of 105 Pa the CO concentration in solution is ~1 mM, a negligible amount of CO is consumed to reduce CytcO (µM concentration) in the above reaction. Upon reduction of heme a3 (and CuB, which is reduced before heme a3), another CO molecule binds to the reduced heme a3 thereby increasing its apparent midpoint potential12. Consequently, the catalytic site becomes reduced (with CO bound to heme a3) while heme a and CuA remain oxidized, referred to as the “mixed-valence” state. The overall reaction is:
| 1 |
Because CO stabilizes the reduced state of heme a3, upon dissociation of the ligand an electron is transferred from heme a3 to heme a. With e.g. the Rhodobacter sphaeroides CytcO the time constant of this electron transfer is ~3 µs13, even though faster components have been identified14. The extent of the inter-heme electron transfer varies between CytcOs from different species depending on the relative midpoint potentials of hemes a and a3.
The data show that CO did reduce the catalytic site of the S. cerevisiae CytcO forming the mixed-valence-CO complex. In CytcO purified from the rcf1Δ mitochondria, initially CO reduced the catalytic site only in an enzyme sub-population that displayed the same behavior as CytcO isolated from the wild-type strain. Only upon further incubation we did observe reduction of a structurally altered sub-population. The difference in the midpoint potentials of the redox sites in the two CytcO sub-populations allowed us to investigate the functional behavior of the two CytcO forms separately. The data indicate that (i) the presence of Rcf1 stabilizes an intact form of CytcO, but Rcf1 is not strictly required for formation of this intact CytcO, and (ii) removal of Rcf1 results in a fraction CytcO with a lowered midpoint potential of the catalytic site, but an increased rate of ligand binding. These functional alterations suggest a mechanism to regulate O2 binding, reduction and energy conservation in the S. cerevisiae CytcO.
Results
Ligand binding
We prepared His-tagged (at Cox6) CytcO, isolated from the rcf1Δ strain, using affinity chromatography. Figure 1 shows absorbance spectra of the rcf1Δ CytcO before and after addition of CO and dithionite. The peak at 602 nm is associated mainly (80%) with absorption by reduced heme a. The fully oxidized form, obtained by addition of ferricyanide, is indicated by the dashed line in Fig. 1. This spectrum was determined only as a reference. Ferricyanide was not used in the experiments discussed below because it interferes with reduction by CO. Instead, we used the air-oxidized CytcO, “as isolated” CytcO, which contained ~20% reduced heme a (black spectrum in Fig. 1). Upon incubation with CO, the catalytic site (heme a3 and CuB) was reduced and CO was bound to heme a3. Careful titration of this sample with ferricyanide yielded the mixed-valence-CO complex (red spectrum in Fig. 1). We refer to this state as “reduction level 2” to indicate that the CytcO fraction which is reduced carries on average two electrons per CytcO (see Discussion). Here, the 602-nm peak was smaller than in the other spectra because heme a was essentially fully oxidized (~90%). The peak at ~590 nm originates from the heme a3-CO complex.
Figure 1.
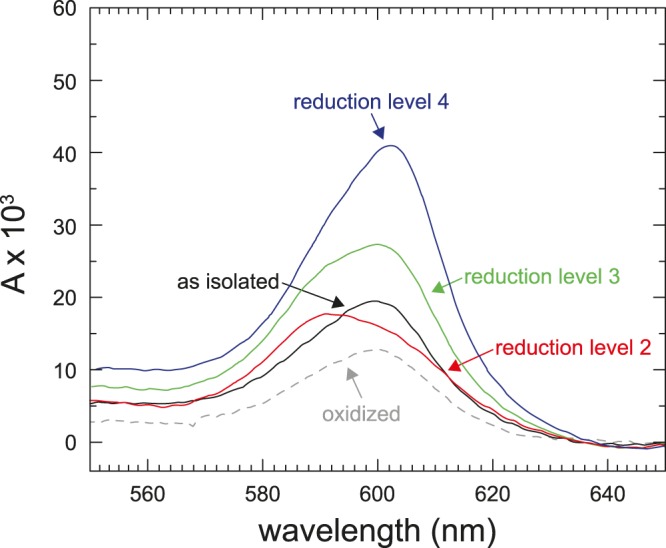
Absorption spectra of CytcO isolated from an rcf1Δ strain. The peaks at 602 nm and ~590 nm are associated with absorption by heme a (~80%) and the heme a3-CO complex, respectively. The spectrum of the “as isolated” CytcO (black) was taken under N2 atmosphere. The mixed-valence (2-electron reduced, reduction level 2) CO-bound form was obtained by incubation under CO atmosphere and careful titration with ferricyanide (red). The sample in reduction level 3 (~50% reduced heme a) was obtained after incubation with CO for 16 hours (green). The fully reduced CytcO (reduction level 4) was obtained after addition of 2 mM dithionite (dark blue). The spectrum of the oxidized CytcO was obtained upon addition of 1 mM ferricyanide to the “as-isolated” CytcO under air atmosphere (dashed line). Experimental conditions: ~1.5 µM CytcO, 150 mM KCl, 10% glycerol, 20 mM Hepes, pH 8.0 and 0.035% DDM, T ≅ 22 °C.
When the mixed-valence state of CytcO was further reduced by long term incubation with CO (~16 hours), we observed reduction of heme a in ~50% of the population (green spectrum in Fig. 1). We refer to this state as “reduction level 3” to indicate that on average the CytcO is more reduced than in reduction level 2. Addition of dithionite resulted in full reduction of the CytcO with CO bound to heme a3 (dark blue spectrum), referred to as “reduction level 4”.
Figure 2A shows absorbance changes at 445 nm after light-induced CO dissociation of the mixed-valence CytcO (red trace). The initial increase in absorbance at t = 0 is associated with dissociation of the CO ligand, followed in time by a decrease in absorbance indicating recombination (CO ligand rebinding) with a time constant of 8.2 ± 0.3 ms (SD, n = 5), which was the only observed kinetic component over the shown time scale in the main panel. We refer to the population of CytcO that displays this 8.2-ms kinetic component as population I (indicated in Fig. 2B, see also the Discussion section). We observed also a small 2-µs component, seen in the inset and discussed below.
Figure 2.
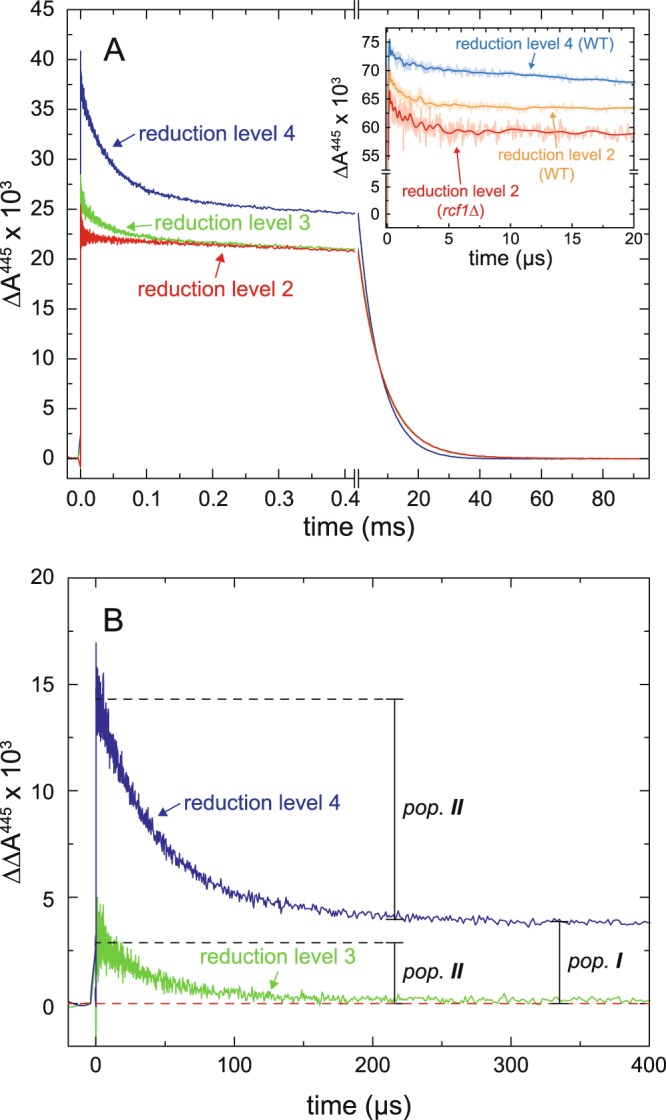
Absorbance changes at 445 nm associated with dissociation and recombination of CO from CytcO isolated from an rcf1Δ strain. (A) The reduction level of the samples is indicated in the graph. The same color code is used as for the spectra and conditions were the same as in Fig. 1. The inset shows absorbance changes monitored over a shorter time scale. The decay in absorbance with a time constant of ~2 µs seen with the mixed-valence CytcOs (orange and red traces for wild-type or rcf1Δ CytcO, respectively) is associated with electron transfer between hemes a3 and a. The larger slope observed with the fully reduced than with the mixed-valence CytcO is due to faster CO recombination in the former. (B) Additional absorbance changes upon forming reduction levels 3 and 4, respectively, from CytcO in reduction level 2. The absorbance changes are differences between the green and red, and blue and red changes in panel A, respectively. We interpret the two kinetic components in terms of two CytcO populations referred to as I and II, respectively. Experimental conditions were the same as in Fig. 1.
Next, we measured light-induced absorbance changes with the sample in which heme a was 50% reduced, i.e. at reduction level 3 (Fig. 1, green spectrum). As seen in Fig. 2A (green trace), pulsed illumination of this CytcO resulted in absorbance changes that were similar to those observed with the mixed-valence CytcO (reduction level 2). However, in addition to the 8.2-ms CO-recombination component, we observed a component with a time constant of 35 ± 2 µs (SD, n = 9) and an amplitude of 19 ± 6% (range of values, n = 2) of the total absorbance change. Figure 2B shows the difference between the green and red traces in panel A over a shorter time scale of 400 µs. This difference represents the absorbance changes, associated with ligand binding, after short-term and long-term incubation of the CytcO with CO. As seen in this figure, the further reduction of the sample resulted in appearance of only the rapid CO-recombination component with a time constant of ~35 µs. We refer to the CytcO subpopulation displaying the rapid component as population II (see Discussion).
Upon addition of dithionite all four redox sites of CytcO became reduced (blue spectrum in Fig. 1, reduction level 4). In this state the time constant of the slow component decreased slightly to 6.6 ± 0.5 ms (SD, n = 5) and the amplitude increased (Fig. 2, dark blue traces). The relative amplitude of the rapid component (τ = 39 ± 2 µs, SD, n = 5) increased to 33 ± 3% (SD, n = 3) of the total absorbance changes at 445 nm.
Internal electron transfer
As described in the Introduction section, results from earlier studies have shown that after light-induced CO dissociation from the mixed-valence CytcO the electron at heme a3, stabilized by the binding of CO prior to the flash, equilibrates with heme a over a µs time scale. The inset of Fig. 2A shows absorbance changes at 445 nm over a shorter time scale of 20 µs. After the rapid increase in absorbance associated with CO dissociation we observed a decrease in absorbance with a time constant of ~2 µs, associated with electron transfer from heme a3 to heme a (see13) (orange trace). This rapid absorbance change was also observed with the fully reduced CytcO (light blue trace), but its amplitude was smaller. The observation of a small 2-µs component also with the fully-reduced CytcO presumably reflects transient CO binding to CuB, which in the mixed-valence CytcO triggers the inter-heme electron transfer14. The 2-µs electron transfer was also observed with the mixed-valence CytcO isolated from the rcf1Δ mitochondria (Fig. 2A, inset over a shorter time scale than the main graph, red trace).
As seen in Fig. 2A, the CO recombination was slower (by ~20%, see above) with the mixed-valence than with the fully reduced CytcO. The reason is that in the former a fraction heme a3 is oxidized as a result of electron transfer to heme a, i.e. during the recombination process the fraction reduced heme a3 is decreased. The extent of heme a3 to heme a electron transfer was consistent with the difference in CO-recombination rates, which slows due to a fraction oxidized heme a3 during the rebinding process13.
Effect of imidazole
In the present work we studied CytcO that was purified by means of Ni-affinity chromatography with a His10-tag on subunit Cox6. Imidazole was used for elution. This enzyme displayed a 35-µs CO-recombination component also when isolated from the wild-type mitochondria, suggesting structural changes. Furthermore, for CytcO isolated from the rcf1Δ strain the component was larger than that seen with the protein-C purified variant11. The kinetic difference spectra of the 35-µs and 6-ms components seen with the wild-type and rcf1Δ CytcO are shown in Fig. 3A,B. They are about the same as those observed for the rcf1Δ CytcO isolated using the protein-C tag. These results suggest that the exposure to imidazole induces the same structural alteration as removal of Rcf1 alone. To further investigate the effect of imidazole we incubated the wild-type CytcO isolated using a protein-C tag11 in a buffer containing imidazole (300 mM, at pH 8.9) for 1 hour and measured absorbance changes associated with CO recombination (Fig. 3C). As seen in the figure, the amplitude of the 35-µs component increased significantly. Next, we measured the O2-reduction activity of CytcO that had been incubated with imidazole. The CytcO purified from wild-type strains showed a decrease in activity, which after ~180 min yielded ~60% activity (Fig. 3D). Over the same time, we observed up to ~20% precipitation of the CytcO (the reduced-oxidized difference spectrum remained the same, but the amplitude of the peaks decreased over time, not shown). In the activity measurements we normalized the measured rates to the 602 nm absorbance for each time point.
Figure 3.

Ligand binding and activity of CytcO. The CytcO from the wild-type (A) and rcf1Δ (B) strains was purified using Ni-affinity chromatography. The protein was eluted with imidazole. Absorbance changes after flash-induced CO dissociation were measured in the wavelength range 400–470 nm. The traces were fitted with a sum of two exponentials and the amplitudes of the two components, rapid (τ ≅ 35 μs) and slow (τ ≅ 6 ms; open circles), are plotted. (C) Kinetic difference spectra for the slow and rapid components in the CO-recombination obtained at ~1 hour after after addition of 300 mM imidazole. Experimental conditions: ~0.1–0.5 µM CytcO, 4 mM sodium ascorbate, 2 μM PMS, 1.3 mM CO, 20 mM Tris, pH 7.5, 100 mM NaCl, 0.035% DDM, T ≅ 22 °C. (D) The O2-reduction activity of purified CytcO was measured at specific time points after addition of 300 mM imidazole. It was normalized to the amount of heme a in the sample at every time point (diminished with time as a result of precipitation). The initial rate just after addition of imidazole was set to 100%. Experimental conditions (panel D): 67 mM KPi, pH 6.8, 0.1 mM EDTA, 0.035% DDM, 20 mM ascorbate, 40 µM TMPD and 50 µM cyt. c from S. cerevisiae. The reaction was started upon addition of 10 nM CytcO (protein C-tagged).
We also tested the effect of addition of 300 mM imidazole (pH 8.9) on the activities of CytcOs (cyt. aa3) from Rhodobacter sphaeroides and from bovine heart (data not shown). In both cases we observed an initial drop in activity by ~15%, but the activity then remained unaltered, i.e. no time-dependent changes were observed.
The effect of imidazole was studied because both removal of Rcf1 and exposure of CytcO to imidazole yield similar effects, which allowed us to discuss the origin of the changes at a molecular level (see Discussion).
The Rcf1-CytcO interaction surface is not known, but data from a number of studies suggest that subunits Cox3, Cox12 and Cox13 are involved3,4,6. To exclude indirect effects of the removal of Rcf1 as a cause of the 35-µs component, we analyzed the CytcO for the presence of Cox12 and Cox13. Figure S1 shows a western blot confirming the presence of both subunits in the purified wild-type and rcf1Δ CytcOs.
O2-reduction activity
Results from earlier studies have shown that O2 binds weakly and reversibly to the catalytic site of CytcO, but is trapped by rapid electron transfer from heme a to heme a3 yielding an apparent high affinity for O215. The KM, i.e. the O2 concentration at which the turnover rate is 1/2 of the maximum rate, was found to be in the µM range16. Here, we determined the KM values for CytcO isolated from the wild-type and rcf1Δ mitochondria. Figure 4 shows the O2-reduction rate as a function of O2 concentration for [O2] ≤ 100 µM (slope of [O2] as a function of time). Both traces could be fitted with a Michaelis-Menten equation (dashed lines in Fig. 4) where the KM values were 4.7 ± 0.8 µM and 3.5 ± 0.6 µM for the wild-type and rcf1Δ CytcOs, respectively (SD, n = 3). The maximum rates were 120 ± 14 nmol O2 ml−1min−1 (800 s−1) and 78.2 ± 6.3 ml−1min−1 (520 s−1), respectively (SD, n = 3). The decrease in the maximum turnover rate upon removal of Rcf1 in the detergent-purified CytcO is consistent with earlier observations11.
Figure 4.
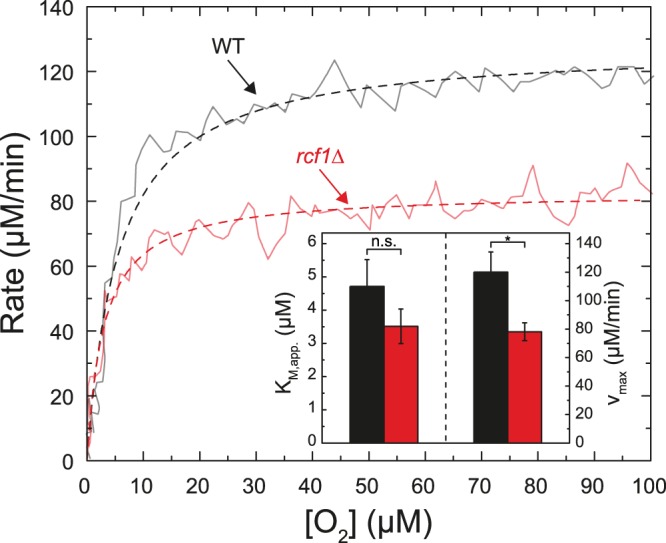
Oxygen-reduction rate. The O2-reduction rate as a function of time was determined using a Clark-type oxygen electrode. The starting O2 concentration was ~100 µM. For each O2 concentration the slope (rate) was determined. Data obtained with CytcO purified from the wild type (black) or rcf1Δ (red) strains are shown. The traces were fitted with a Michaelis-Menten equation (dashed lines). Parameters are shown in the inset. Experimental conditions were the same as in Fig. 3D, except that 1/2 of the buffer volume was incubated under an N2 atmosphere to yield lower starting O2 concentrations; *p < 0.025.
Discussion
We have investigated functional characteristics of the two CytcO sub-states isolated using affinity chromatography from the rcf1Δ mitochondria. As already outlined above, results from earlier studies have shown that a typical feature of structural changes in CytcO, caused by the removal of Rcf1, is a rapid CO-recombination component with a time constant of 35 µs. This kinetic component is ~102 times faster than that of CO binding to intact CytcO (τ ≅ 6 ms). In mitochondria isolated from the rcf1Δ strain the rapid component comprised ~60% of the total absorbance change at 445 nm9. Because a fraction of the structurally altered CytcO did not bind to the affinity column, the relative amplitude of this component in the purified CytcO was smaller (~30% at 445 nm)11.
As seen in Fig. 2A, the rapid component was not observed under conditions when only the mixed-valence CytcO was formed (red trace), i.e. in a state in which the catalytic site is reduced while heme a and CuA are oxidized. The rapid CO-recombination component appeared only upon further reduction or addition of dithionite (see Fig. 2B). As discussed above, upon incubation of the oxidized CytcO with CO, each CytcO accepts two electrons from a CO molecule, while another CO molecule binds to heme a3 to form the mixed-valence-CO complex. At neutral pH, this complex is typically formed within one hour of incubation at room temperature (see12 for data with the bovine heart CytcO). Further incubation results in gradual reduction of heme a, but the fully (4-electron) reduced state is never achieved.
The data show that prolonged incubation of the CytcO resulted in a ~50% reduction of heme a (Fig. 1, green spectrum). The amplitude fraction of the rapid CO-recombination component was ~19% (Fig. 2, green trace). Upon full reduction of CytcO by addition of dithionite (Fig. 1, blue spectrum) the amplitude fraction of the rapid component increased to ~33% (Fig. 2, dark blue trace). Thus, these results indicate that the amplitude of the rapid component approximately (within the error, see Results) scales with the reduction level of heme a.
We offer two explanations for the observed behavior: (i) the 35-µs component is consequence of reduction of heme a, i.e. it is not seen with the mixed-valence CytcO because in this state heme a is oxidized. This explanation is consistent with the correlation of the relative contribution of the 35-µs component to the total absorbance change and the degree of heme a reduction as outlined above. (ii) The rapid component originates from a fraction CytcO in which the midpoint potential of the catalytic site is lowered (population II) or in which reduction by CO is kinetically impaired. In other words, initially only the intact fraction CytcO would be reduced by CO (population I) and after prolonged incubation (and addition of dithionite) also an increasing fraction of the structurally altered CytcO would be reduced along with reduction of heme a in both CytcO populations.
We note that explanation (i) would imply that reduction of heme a results in structural changes at the catalytic site, which we find unlikely. Furthermore, results from earlier studies showed that a fraction of CytcO in mitochondria isolated from the rcf1Δ strain could not be reduced by ascorbate10, which suggests that in these mitochondria a fraction of the CytcO hemes are in a structurally altered environment and thus exhibit a lower midpoint potential. These observations support explanation (ii) above. This scenario is also summarized schematically in Fig. 5 and described in detail in the figure legend. In short, we suggest that initially only the intact CytcO is reduced (i.e. population I) by two electrons to form the mixed-valence state in which heme a3 and CuB are reduced (with CO bound to heme a3) while heme a and CuA are oxidized. This enzyme population displays the slow CO-recombination component. Above, we referred to this state as “reduction level 2” to indicate that the CytcO in population I forms the 2-electron reduced mixed-valence state, but population II remains oxidized. After further incubation under reductive conditions the structurally altered population (II) becomes reduced (reduction level 3) and binds CO, which results in appearance of the rapid CO-recombination component. Here, the average reduction level of heme a is 50%, but most likely heme a in populations I and II is reduced to different degrees. The most important difference between the samples in reduction levels 2 and 3 is that only in the latter case the catalytic site of population II becomes reduced, which leads to appearance of the rapid CO-recombination component. Upon addition of dithionite both populations I and II become fully reduced to form the CytcO-CO-complex. Under these conditions populations I and II yield the slow and rapid CO-recombination components, respectively.
Figure 5.

Schematic model. Two CytcO populations are suggested, I and II, based on the data from the flash photolysis experiment. (A) Reduction level 2, i.e. the 2-electron reduced CytcO of population I (red). Only population I is reduced and it displays the same CO-recombination time constant as the wild-type CytcO, i.e. it forms the mixed-valence state with CO bound to heme a3. Light-induced dissociation of this state results in the absorbance changes schematically shown on the long time scale (right). Under conditions when the mixed-valence CO-bound state is formed in population I, the other population II, which is structurally altered, remains oxidized and does not contribute to the observed signals. (B) Reduction level 3 (green). After further incubation under reductive conditions about 50% of heme a becomes reduced. Now also population II becomes partly reduced. Here, a rapid component starts appearing (short time scale, left), which is associated with CO recombination with population II. (C) Reduction level 4, i.e. the fully reduction CytcO (blue). All redox centers in both populations are reduced. Populations I and II display the slow and rapid CO-recombination components, respectively. Empty and filled circles represent oxidized and reduced, respectively redox sites. Stronger red color indicates a larger fraction reduced site.
Next, we address the accelerated CO binding in the structurally altered CytcO (population II). Binding of CO from solution to heme a3 involves transient binding to CuB; the observed CO-recombination rate is determined by both the fraction bound CO to CuB and the rate by which CO is repositioned from CuB to heme a317. Thus, as discussed previously9, accelerated CO recombination in a fraction of CytcO isolated from the rcf1Δ strain is indicative of structural changes around the CuB site. These structural changes would either act to accelerate CO repositioning from CuB to heme a3, to increase the fraction CO-bound CuB or promote direct CO recombination from solution to heme a3.
Any structural changes around the CuB site would also result in changes around heme a3 as the two sites are located in close proximity18. A decreased heme a3 midpoint potential suggests a more polar environment or an increased water access to the catalytic site19. This observation is also consistent with the blue-shift in the reduced minus oxidized and CO-reduced minus reduced difference spectra of heme a311 because an increase in the solvent polarity typically results in in a blue-shift of the absorption maxima as evidenced from studies on myoglobin and hemoglobin20.
A rapid 35-µs component in the CO-recombination reaction was also observed with wild-type CytcO that was incubated with imidazole (Fig. 3) and in CytcO isolated from rcf1Δ mitochondria the amplitude of the rapid component was larger after incubation with imidazole. Furthermore, we observed a gradual loss in activity after incubation with imidazole. Imidazole has been shown to inhibit cyt. bc1 by binding to the heme of cyt. c1, which also resulted in a lower midpoint potential of the heme21. In the present study, the effect of addition of imidazole was very similar to that of Rcf1 removal, which further supports that in a sub-population of the CytcO isolated from rcf1Δ mitochondria the structure of the heme a3 protein environment is altered.
A question arises whether or not changes in the midpoint potential and ligand-binding kinetics would have any functional significance. As already outlined above, results from earlier studies showed that an apparent small KM for O2 binding is result of a weak (cf. large KM) and reversible binding of O2 to the catalytic site, and trapping of O2 by rapid electron transfer from heme a to heme a315. It was suggested that this mechanism is a strategy aimed at avoiding investment free energy in tight O2 binding, but rather trap O2 kinetically at the catalytic site16. As seen in Fig. 4, we did not observe any significant difference in the KM values. Assuming that an increased CO-binding rate in a sub-population of rcf1Δ CytcO also implies an accelerated O2 binding, we speculate that in this sub-population O2-binding is tighter (assuming that O2 dissociation from heme a3 remains unaltered). At the same time the lower midpoint potential of the catalytic site would limit the degree of kinetic trapping of the bound O2 (assuming slower electron transfer upon decreasing the driving force). In other words, in a fraction of the rcf1Δ CytcO the O2-reduction mechanism would yield a lower degree of energy conservation, which may be advantageous if external conditions are such that the organism would benefit from an increased heat production or a larger degree of fermentation.
At present we cannot explain the effect of removing Rcf1 at a molecular level. The data in Figure S1 show that subunits Cox12 and Cox13 remain bound to the CytcO from rcf1Δ mitochondria, i.e. the functional behavior of CytcO from these mitochondria is not a consequence of losing Cox12 or Cox13. We note that the recently-determined structure of Rcf122 shows a dimer with an unusually charged dimer interface. Most likely the monomeric form of Rcf1 interacts with CytcO22, possibly via the charged domain. As already noted above, results from earlier studies indicate that Rcf1 interacts with subunits Cox12 and Cox133,4,6, located near Cox3 that forms a cleft leading through the membrane-spanning part of CytcO to the catalytic site. In other words, binding of Rcf1 may occur in sufficient vicinity to the catalytic site to modulate its structure. Hopefully, future structural studies of the CytcO-Rcf1 complex will offer insights into possible functional effects of this interaction.
In conclusion, the data indicate that removal of Rcf1 results in two CytcO sub-populations that could be purified in a mixture and then kinetically dissected and studied. One of these sub-population displayed unperturbed absorption spectra, CO-recombination kinetics and internal electron transfer (Fig. 2 and11). In the other population the midpoint potential of the catalytic site was lowered and CO recombination was accelerated. Thus, the data reveal structural changes in CytcO that result from removal of Rcf1. On the other hand, the data also show that Rcf1 is not strictly required for correct assembly/function of the CytcO, but removal of Rcf1 yields a fraction of CytcO that has a structurally altered heme a3 protein environment and consequently, an altered functional behavior.
Materials and Methods
Cell growth
The CytcO was purified from two different S. cerevisiae strains: W303a Cox6His10 rcf1Δ as well as that described in11. The gene rcf1 was deleted by homologous recombination using a kanMX4 cassette. To construct the His10-tagged variant of Cox6, the stop codon of the endogenous ORF was replaced by a His10-tag followed by a trp1 selection cassette. A volume of 5 ml YP medium (1% yeast extract, 2% peptone), supplemented with 2% galactose were inoculated and grown at 30 °C and 160 rpm. After 24 h, cells were diluted to 100 ml medium and grown for another 16 h under the same conditions. Cells were then transferred into 200 ml medium and incubated for 8 h at 30 °C while shaking at 160 rpm. Finally, cells were transferred to 2 l medium. After 16 h of incubation, the cells were harvested by centrifugation at 6500 × g (5 min, 4 °C). The cells were then re-suspended in 50 mM KPi, pH 7.0 and pelleted at 6500 × g for 5 min at 4 °C before cell disruption.
Preparation of mitochondrial membranes
Mitochondrial membranes were prepared as in11. In short, cells were disrupted in a Constant Cell Disrupter (Constant Systems). Cell debris was then removed by centrifugation, before membranes were pelleted by ultra-centrifugation and washed in several peletting/resuspension steps. The membranes, re-suspended in a final buffer, were shock-frozen in liquid N2 and stored at −80 °C.
Purification of CytcO
The CytcO was purified using two different protocols as described briefly below.
For experiments in which reduction of heme a3 and CO ligand binding were studied, CytcO was purified using a protocol modified from23. Briefly, mitochondrial membranes were diluted to a concentration of 10 mg protein/ml in 50 mM KPi, pH 8.0. The the sample was incubated with 2% (w/v) DDM (n-dodecyl β-D-maltoside; Glycon) for 1 h on ice. Remaining membrane fragments were removed by centrifugation (15 000 × g,10 min, 4 °C). The cleared lysate was incubated with Ni2+-nitrilotriacetic acid (Ni-NTA) agarose for 2 h at 4 °C while tumbling. The protein-bound resin was washed with 10 column volumes of 150 mM KCl, 10% glycerol, 20 mM Hepes, pH 8.0, 10 mM imidazole and 0.035% (w/v) DDM. CytcO was eluted by incubation with one column volume 150 mM KCl, 10% glycerol, 20 mM Hepes, pH 8.0, 300 mM imidazole and 0.035% (w/v) DDM for 30 min. The elution step was repeated two more times. Imidazole in the buffer was removed by centrifugation (Amicon Ultra Centrifugal Filter Unit, 50 kDa cut-off) and dilution in 150 mM KCl, 10% glycerol, 20 mM Hepes, pH 8.0 and 0.035% DDM. The final CytcO concentration was adjusted to 1–2 µM CytcO. Samples were frozen in liquid N2 and stored at −80 °C until use.
For experiments in which the effect of imidazole was investigated and O2-reduction rate was measured, CytcO was purified from wild type or rcf1Δ strains by Protein C affinity chromatography as reported in11. Also the western blot analysis was performed with this CytcO. Briefly, mitochondrial membranes were incubated with 2% (w/v) DDM and cell debris was removed. The cleared lysate was incubated on a Protein C matrix for 1 hour at 4 °C. CytcO was eluted by several incubation steps with buffer containing 5 mM EDTA. During incubation with imidazole the pH was 8.9.
Flash Photolysis
The purified enzyme was transferred to a Thunberg cuvette in which the atmosphere was exchanged to N2, followed in time by exchange of the atmosphere for CO. The sample was incubated overnight at 4 °C until heme a3 and CuB were reduced (mixed-valence state). Continued incubation in CO resulted in fractional reduction of heme a. If necessary, this state could be converted back to the mixed-valence state by addition of ~100 nM sodium ferricyanide. For observations of the fully reduced state sodium dithionite was added (a few µl from a concentrated, buffered solution) to reach a concentration of 2 mM. The different oxidation states were analyzed spectrophotometrically.
The kinetics of CO recombination to CytcO, after laser-flash induced dissociation of the ligand (~10 ns laser flash, λ = 532 nm, Nd-YAG laser, Quantel), was measured at different wavelengths as described previously11. The changes in absorbance were recorded on a flash-photolysis setup (Applied Photophysics, UK). Results were analyzed using ProK (Applied Photophysics, UK) and Origin 2016 software (OriginLab, USA).
Oxygen reduction
Oxygen consumption of purified CytcO was determined using a Clark-type oxygen electrode. First, a baseline was recorded with buffer containing 67 mM KPi, pH 6.8, 0.1 mM EDTA and 0.035% DDM. Then, we added 20 mM ascorbate, 40 µM N,N,N′,N′-tetramethyl-p-phenylenediamine (TMPD) and 50 µM cyt. c from S. cerevisiae. The reaction was started by addition of 10 nM CytcO. To measure O2 reduction with a low initial O2 concentration, 1/2 of the buffer volume was incubated under N2 atmosphere prior to the experiment and then mixed with the air-equilibrated remaining part of the buffer solution, yielding ~100 µM O2.
Western Blot analysis
Proteins were separated by 16% acrylamide/0.2% bisacrylamide SDS PAGE and transferred to a nitrocellulose membrane (Carl Roth, Germany).
Electronic supplementary material
Acknowledgements
These studies were supported by grants from the Knut and Alice Wallenberg Foundation (KAW) and the Swedish Research Council. We would like to thank Dr. Irina Smirnova for valuable discussions and constructuve comments on this paper.
Author Contributions
H.D. and M.O. designed strains. J.S. performed experiments. P.B., P.Ä., M.O. and J.S. planned research. P.B., J.S. wrote the manuscript and prepared figures. All authors reviewed and commented on the manuscript.
Competing Interests
The authors declare no competing interests.
Footnotes
Electronic supplementary material
Supplementary information accompanies this paper at 10.1038/s41598-018-29567-4.
Publisher's note: Springer Nature remains neutral with regard to jurisdictional claims in published maps and institutional affiliations.
References
- 1.Rich PR, Maréchal A. The mitochondrial respiratory chain. Essays in Biochemistry. 2010;47:1–23. doi: 10.1042/bse0470001. [DOI] [PubMed] [Google Scholar]
- 2.Brzezinski P, Johansson AL. Variable proton-pumping stoichiometry in structural variants of cytochrome c oxidase. Biochimica et Biophysica Acta - Bioenergetics. 2010;1797:710–723. doi: 10.1016/j.bbabio.2010.02.020. [DOI] [PubMed] [Google Scholar]
- 3.Chen YC, et al. Identification of a protein mediating respiratory supercomplex stability. Cell Metabolism. 2012;15:348–360. doi: 10.1016/j.cmet.2012.02.006. [DOI] [PMC free article] [PubMed] [Google Scholar]
- 4.Strogolova V, Furness A, Micaela MR, Garlich J, Stuart RA. Rcf1 and Rcf2, members of the hypoxia-induced gene 1 protein family, are critical components of the mitochondrial cytochrome bc 1-cytochrome c oxidase supercomplex. Molecular and Cellular Biology. 2012;32:1363–1373. doi: 10.1128/MCB.06369-11. [DOI] [PMC free article] [PubMed] [Google Scholar]
- 5.Fischer, F., Filippis, C. & Osiewacz, H. D. RCF1-dependent respiratory supercomplexes are integral for lifespan-maintenance in a fungal ageing model. Scientific Reports5, 10.1038/srep12697 (2015). [DOI] [PMC free article] [PubMed]
- 6.Vukotic M, et al. Rcf1 mediates cytochrome oxidase assembly and respirasome formation, revealing heterogeneity of the enzyme complex. Cell Metabolism. 2012;15:336–347. doi: 10.1016/j.cmet.2012.01.016. [DOI] [PubMed] [Google Scholar]
- 7.Singhal RK, et al. Coi1 is a novel assembly factor of the yeast complex III-complex IV supercomplex. Molecular Biology of the Cell. 2017;28:2609–2622. doi: 10.1091/mbc.e17-02-0093. [DOI] [PMC free article] [PubMed] [Google Scholar]
- 8.Garlich J, Strecker V, Wittig I, Stuart RA. Mutational analysis of the QRRQ motif in the yeast hig1 type 2 protein Rcf1 reveals a regulatory role for the cytochrome c oxidase complex. J. Biol. Chem. 2017;292:5216–5226. doi: 10.1074/jbc.M116.758045. [DOI] [PMC free article] [PubMed] [Google Scholar]
- 9.Rydström Lundin C, Von Ballmoos C, Ott M, Ädelroth P, Brzezinski P. Regulatory role of the respiratory supercomplex factors in Saccharomyces cerevisiae. Proc. Natl. Acad. Sci. USA. 2016;113:E4476–E4485. doi: 10.1073/pnas.1601196113. [DOI] [PMC free article] [PubMed] [Google Scholar]
- 10.Rydström Lundin C, Brzezinski P. Modulation of O2 reduction in Saccharomyces cerevisiae mitochondria. FEBS Lett. 2017;591:4049–4055. doi: 10.1002/1873-3468.12918. [DOI] [PubMed] [Google Scholar]
- 11.Schäfer J, Dawitz H, Ott M, Ädelroth P, Brzezinski P. Structural and functional heterogeneity of cytochrome c oxidase in S. cerevisiae. Biochimica et Biophysica Acta (BBA) – Bioenergetics. 2018 doi: 10.1016/j.bbabio.2018.05.004. [DOI] [PubMed] [Google Scholar]
- 12.Brzezinski P, Malmström BG. The reduction of cytochrome c oxidase by carbon monoxide. FEBS Lett. 1985;187:111–114. doi: 10.1016/0014-5793(85)81224-2. [DOI] [PubMed] [Google Scholar]
- 13.Ädelroth P, Brzezinski P, Malmström BG. Internal electron transfer in cytochrome c oxidase from Rhodobacter sphaeroides. Biochemistry. 1995;34:2844–2849. doi: 10.1021/bi00009a014. [DOI] [PubMed] [Google Scholar]
- 14.Pilet E, Jasaitis A, Liebl U, Vos MH. Electron transfer between hemes in mammalian cytochrome c oxidase. Proc. Natl. Acad. Sci. USA. 2004;101:16198–16203. doi: 10.1073/pnas.0405032101. [DOI] [PMC free article] [PubMed] [Google Scholar]
- 15.Verkhovsky MI, Morgan JE, Wikström M. Oxygen binding and activation: early steps in the reaction of oxygen with cytochrome c oxidase. Biochemistry. 1994;33:3079–3086. doi: 10.1021/bi00176a042. [DOI] [PubMed] [Google Scholar]
- 16.Verkhovsky MI, Morgan JE, Puustein A, Wikström M. Kinetic trapping of oxygen in cell respiration. Nature. 1996;380:268–270. doi: 10.1038/380268a0. [DOI] [PubMed] [Google Scholar]
- 17.Einarsdóttir Ó, et al. Photodissociation and recombination of carbonmonoxy cytochrome oxidase: dynamics from picoseconds to kiloseconds. Biochemistry. 1993;32:12013–12024. doi: 10.1021/bi00096a011. [DOI] [PubMed] [Google Scholar]
- 18.Tsukihara T, et al. The whole structure of the 13-subunit oxidized cytochrome c oxidase at 2.8 Å. Science. 1996;272:1136–1144. doi: 10.1126/science.272.5265.1136. [DOI] [PubMed] [Google Scholar]
- 19.Wirtz M, Oganesyan V, Zhang X, Studer J, Rivera M. Modulation of redox potential in electron transfer proteins: Effects of complex formation on the active site microenvironment of cytochrome b5. Faraday Discussions. 2000;116:221–234. doi: 10.1039/b001520m. [DOI] [PubMed] [Google Scholar]
- 20.Romberg RW, Kassner RJ. Effects of Solvent on the Absorption Maxima of Five-Coordinate Heme Complexes and Carbon Monoxide-Heme Complexes as Models for the Differential Spectral Properties of Hemoglobins and Myoglobins. Biochemistry. 1982;21:880–886. doi: 10.1021/bi00534a011. [DOI] [PubMed] [Google Scholar]
- 21.Kokhan O, Shinkarev VP, Wraight CA. Binding of imidazole to the heme of cytochrome c1and inhibition of the bc1 complex from Rhodobacter sphaeroides: I. equilibrium and modeling studies. J. Biol. Chem. 2010;285:22513–22521. doi: 10.1074/jbc.M110.128058. [DOI] [PMC free article] [PubMed] [Google Scholar]
- 22.Zhou S, et al. Solution NMR structure of yeast Rcf1, a protein involved in respiratory supercomplex formation. Proc. Natl. Acad. Sci. USA. 2018;115:3048–3053. doi: 10.1073/pnas.1712061115. [DOI] [PMC free article] [PubMed] [Google Scholar]
- 23.Meunier B, Maréchal A, Rich PR. Construction of histidine-tagged yeast mitochondrial cytochrome c oxidase for facile purification of mutant forms. Biochemical Journal. 2012;444:199–204. doi: 10.1042/BJ20120116. [DOI] [PubMed] [Google Scholar]
Associated Data
This section collects any data citations, data availability statements, or supplementary materials included in this article.