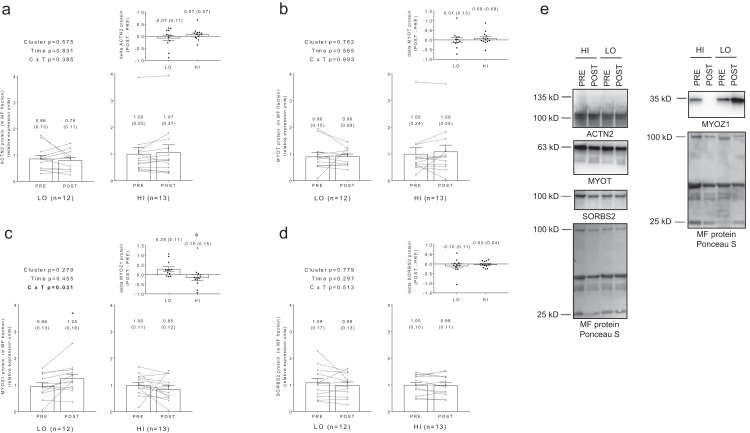
Figure 5. No significant main effects or cluster × time interactions existed for myofibrillar protein levels of ACTN2 (A), MYOT (B), or SORBS2 (D).
A significant cluster × time interaction existed for MYOZ1 (C), and post hoc analysis indicated this marker increased in the LO cluster following training (*, p = 0.025). Additionally, delta MYOZ1 levels were significantly different between clusters (ϕ, p = 0.032). All bar graph data are presented as means ± parenthesized standard error values, and bars are overlaid on individual responses. Additionally, POST—PRE values are presented as insets (A–D). (E) depicts representative Western blot images for each of the presented protein markers in this figure.

